In this THREAD I will explain “Price Action” 1. Formation of a...

CryptoSoulz@SoulzBTC
10 views
Apr 23, 2025
~1 min read
Advertisement
1
In this THREAD I will explain “Price Action”
1. Formation of a Candlestick
2. Power of Three
3. OLHC
4. OHLC
5. Trading examples
🧵(1/8)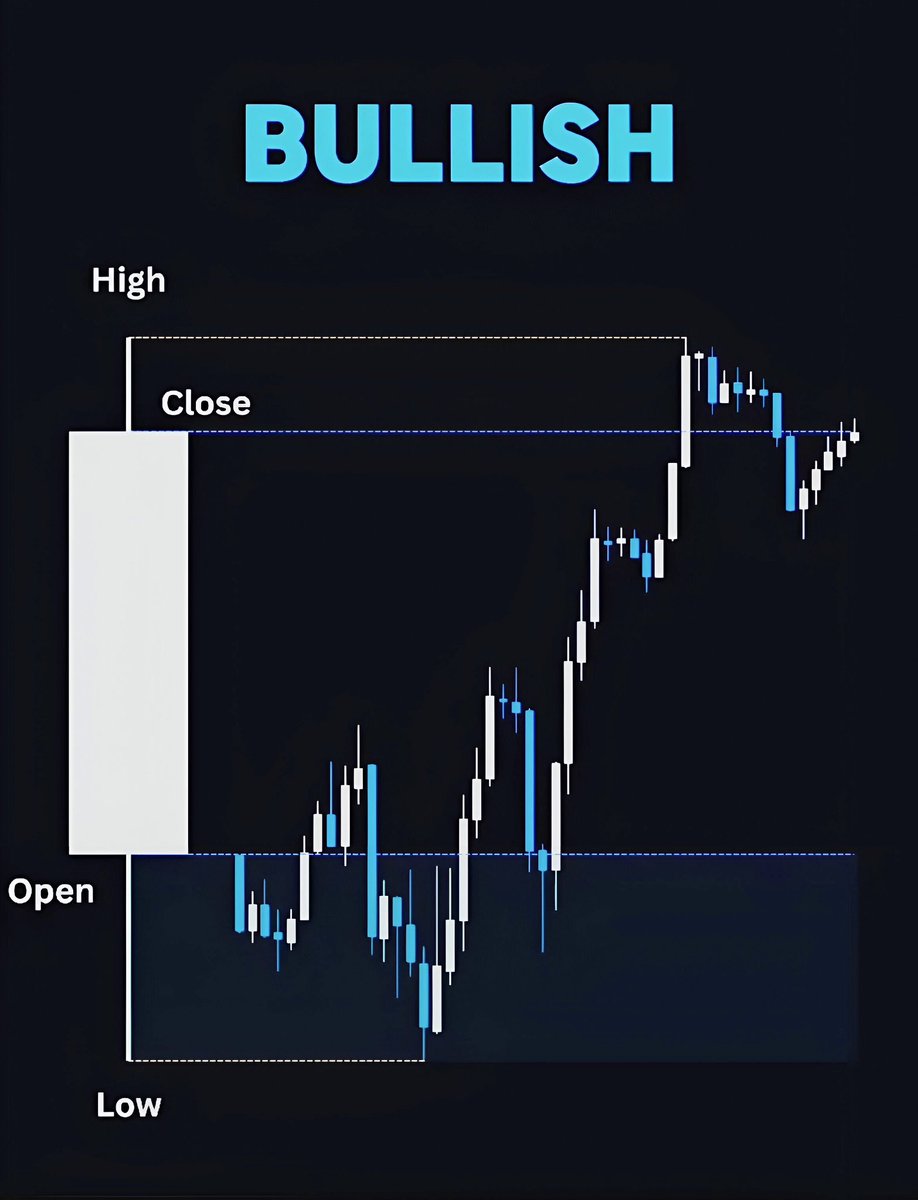
1. Formation of a Candlestick
2. Power of Three
3. OLHC
4. OHLC
5. Trading examples
🧵(1/8)
2
1. Formation of a Candlestick
The first candlestick is BEARISH, they OPEN from TOP to BOTTOM.
The second candlestick is BULLISH, they OPEN from BOTTOM to TOP.
Highs and lows are equal positioned in both candlesticks
The first candlestick is BEARISH, they OPEN from TOP to BOTTOM.
The second candlestick is BULLISH, they OPEN from BOTTOM to TOP.
Highs and lows are equal positioned in both candlesticks
3
2. PO3
Is a strong and proven trading strategy that focuses on 3 main phases: Accumulation, Manipulation and Distribution.
PO3 goal is to make informed decisions in bullish and bearish markets.
It can be used in different TF.
Is a strong and proven trading strategy that focuses on 3 main phases: Accumulation, Manipulation and Distribution.
PO3 goal is to make informed decisions in bullish and bearish markets.
It can be used in different TF.
4
3. OLHC
OLHC stands for Open, Low, High, Close.
As the name suggests, this type of candlestick chart shows the opening, closing, highest, and lowest prices of an asset within a specific TF.
OLHC stands for Open, Low, High, Close.
As the name suggests, this type of candlestick chart shows the opening, closing, highest, and lowest prices of an asset within a specific TF.
5
4. OHLC
An open-high-low-close chart is used to illustrate movements in the price of a financial instrument over time.
Each vertical line on the chart shows the price range (the highest and lowest prices) over one unit of time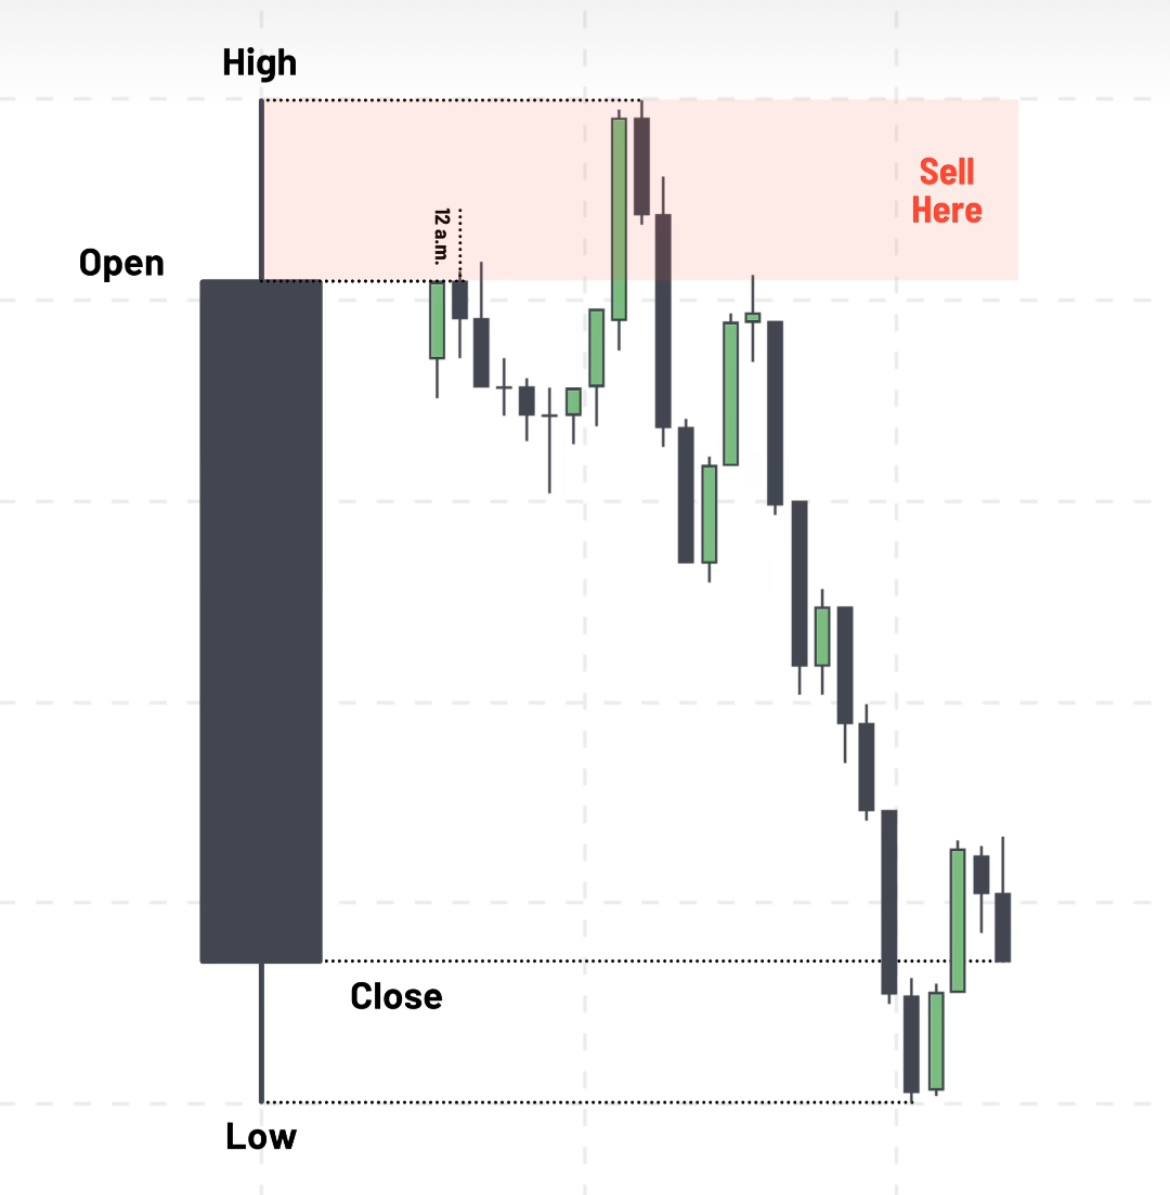
An open-high-low-close chart is used to illustrate movements in the price of a financial instrument over time.
Each vertical line on the chart shows the price range (the highest and lowest prices) over one unit of time
6
5. Trading Examples (OLHC)
Price arrives to Sell Side Liquidity.
This would be a ideal ZONE to accumulate or enter.
If not, wait for a displacement to occur and enter in the next FVG retest.
Price arrives to Sell Side Liquidity.
This would be a ideal ZONE to accumulate or enter.
If not, wait for a displacement to occur and enter in the next FVG retest.
7
5.1 Trading Examples (OLHC)
We enter the trade when price retests FVG and take it as a Support.
Stop Loss should be placed BELOW Sell Side Liquidity.
We enter the trade when price retests FVG and take it as a Support.
Stop Loss should be placed BELOW Sell Side Liquidity.
8
5.2 Trading Examples (OLHC)
Price should expand to Highs from the Lows taken.
This is an example of how price moves where the Liquidity is.
Stop loss always below Daily low.
TP always on the Close or Highs of the day.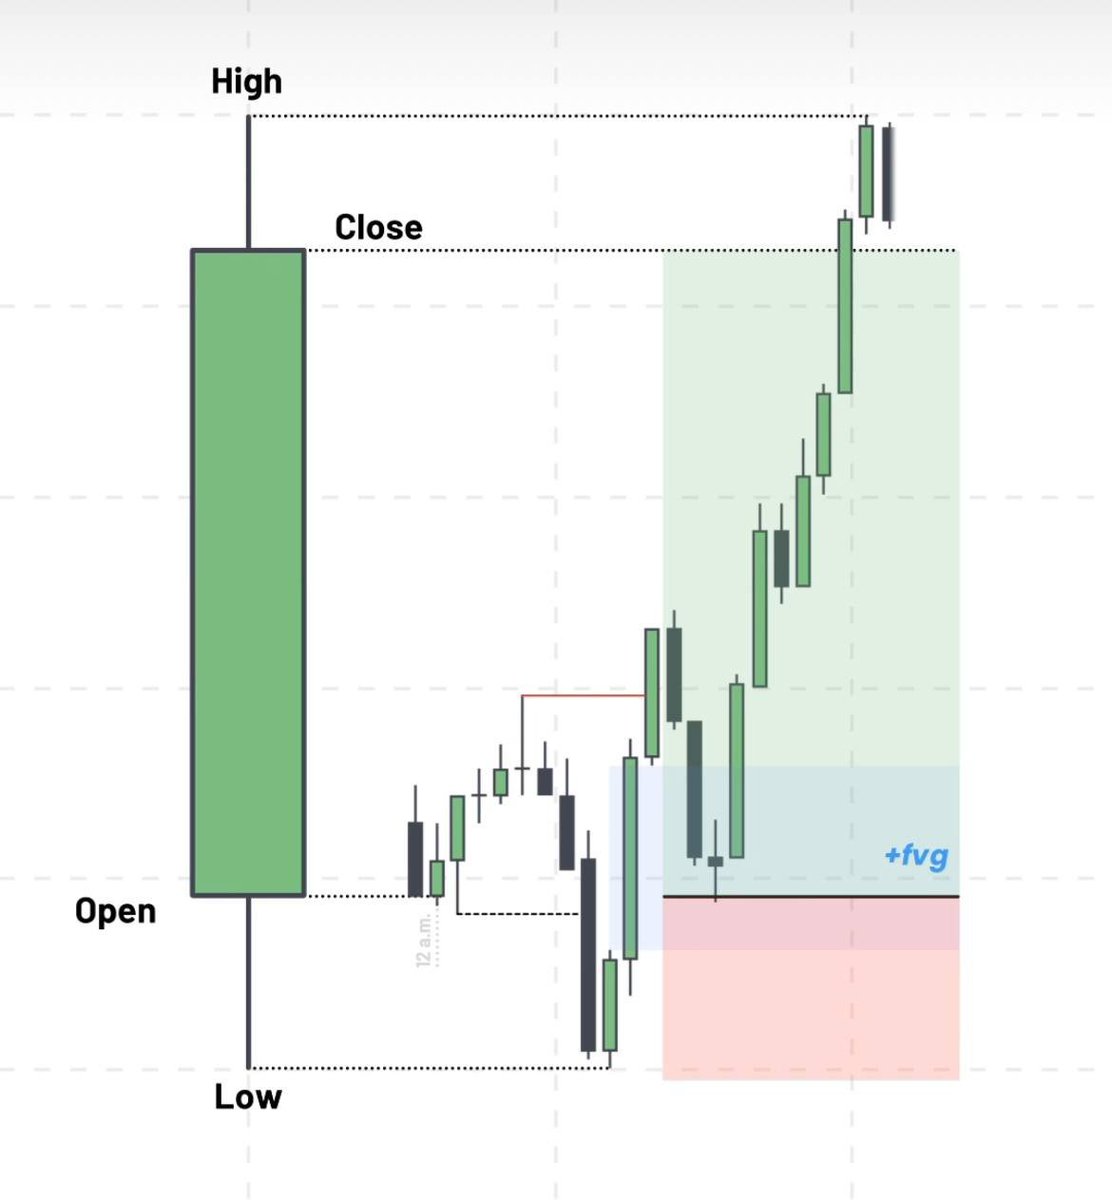
Price should expand to Highs from the Lows taken.
This is an example of how price moves where the Liquidity is.
Stop loss always below Daily low.
TP always on the Close or Highs of the day.