In this THREAD I will explain “Price Action” 1. RSI 2. Trendlines...

CryptoSoulz@SoulzBTC
14 views
Apr 23, 2025
~2 min read
Advertisement
1
In this THREAD I will explain “Price Action”
1. RSI
2. Trendlines
3. Volume
🧵(1/10)
1. RSI
2. Trendlines
3. Volume
🧵(1/10)
2
1. RSI
Is a momentum oscillator that measures the speed and change of price movements-
The indicator is bound between 0 and 100.
When RSI is below 30 means oversold.
When RSI is above 70 means overbought.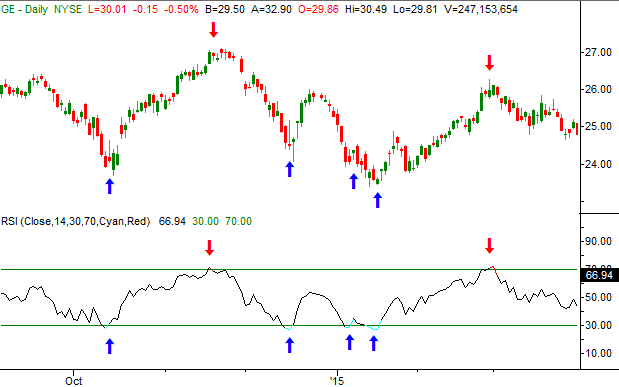
Is a momentum oscillator that measures the speed and change of price movements-
The indicator is bound between 0 and 100.
When RSI is below 30 means oversold.
When RSI is above 70 means overbought.
3
1.1 RSI
To identify trends using RSI:
Draw an uptrend line on the indicator, you need to connect 2 or 3 or more peaks of the RSI indicator as HH points appear.
On the other hand, a descending line is drawn by conecting three or more peaks as the points descend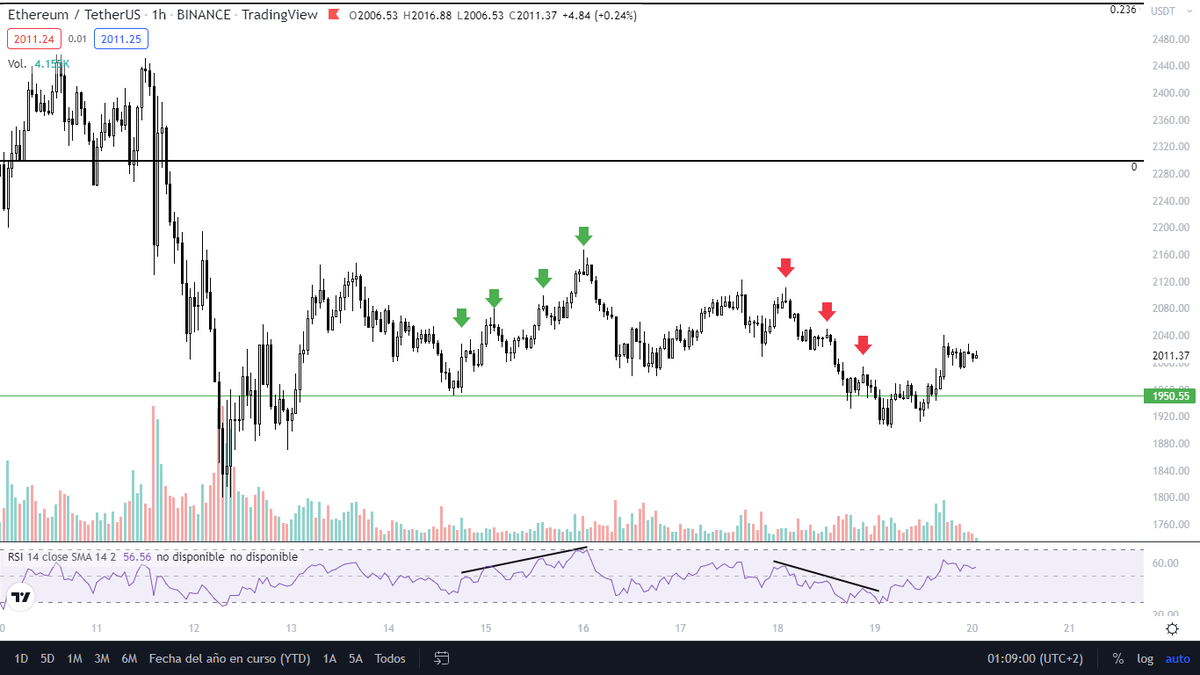
To identify trends using RSI:
Draw an uptrend line on the indicator, you need to connect 2 or 3 or more peaks of the RSI indicator as HH points appear.
On the other hand, a descending line is drawn by conecting three or more peaks as the points descend
4
2. Trendlines
An upward trending line is drawn by joining swing bottoms indicating possible support areas.
At least two sing points are required for drawing atrend line.
A higher degree of angle in an upward sloping trendline can be interpreted as higher prices approaching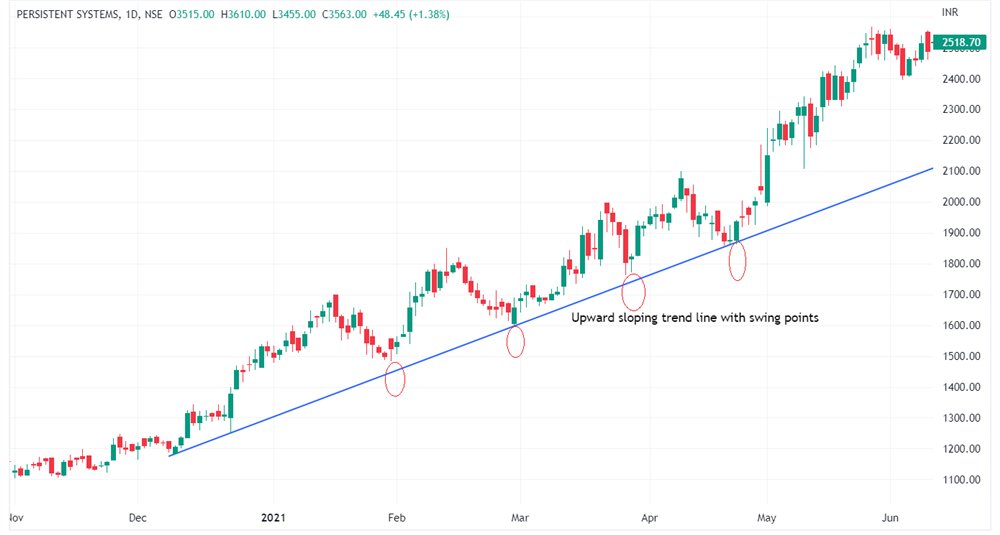
An upward trending line is drawn by joining swing bottoms indicating possible support areas.
At least two sing points are required for drawing atrend line.
A higher degree of angle in an upward sloping trendline can be interpreted as higher prices approaching
5
2.1 Trendlines
Downward sloping trendline is a line that is drawn on a price chart to connect a series of descending peaks.
To draw a downward sloping trendline, you would start by identifying two or more consecutive peaks or swing highs.
Represents a downtrend
Downward sloping trendline is a line that is drawn on a price chart to connect a series of descending peaks.
To draw a downward sloping trendline, you would start by identifying two or more consecutive peaks or swing highs.
Represents a downtrend
6
2.2 Trendlines
Trendline bounces happen when prices spring back in the direction of the original trend after touching the trendline.
A bounce for an uptrend happens when the prices retrace to find support at the trendline bounces off in the direction of the uptrend.
Trendline bounces happen when prices spring back in the direction of the original trend after touching the trendline.
A bounce for an uptrend happens when the prices retrace to find support at the trendline bounces off in the direction of the uptrend.
7
3. Volume
Volume measures the number of times a particular coin changes hands over a certain time frame.
Investors refer to this metric to see how popular it is to sell or buy a particular asset at any given time.
Volume gives hints where the price is heading.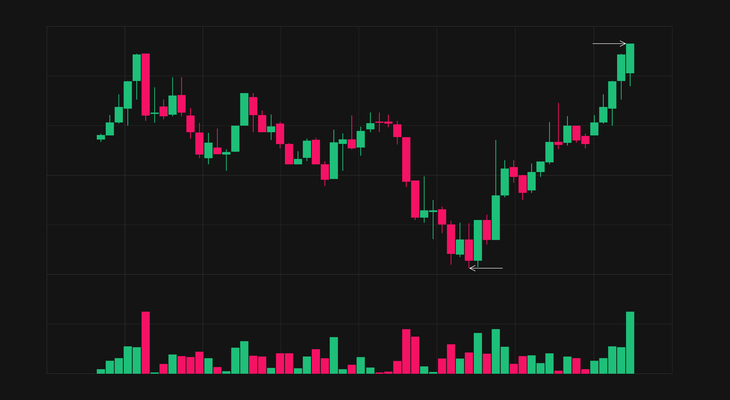
Volume measures the number of times a particular coin changes hands over a certain time frame.
Investors refer to this metric to see how popular it is to sell or buy a particular asset at any given time.
Volume gives hints where the price is heading.
8
3.1 Volume
Low trading volume can indicate a lack of interest in either buying or selling.
Low volume in a downtrend is bullish.
High trading volume that accompanies rising prices, can signal a bullish uptrend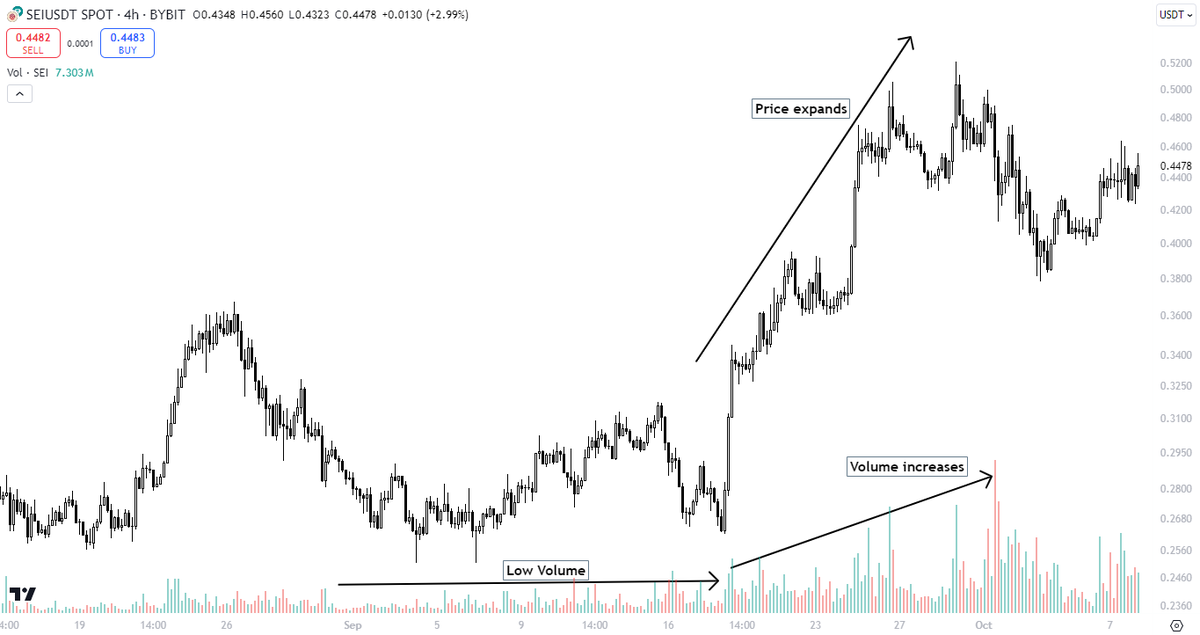
Low trading volume can indicate a lack of interest in either buying or selling.
Low volume in a downtrend is bullish.
High trading volume that accompanies rising prices, can signal a bullish uptrend
9
3.2 Volume profile
A volume profile is a trading indicator that displays the total volume traded at each price level over a specified period of time
It helps you identify key levels of support and resistance, confirm trends, and plan entry and exit points.
A volume profile is a trading indicator that displays the total volume traded at each price level over a specified period of time
It helps you identify key levels of support and resistance, confirm trends, and plan entry and exit points.