In this THREAD I will explain “Basic Trading Indicators” 1. RSI 2....

CryptoSoulz@SoulzBTC
44 views
Mar 17, 2025
~2 min read
Advertisement
1
In this THREAD I will explain “Basic Trading Indicators”
1. RSI
2. MACD
3. Moving Average
🧵(1/12)
1. RSI
2. MACD
3. Moving Average
🧵(1/12)
2
1. RSI
A Bullish Divergence occurs when the security makes a Lower Low but the indicator forms a Higher Low.
A Bearish Divergence occurs when price makes a Higher High but the RSI makes a Lower High
A Bullish Divergence occurs when the security makes a Lower Low but the indicator forms a Higher Low.
A Bearish Divergence occurs when price makes a Higher High but the RSI makes a Lower High
3
1.1 RSI
This chart shows a Bearish Divergence on Bitcoin’s daily timeframe.
Price makes a higher high ($69K), while the RSI forms a lower high, signaling weakening momentum.
This classic bearish divergence often precedes a downtrend, as seen in the following price drop.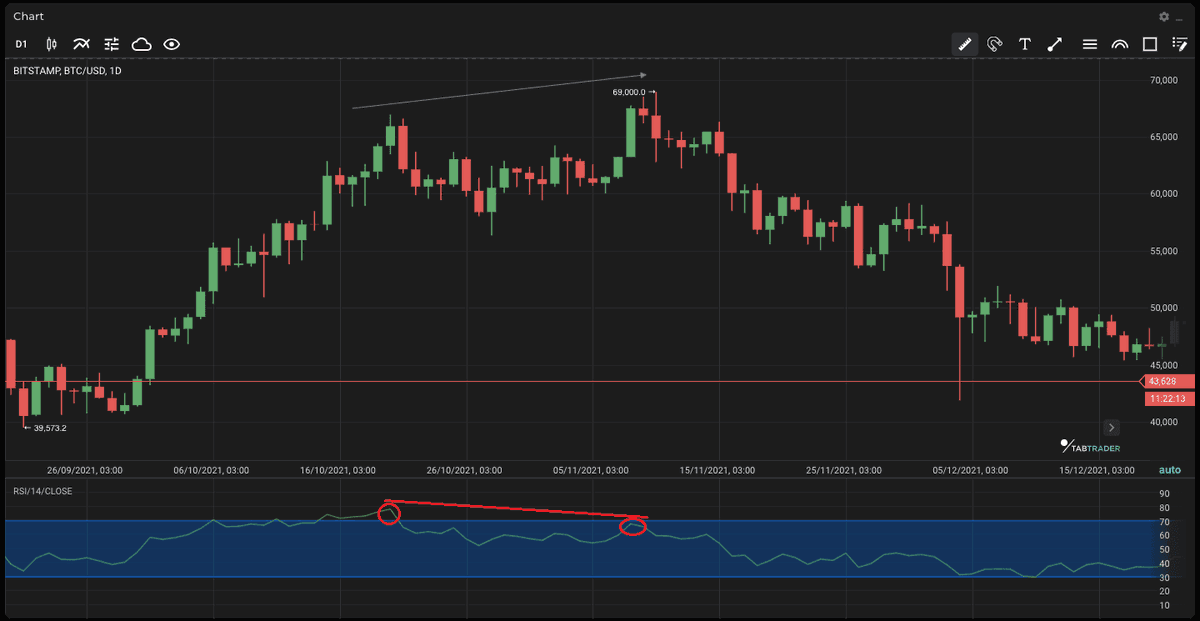
This chart shows a Bearish Divergence on Bitcoin’s daily timeframe.
Price makes a higher high ($69K), while the RSI forms a lower high, signaling weakening momentum.
This classic bearish divergence often precedes a downtrend, as seen in the following price drop.
4
1.2 RSI
This chart shows a bullish divergence on Bitcoin’s daily timeframe.
The price makes a lower low (~$15,479), while the RSI forms a higher low, signaling strengthening momentum.
This divergence often precedes an uptrend, confirmed by the strong rally that follows.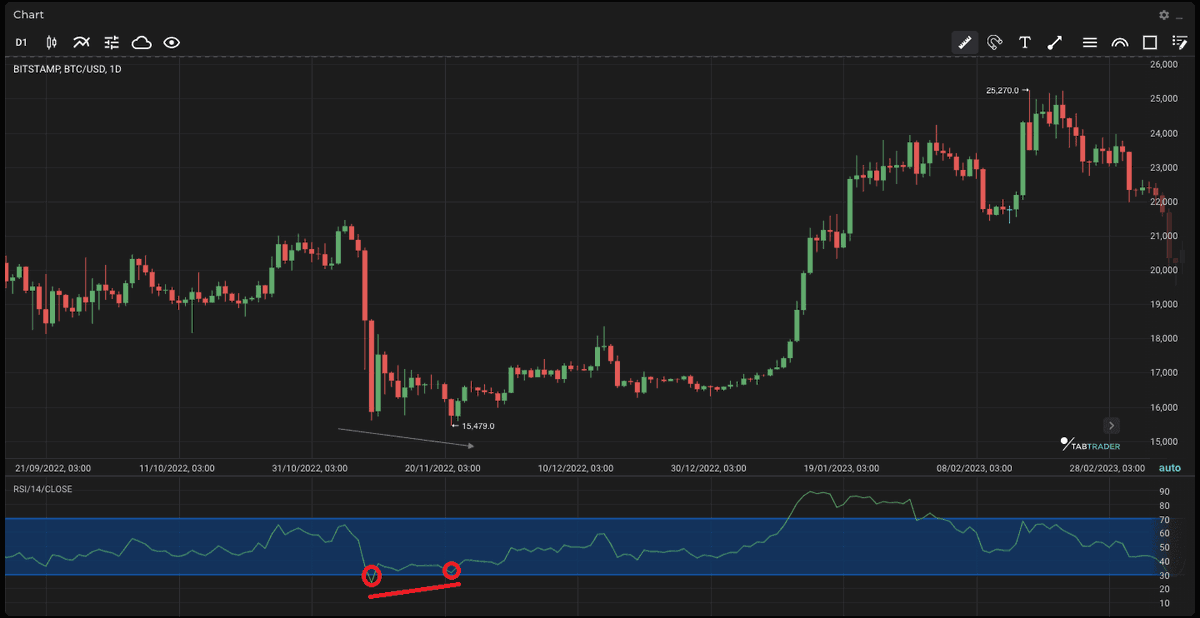
This chart shows a bullish divergence on Bitcoin’s daily timeframe.
The price makes a lower low (~$15,479), while the RSI forms a higher low, signaling strengthening momentum.
This divergence often precedes an uptrend, confirmed by the strong rally that follows.
5
1.3 RSI
If the RSI is above 50, it means that the average gain is greater than the average loss over a given period.
If the 200-period RSI is above 50, then the market is likely in an uptrend and you want to look for buying opportunities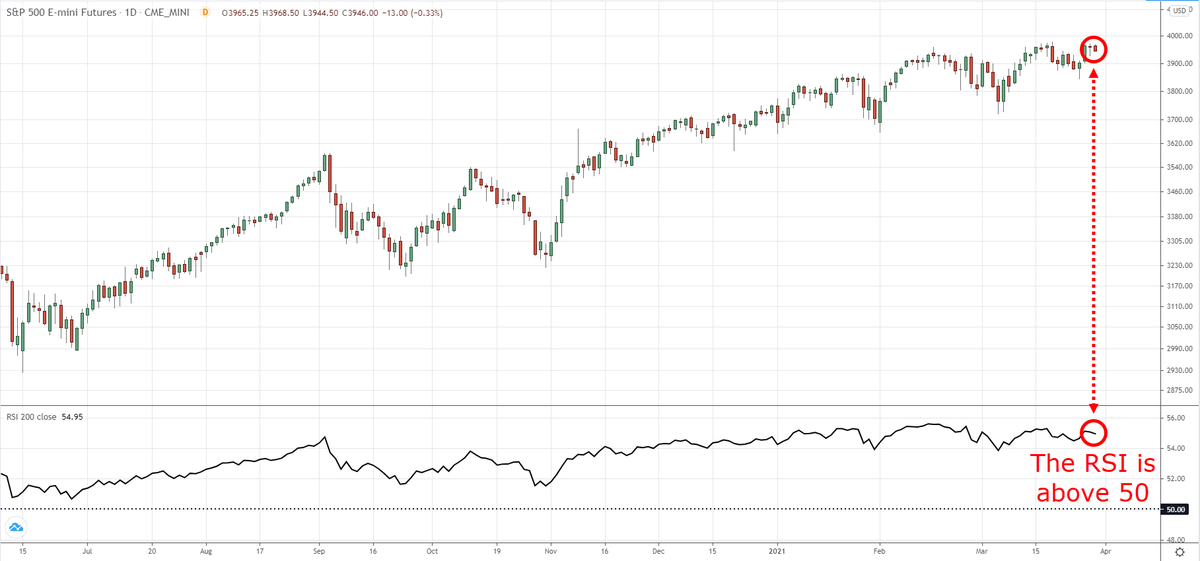
If the RSI is above 50, it means that the average gain is greater than the average loss over a given period.
If the 200-period RSI is above 50, then the market is likely in an uptrend and you want to look for buying opportunities
6
1.4 RSI
This chart shows the RSI below 30, indicating an oversold condition.
When the RSI drops below this level, it suggests potential buying opportunities.
Traders use this signal to anticipate a price recovery.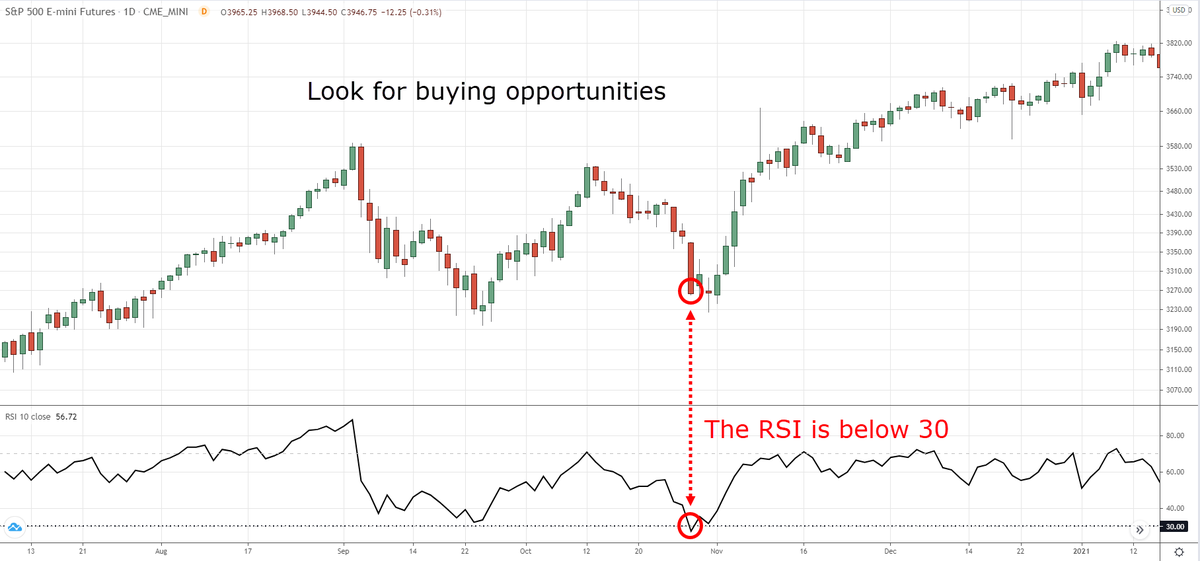
This chart shows the RSI below 30, indicating an oversold condition.
When the RSI drops below this level, it suggests potential buying opportunities.
Traders use this signal to anticipate a price recovery.
7
2. MACD
BULLISH MACD SIGNALS:
When the MACD line crosses above the signal/zero line:
Histogram negativity decreases, and regular/hidden divergences occur.
These indicate potential upward momentum or trend continuation.
BULLISH MACD SIGNALS:
When the MACD line crosses above the signal/zero line:
Histogram negativity decreases, and regular/hidden divergences occur.
These indicate potential upward momentum or trend continuation.
8
2.1 MACD
In this MACD CHEAT SHEET you can find:
- Signal Line Crossover
- Divergence
- Centerline Crossover
Bullish and Bearish trends explained.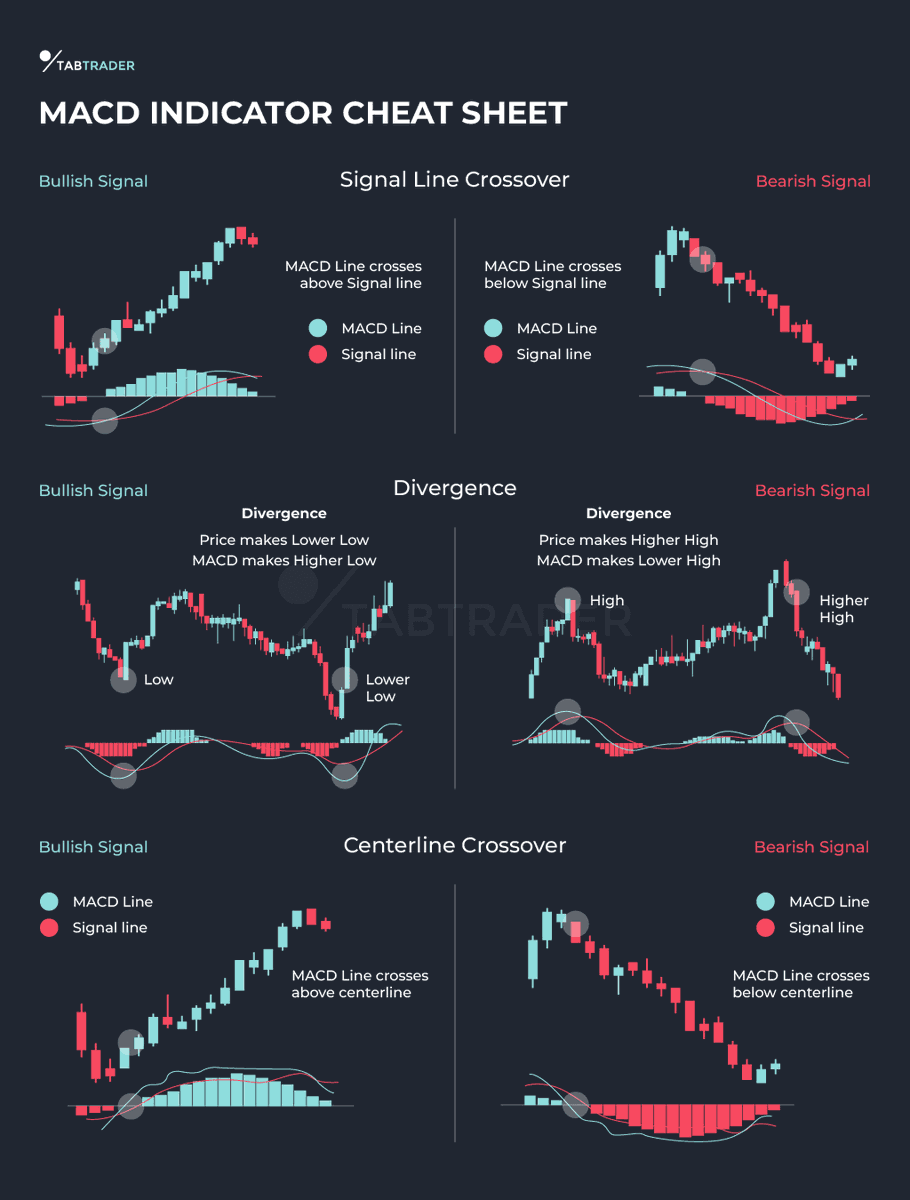
In this MACD CHEAT SHEET you can find:
- Signal Line Crossover
- Divergence
- Centerline Crossover
Bullish and Bearish trends explained.
9
2.2 MACD
When the crossing of the MACD line with the Signal line occurs from the bottom up, the trend will be bullish.
When the crossing of the MACD line with the Signal line occurs from top to bottom, the trend will be bearish.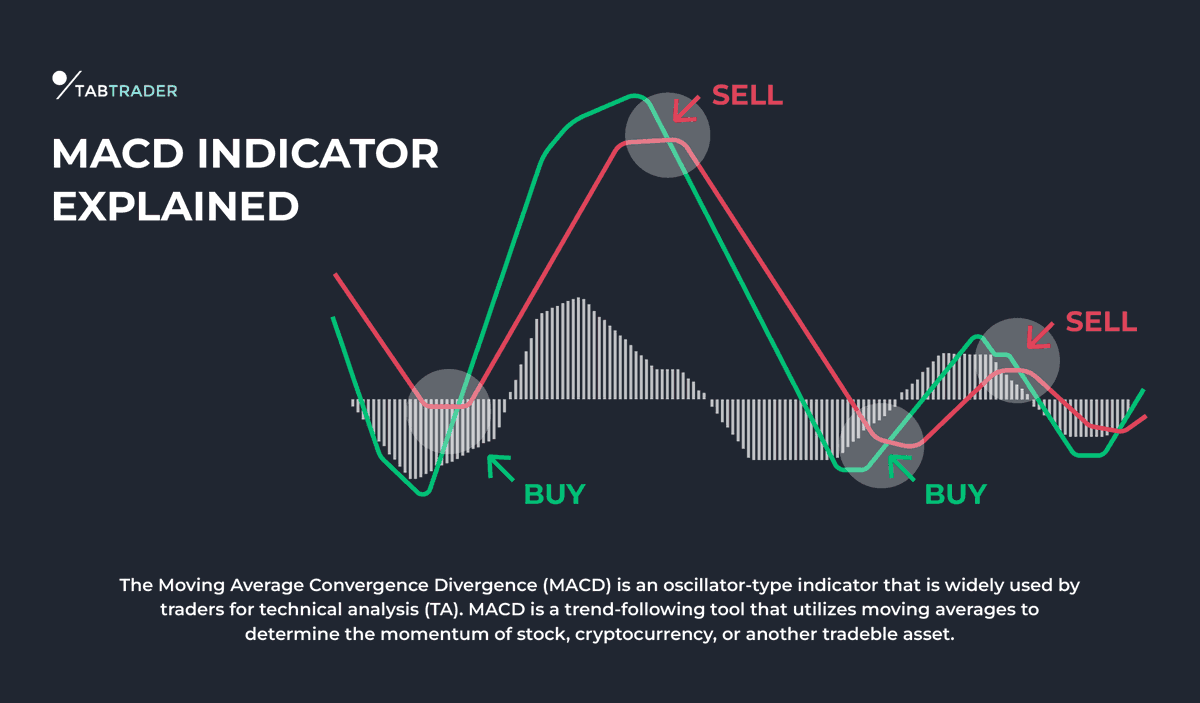

When the crossing of the MACD line with the Signal line occurs from the bottom up, the trend will be bullish.
When the crossing of the MACD line with the Signal line occurs from top to bottom, the trend will be bearish.
10
3. Moving Average
1. EMA: Sensitive to recent price movements. Ideal for short-term trading analysis.
2. SMA: Treats all data points equally, commonly used for long-term analysis.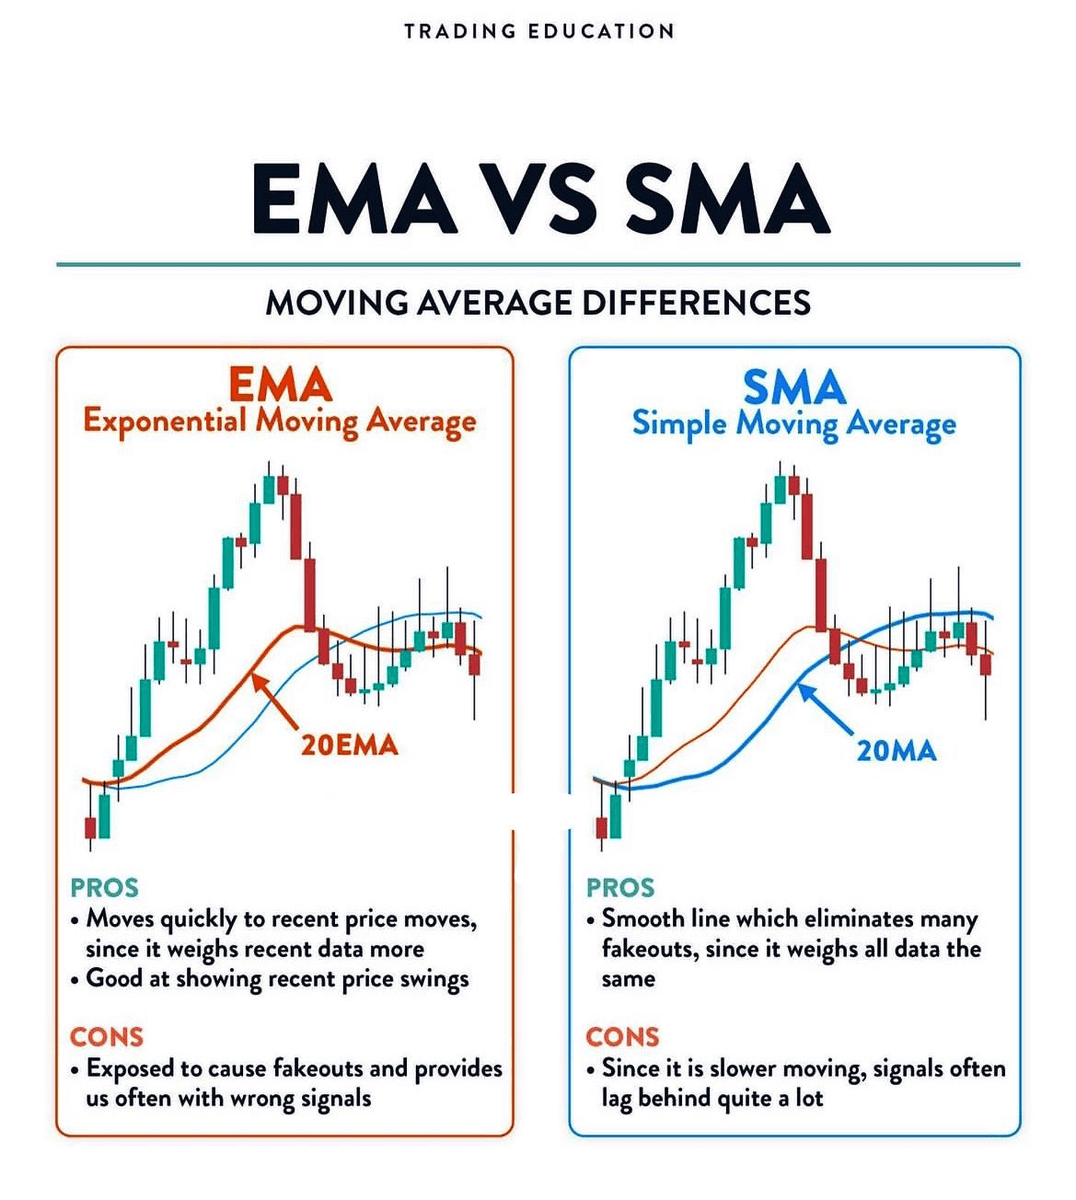
1. EMA: Sensitive to recent price movements. Ideal for short-term trading analysis.
2. SMA: Treats all data points equally, commonly used for long-term analysis.
11
3.1 Moving Average
An EMA crossover strategy involves monitoring two or more EMAs with different time frames to identify trading signals.
When a shorter-period EMA crosses above a longer-period EMA, it generates a BULLISH signal.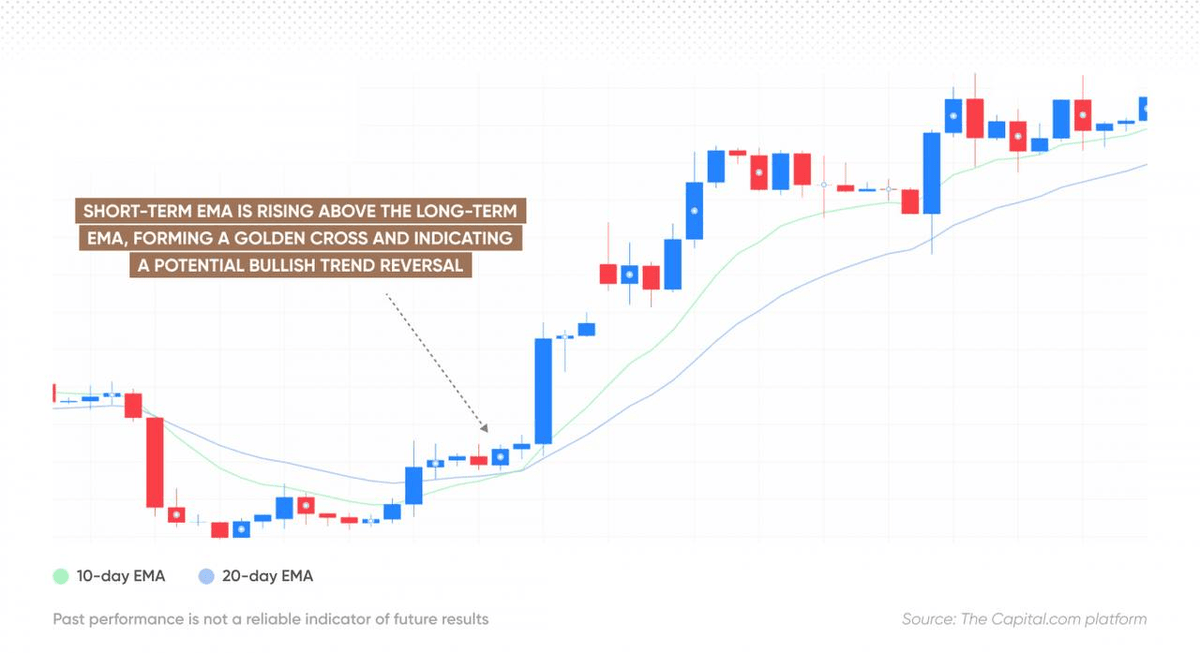
An EMA crossover strategy involves monitoring two or more EMAs with different time frames to identify trading signals.
When a shorter-period EMA crosses above a longer-period EMA, it generates a BULLISH signal.
12
3.2 Moving Average
To determine the trend, observe the direction of the EMA line and its position relatively to the price chart.
If the EMA is sloping upward and is below the price, it generally indicates a BULLISH momentum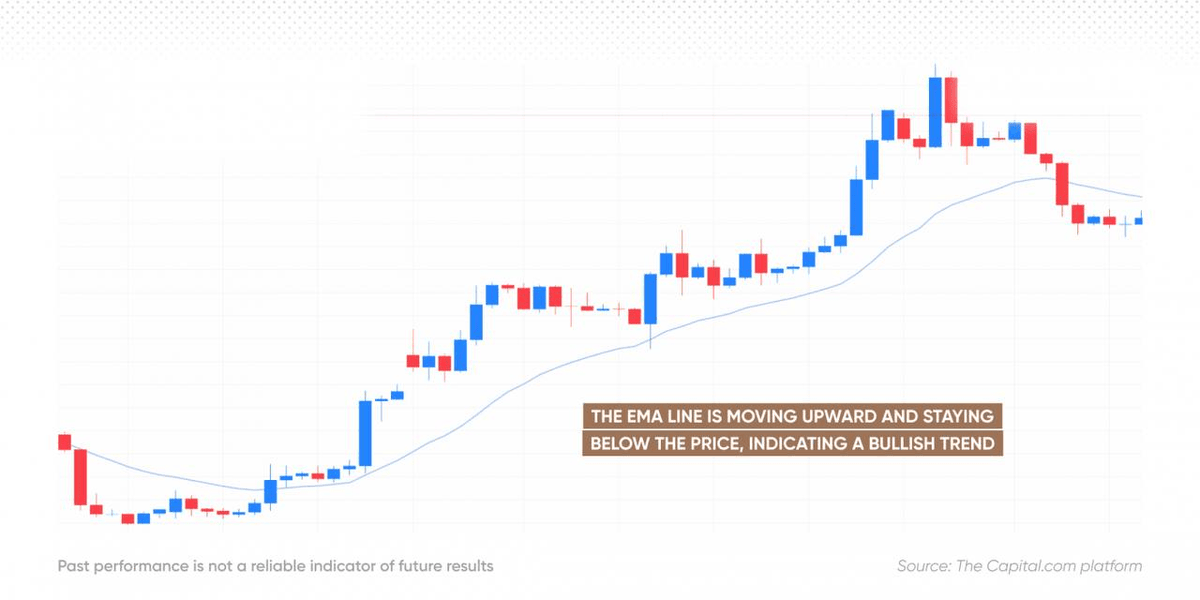
To determine the trend, observe the direction of the EMA line and its position relatively to the price chart.
If the EMA is sloping upward and is below the price, it generally indicates a BULLISH momentum