In this THREAD I will explain “Orderflow” 1. Footprint Charts 2....

CryptoSoulz@SoulzBTC
49 views
Aug 28, 2025
~3 min read
Advertisement
1
In this THREAD I will explain “Orderflow”
1. Footprint Charts
2. Market Profile
🧵(1/16)
1. Footprint Charts
2. Market Profile
🧵(1/16)
2
1. Footprint Charts
A footprint chart is an advanced candlestick chart that displays the volume of trades (or number of transactions)
At each specific price level within a given time period.
This charts provide a deeper view of market activity by showing bid and ask volume
A footprint chart is an advanced candlestick chart that displays the volume of trades (or number of transactions)
At each specific price level within a given time period.
This charts provide a deeper view of market activity by showing bid and ask volume
3
1.1 Footprint Charts
On the left side of the cluster chart are the sellers who were hitting the bid (sold)
The numbers on the right-hand side of the cluster chart show the buyers who lifted the order (bought)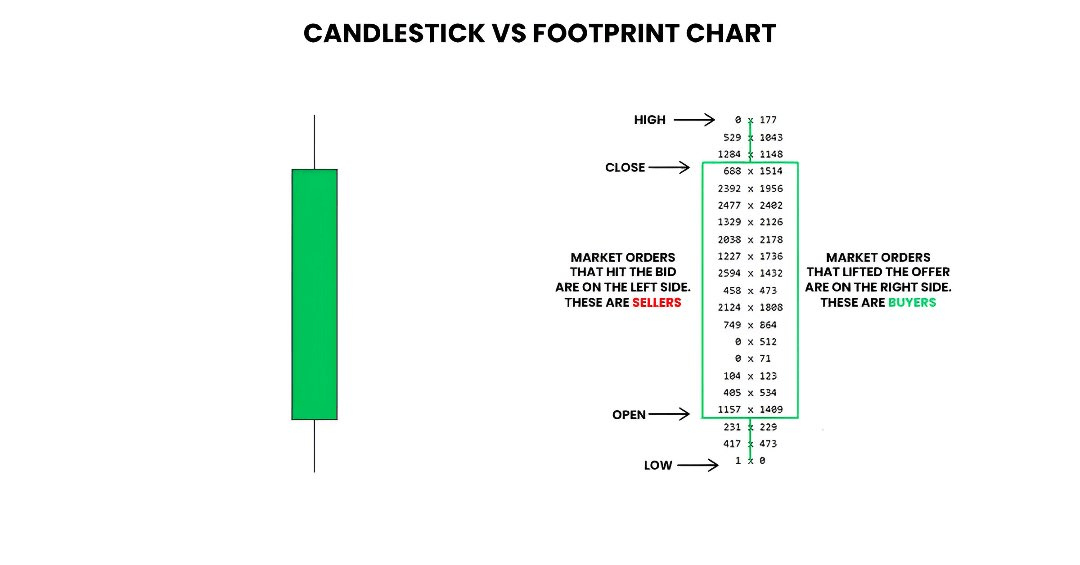
On the left side of the cluster chart are the sellers who were hitting the bid (sold)
The numbers on the right-hand side of the cluster chart show the buyers who lifted the order (bought)
4
1.2 Footprint Charts
This Footprint chart shows a clear Bearish Reversal:
Aggressive buyers (green imbalances) push price up, but fail to hold.
A strong sell imbalance (red) hits. Absorbing buyers (boxed area), leading to a shift in control and a sharp move down.
This Footprint chart shows a clear Bearish Reversal:
Aggressive buyers (green imbalances) push price up, but fail to hold.
A strong sell imbalance (red) hits. Absorbing buyers (boxed area), leading to a shift in control and a sharp move down.
5
1.3 Footprint Charts
Bullish Reversal:
This footprint chart shows strong seller aggression followed by exhaustion
Buyers step in with large imbalances (green), absorb the selling, and drive price up
The shift in delta and control marks a clear bullish reversal off the lows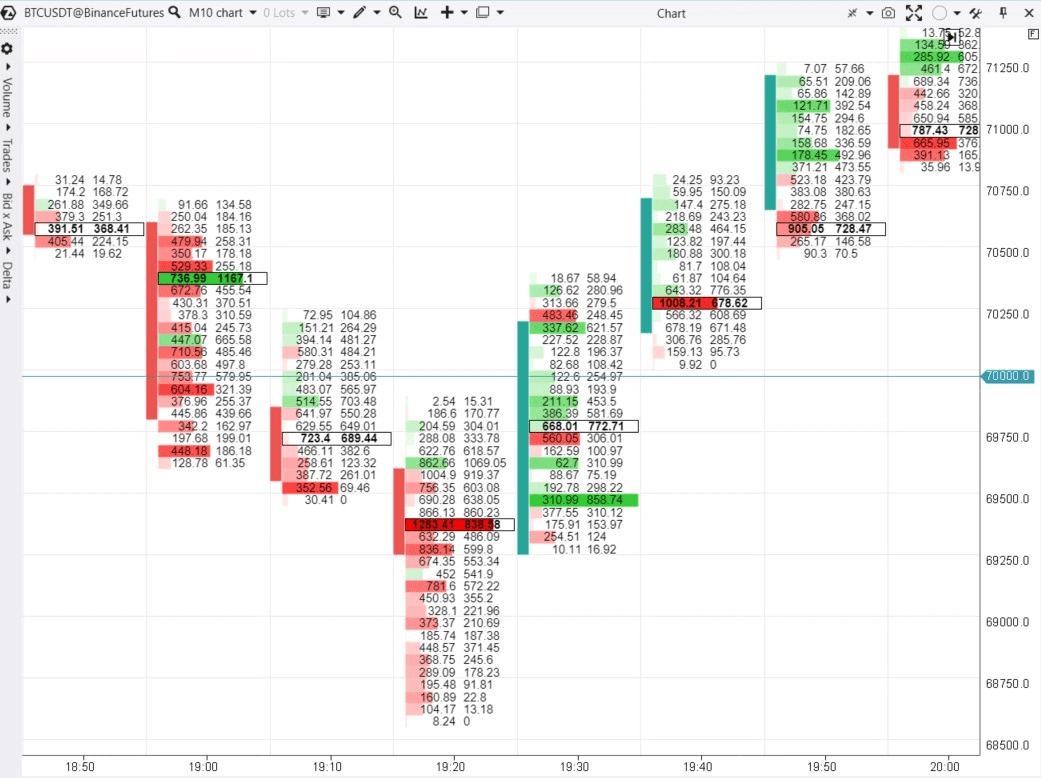
Bullish Reversal:
This footprint chart shows strong seller aggression followed by exhaustion
Buyers step in with large imbalances (green), absorb the selling, and drive price up
The shift in delta and control marks a clear bullish reversal off the lows
6
1.4 Footprint Charts
Bid/Ask Volume at Each Price Level:
Gradient colours show the relative intensity of the volume on each level.
Vertical lines are placed beside levels in the distributions to highlight major areas of imbalance.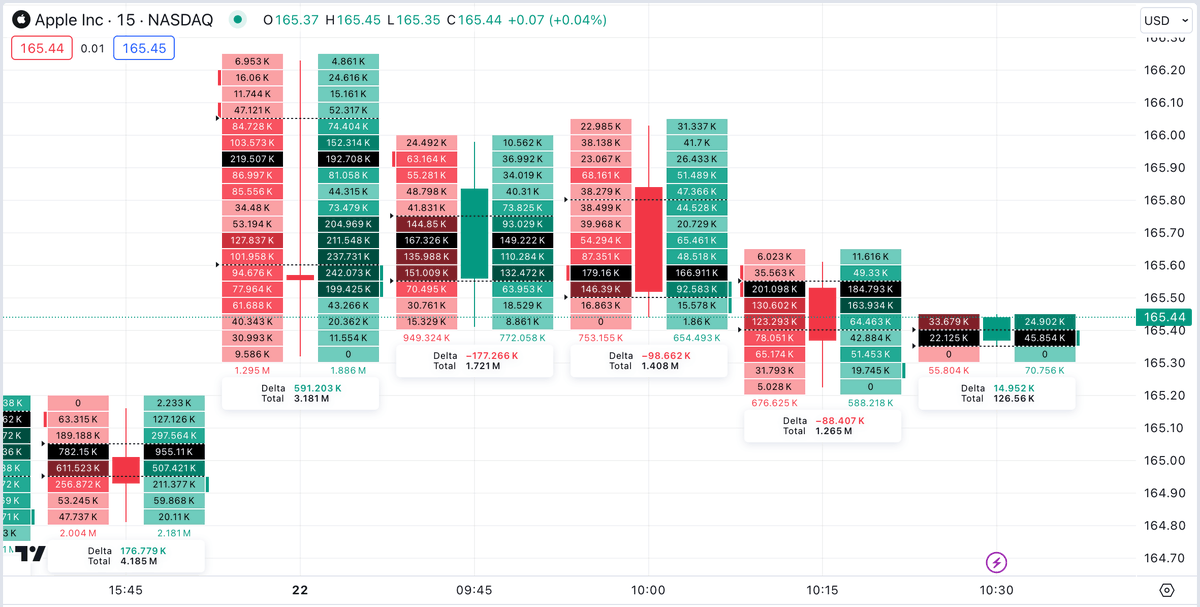
Bid/Ask Volume at Each Price Level:
Gradient colours show the relative intensity of the volume on each level.
Vertical lines are placed beside levels in the distributions to highlight major areas of imbalance.
7
1.5 Footprint Charts
Footprint displays the orderflow with numbers and colors making it easy to read in real time.
Footprints quickly identify:
- Trapped Buyers/Sellers
- Buy/Sell Imbalance
- Absorption Levels
- Exhaustion Points
Footprint displays the orderflow with numbers and colors making it easy to read in real time.
Footprints quickly identify:
- Trapped Buyers/Sellers
- Buy/Sell Imbalance
- Absorption Levels
- Exhaustion Points
8
1.6 Footprint Charts
Best Software for Footprint Analysis:
The top platforms are Kiyotaka, ExoCharts, ATAS, Sierra Charts and NinjaTrader.
TradingView offers footprint charts to Premium users.
Best Software for Footprint Analysis:
The top platforms are Kiyotaka, ExoCharts, ATAS, Sierra Charts and NinjaTrader.
TradingView offers footprint charts to Premium users.
9
2. Market Profile
The Market Profile is a visual representation.
Allows traders to visualize price trends and trading behavior in the form of vertical columns and horizontal bars.
These columns represent price ranges and show the interplay of supply and demand over time.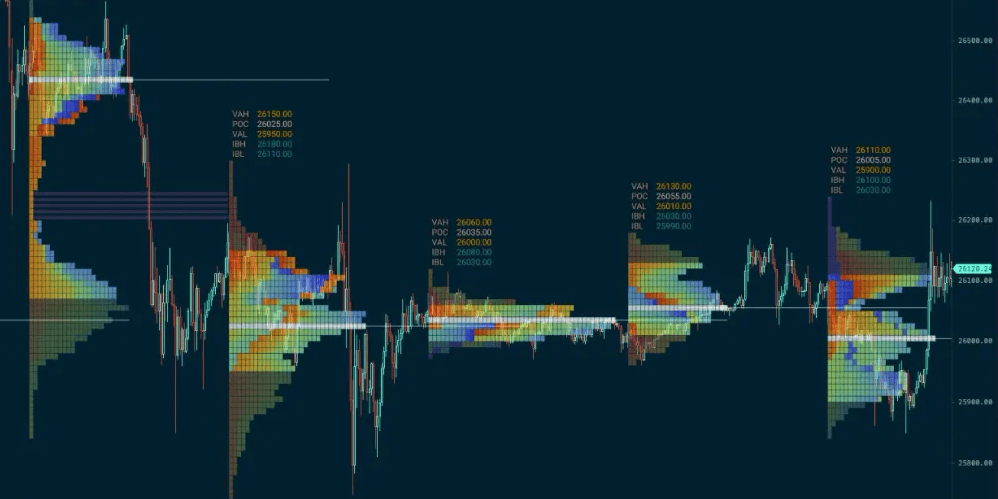
The Market Profile is a visual representation.
Allows traders to visualize price trends and trading behavior in the form of vertical columns and horizontal bars.
These columns represent price ranges and show the interplay of supply and demand over time.
10
2.1 Market Profile
The Market Profile is a multifaceted tool that divides the financial market into different elements.
These core elements provide a comprehensive analytical foundation to help traders make decisions.
The Market Profile is a multifaceted tool that divides the financial market into different elements.
These core elements provide a comprehensive analytical foundation to help traders make decisions.
11
2.2 Market Profile
The POC marks where price spent the most time (highest TPO count)
And the value area (red bracket) covers ~70% of activity
Clear buying/selling tails show rejection at extremes. Very useful for spotting reversals.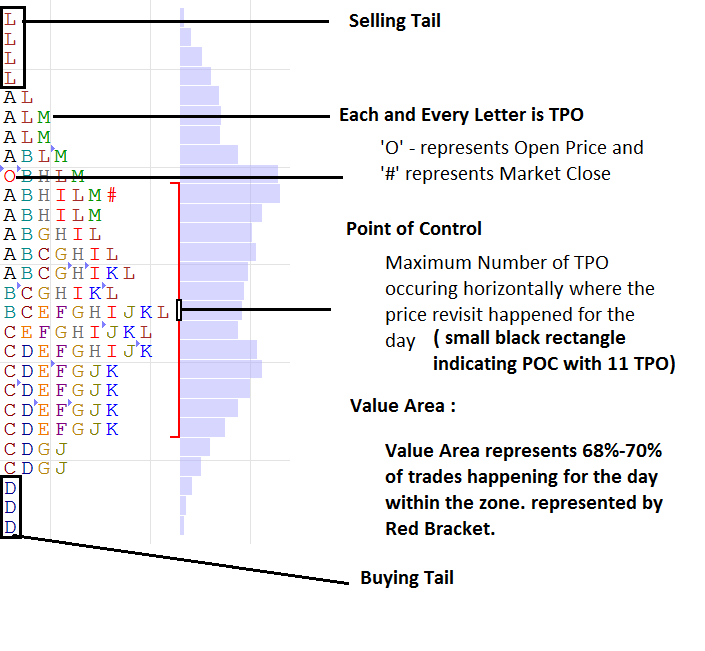
The POC marks where price spent the most time (highest TPO count)
And the value area (red bracket) covers ~70% of activity
Clear buying/selling tails show rejection at extremes. Very useful for spotting reversals.
12
2.3 Market Profile
Definition of abbreviations in Market Profile:
yVAH: Yesterday's Value Area High
yPOC: Yesterday's Point of Control
yVAL: Yesterday's Value Area Low
VAH: Today's Value Area High
POC: Point of Control
VAL: Today's Value Area Low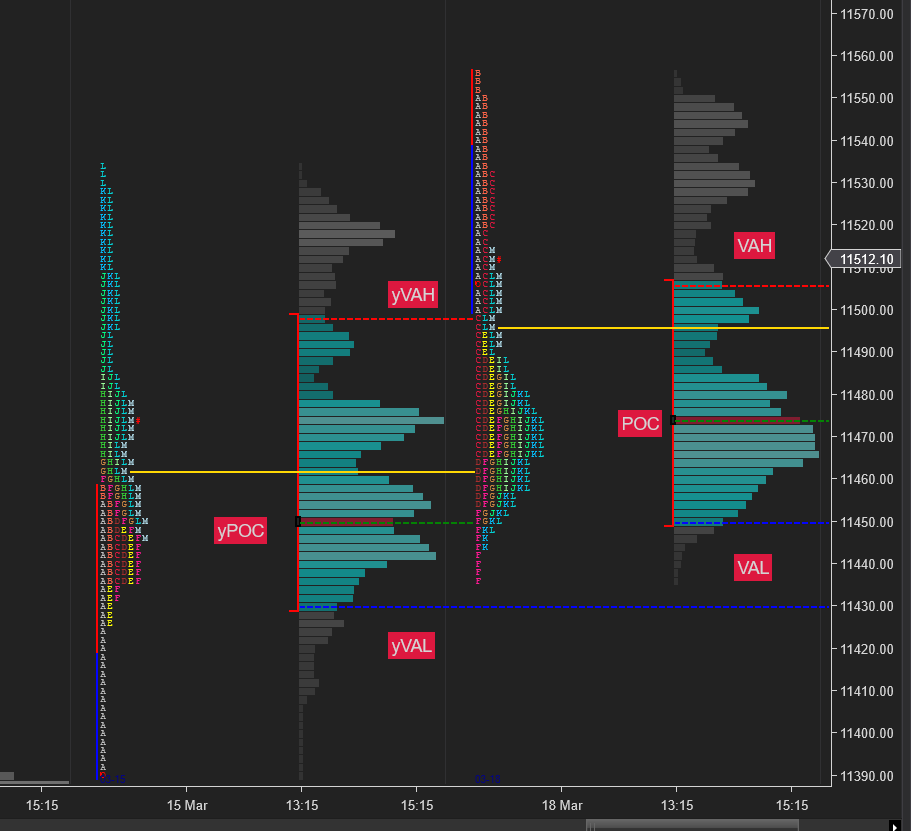
Definition of abbreviations in Market Profile:
yVAH: Yesterday's Value Area High
yPOC: Yesterday's Point of Control
yVAL: Yesterday's Value Area Low
VAH: Today's Value Area High
POC: Point of Control
VAL: Today's Value Area Low
13
2.4 Market Profile
This image shows buying/selling extremes in Market Profile.
A buying extreme forms when early TPOs print low and price never returns.
Selling extreme is the opposite. Single TPOs aren't extremes unless later TPOs don’t revisit the level.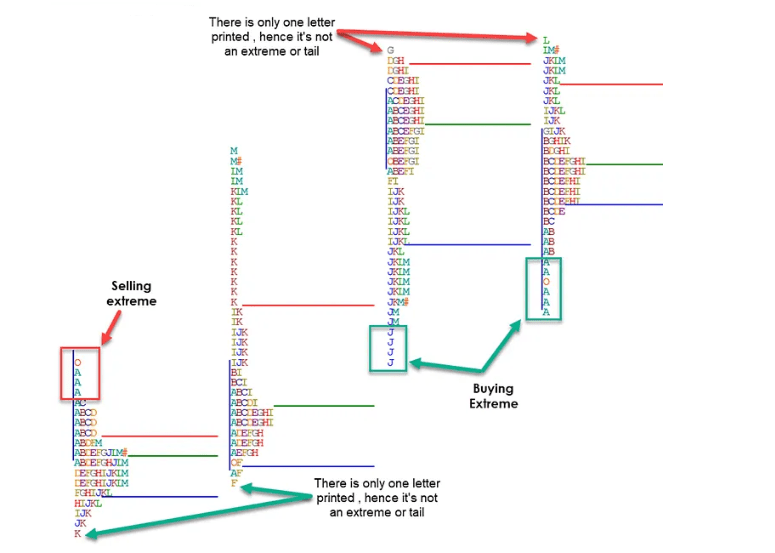
This image shows buying/selling extremes in Market Profile.
A buying extreme forms when early TPOs print low and price never returns.
Selling extreme is the opposite. Single TPOs aren't extremes unless later TPOs don’t revisit the level.
14
2.5 Market Profile
How to trade using Market Profile:
Price moved up from A and built balance at B (sideways zone)
At point 2, sellers rejected the highs and pushed price down.
Classic Market Profile play: Rejection at extremes, response at value edge.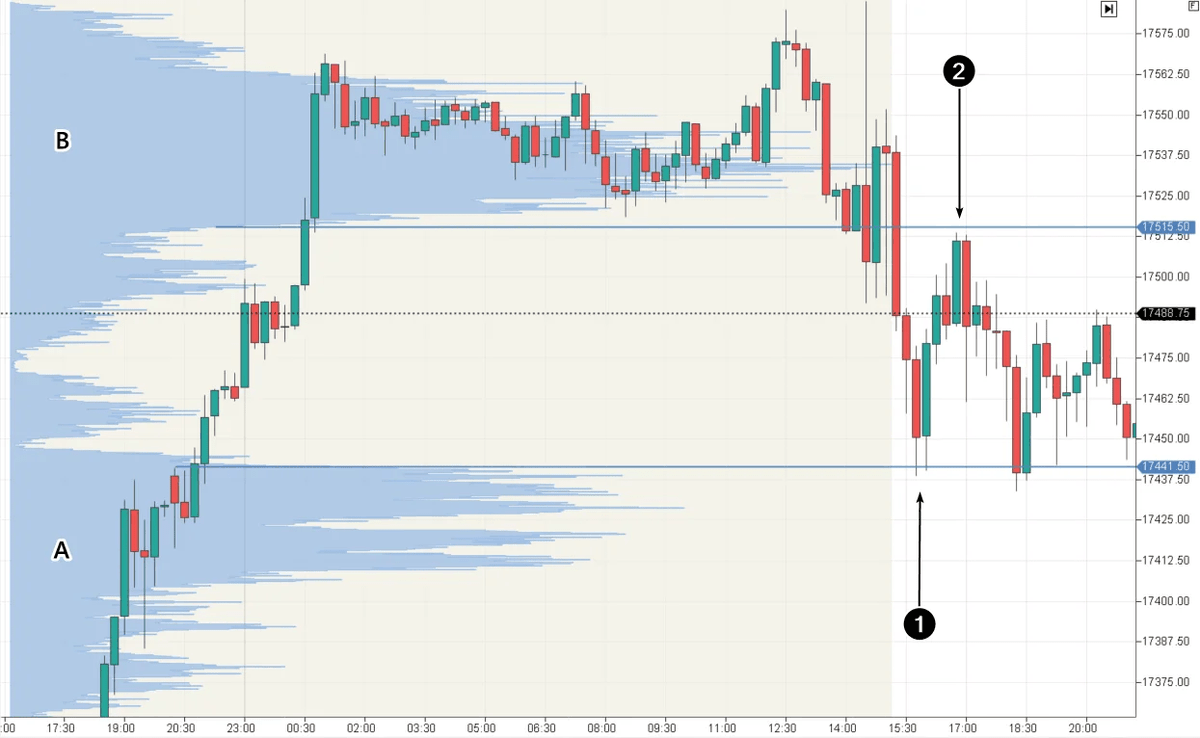
How to trade using Market Profile:
Price moved up from A and built balance at B (sideways zone)
At point 2, sellers rejected the highs and pushed price down.
Classic Market Profile play: Rejection at extremes, response at value edge.
15
2.6 Market Profile
How to trade using Market Profile:
Price dipped into a low volume node (black box), found strong buyers, and quickly reversed.
This shows rejection of lower prices at an area of prior low acceptance.
Classic Market Profile response off a low volume zone.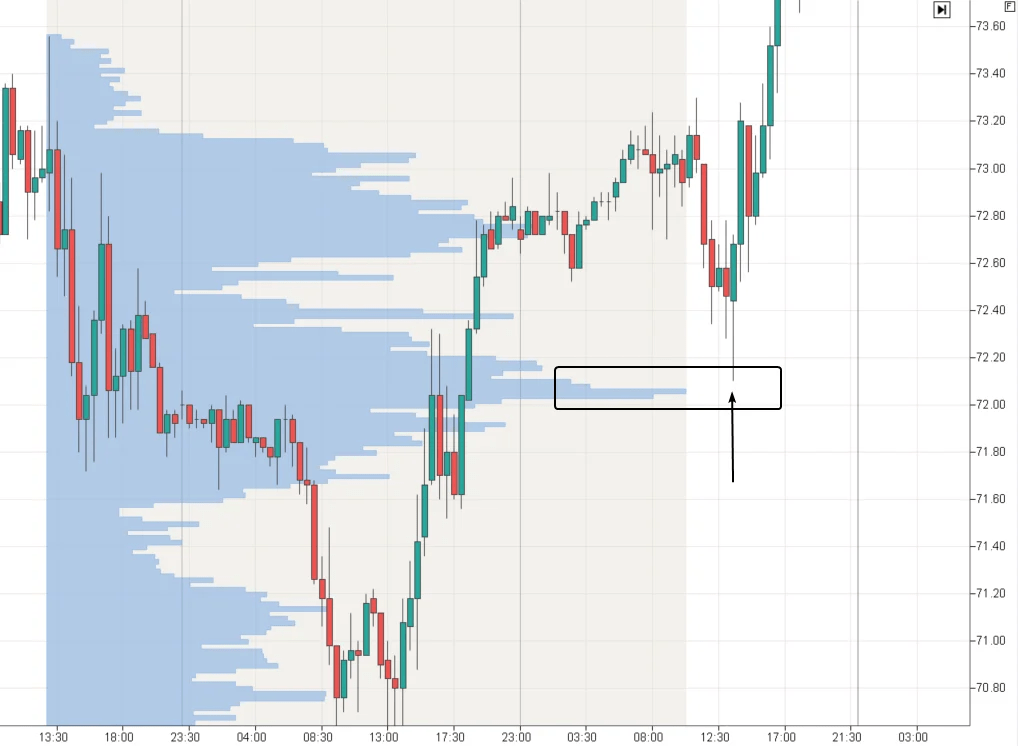
How to trade using Market Profile:
Price dipped into a low volume node (black box), found strong buyers, and quickly reversed.
This shows rejection of lower prices at an area of prior low acceptance.
Classic Market Profile response off a low volume zone.
16
I'm writing a complete FREE PDF on Footprint Charts and Market Profiles.
This Thread was a brief introduction to the PDF I'll be posting next week on Telegram.
If you learned with this THREAD:
LIKE, RT and COMMENT the first tweet of the THREAD to share it.
This Thread was a brief introduction to the PDF I'll be posting next week on Telegram.
If you learned with this THREAD:
LIKE, RT and COMMENT the first tweet of the THREAD to share it.