The amount of data produce in the CMJ is overwhelming. Where do you...

Eamonn Flanagan@EamonnFlanagan
1 views
Oct 03, 2026
~3 min read
Advertisement
1
The amount of data produce in the CMJ is overwhelming.
Where do you even start with your analysis?
Here is a 5-step approach to CMJ analysis
All outlined below 👇
Where do you even start with your analysis?
Here is a 5-step approach to CMJ analysis
All outlined below 👇
2
This outline approach is somwhat "idealised" but here are the key processes I tend to approach CMJ data with.
If you are interested in content like this on testing & assessment, you might be interested in my masterclass on Strength Diagnostics

If you are interested in content like this on testing & assessment, you might be interested in my masterclass on Strength Diagnostics
Eamonn Flanagan@EamonnFlanagan
❗️Masterclass❗️
Strength Diagnostics in Practice
A principles based workshop on strength classification, diagnostics & practical implementation
When: 8th November
Where: NGDC, Dublin
RT and reply "masterclass" below for discount code and more details
STRENGTHDIAGNOSTICS.eventbrite.ie
Strength Diagnostics in Practice
A principles based workshop on strength classification, diagnostics & practical implementation
When: 8th November
Where: NGDC, Dublin
RT and reply "masterclass" below for discount code and more details
STRENGTHDIAGNOSTICS.eventbrite.ie
3
Step 1: Data Quality Review. Do we have a valid test?
1️⃣ Is there "quiet standing" period?
2️⃣ Is there easy identifiable onset of movement?
3️⃣ Does force unload rapidly?
This subjective assessment also starts the process of understanding the athlete's performance approach 👇
1️⃣ Is there "quiet standing" period?
2️⃣ Is there easy identifiable onset of movement?
3️⃣ Does force unload rapidly?
This subjective assessment also starts the process of understanding the athlete's performance approach 👇
4
Step 2: Subjective Analysis
Key insights from the force time trace (that may inform your next steps):
1️⃣ Can the athlete rapidly unload force close to zero?
2️⃣ Is their profile unimodel or bimodal?
3️⃣ Are there possible assymetries in L v R
4️⃣ Is P2 > P1
5️⃣ Is EPV < -1.3 m/s?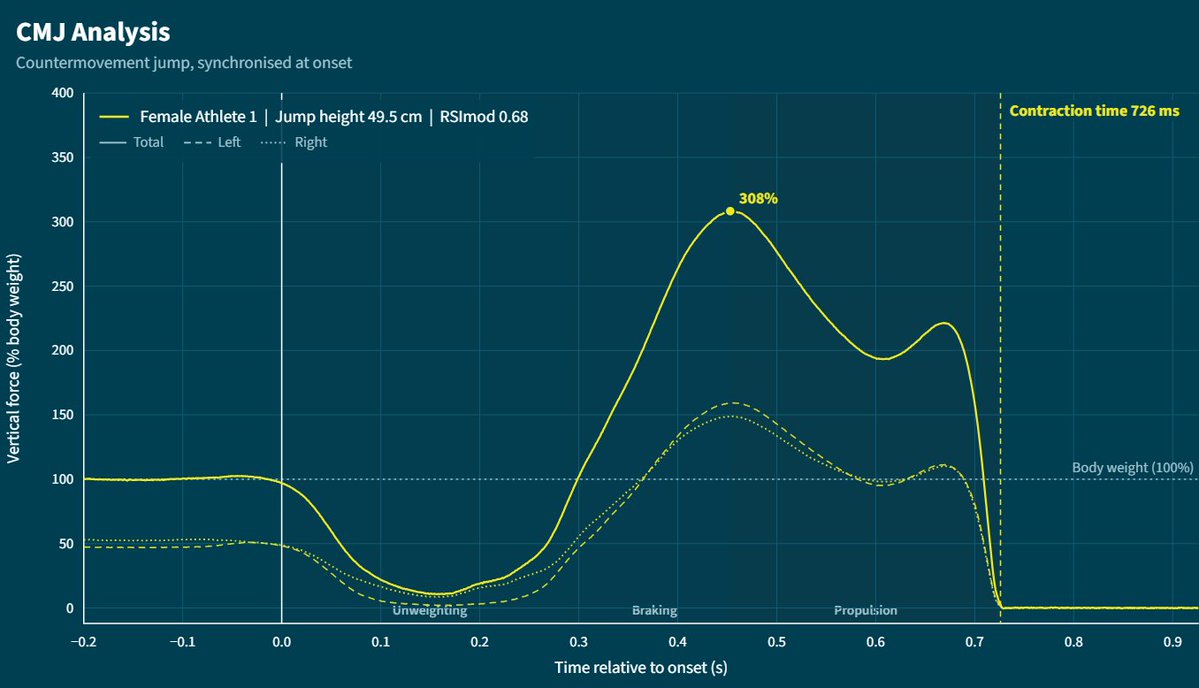
Key insights from the force time trace (that may inform your next steps):
1️⃣ Can the athlete rapidly unload force close to zero?
2️⃣ Is their profile unimodel or bimodal?
3️⃣ Are there possible assymetries in L v R
4️⃣ Is P2 > P1
5️⃣ Is EPV < -1.3 m/s?
5
All these aspects can help you build a subjective picture of how your athlete executes the test.
These give you initial impressions of the relative eccentric or concentric bias of the athlete and how effectively they generate force in the task.
Now we can get more objective
These give you initial impressions of the relative eccentric or concentric bias of the athlete and how effectively they generate force in the task.
Now we can get more objective
6
Step 3: What "type" of jumper is the athlete?
We can benchmark different aspects of performance against our normative data. This doesn't tell us if the athlete has executed a "good" test or not, its tells us what their unique "signature" for CMJ performance looks like.
We can benchmark different aspects of performance against our normative data. This doesn't tell us if the athlete has executed a "good" test or not, its tells us what their unique "signature" for CMJ performance looks like.
7
Z-scores are useful here to assess vs norm. data across diff metrics
I consider the following CMJ principal components:
1️⃣ Outcome (eg. height)
2️⃣ Force prod. (take-off impulse)
3️⃣ Eccentric strategy (impulse & RFD factors)
4️⃣ Temporal (eg. contract time)
5️⃣ Unloading (eg. EPV)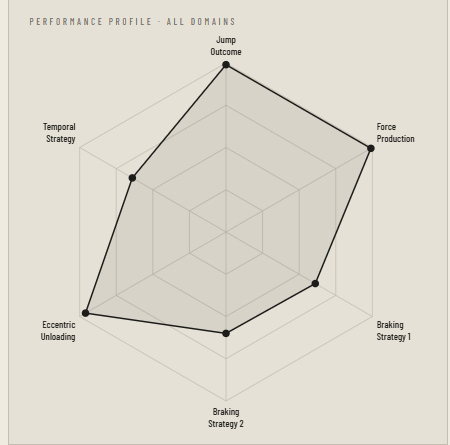
I consider the following CMJ principal components:
1️⃣ Outcome (eg. height)
2️⃣ Force prod. (take-off impulse)
3️⃣ Eccentric strategy (impulse & RFD factors)
4️⃣ Temporal (eg. contract time)
5️⃣ Unloading (eg. EPV)
8
Principal component analyses show that there is ALOT of redundancy in the myriad of force plate metrics available.
The main aspects of performance are captured in these 5 metric groups.
Select your own preferred metric in each of the groups. Don't stress too much beyond that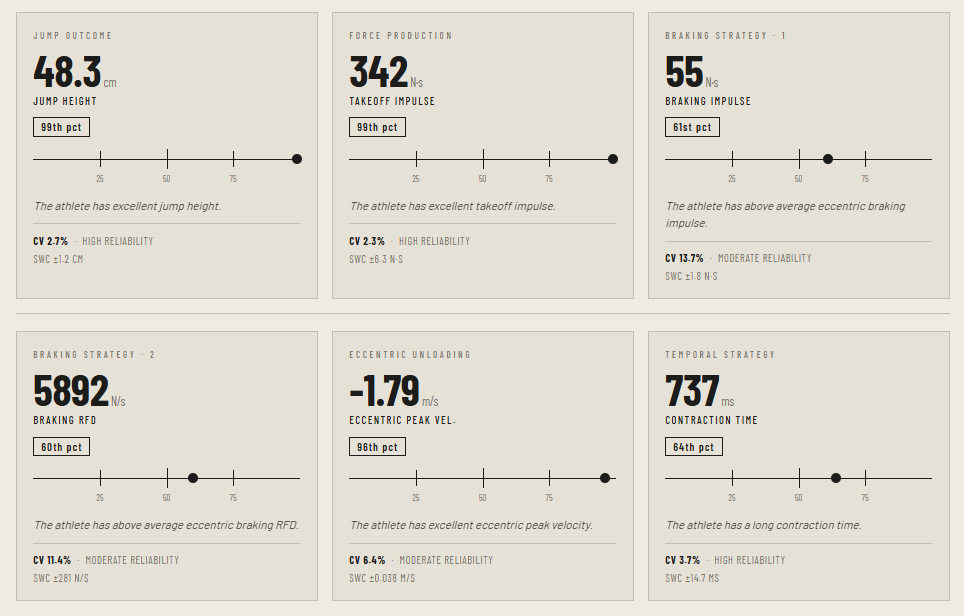
The main aspects of performance are captured in these 5 metric groups.
Select your own preferred metric in each of the groups. Don't stress too much beyond that
9
Step 4: Review the athlete's data over time.
Are they improving? What underlying aspects of performance are driving changes?
Again, our principal components are key
Outcome ➡️ Timings/Temporal ➡️Unloading ➡️ Force (propulsive and eccentric)
Are they improving? What underlying aspects of performance are driving changes?
Again, our principal components are key
Outcome ➡️ Timings/Temporal ➡️Unloading ➡️ Force (propulsive and eccentric)
10
Additionally to this, symmetry btw legs can be assessed - if relevant
Some key considerations re: symmetry analysis:
In some metrics, normal asymm ranges are quite large.
Don't over react. Symmetry is metric specific.
Look at athlete's symmetry over time. What is their normal?
Some key considerations re: symmetry analysis:
In some metrics, normal asymm ranges are quite large.
Don't over react. Symmetry is metric specific.
Look at athlete's symmetry over time. What is their normal?
11
Is there an established individual symmetry range (in periods of non-injury or high performance?
Is there an established trend of L v R?
Are they inside or outside that range by a meaningful amount?
Only then would I be considering this a live issue
Is there an established trend of L v R?
Are they inside or outside that range by a meaningful amount?
Only then would I be considering this a live issue
12
So that is the process:
1️⃣ Data quality review
2️⃣ Subjective analysis (force-time curve)
3️⃣ Identify "strategy"
4️⃣ Track over time (5 domains)
5️⃣ Assess symmetry (metric specific)
1️⃣ Data quality review
2️⃣ Subjective analysis (force-time curve)
3️⃣ Identify "strategy"
4️⃣ Track over time (5 domains)
5️⃣ Assess symmetry (metric specific)
