YouTube f*cked up big time: A/B test feature is completely broken....

wono@wono_strategy
10 views
Mar 01, 2025
~9 min read
Advertisement
1
YouTube f*cked up big time: A/B test feature is completely broken.
(mega thread)
(mega thread)
2
Let’s play a game:
1) Check the picture below
2) Read the title
3) Pick the thumbnail you think fits it best.
1) Check the picture below
2) Read the title
3) Pick the thumbnail you think fits it best.
3
The only thumbnail that truly shows what the video is about is C, and I bet that's what most of you chose.
Well, that’s not what the YouTube A/B feature found (or Test & Compare as they call it).
Well, that’s not what the YouTube A/B feature found (or Test & Compare as they call it).
4
@enesyilmazer This video ended up ranking 8th out of 10 on the channel, despite using the A/B feature right from the start and with no further changes to its packaging.
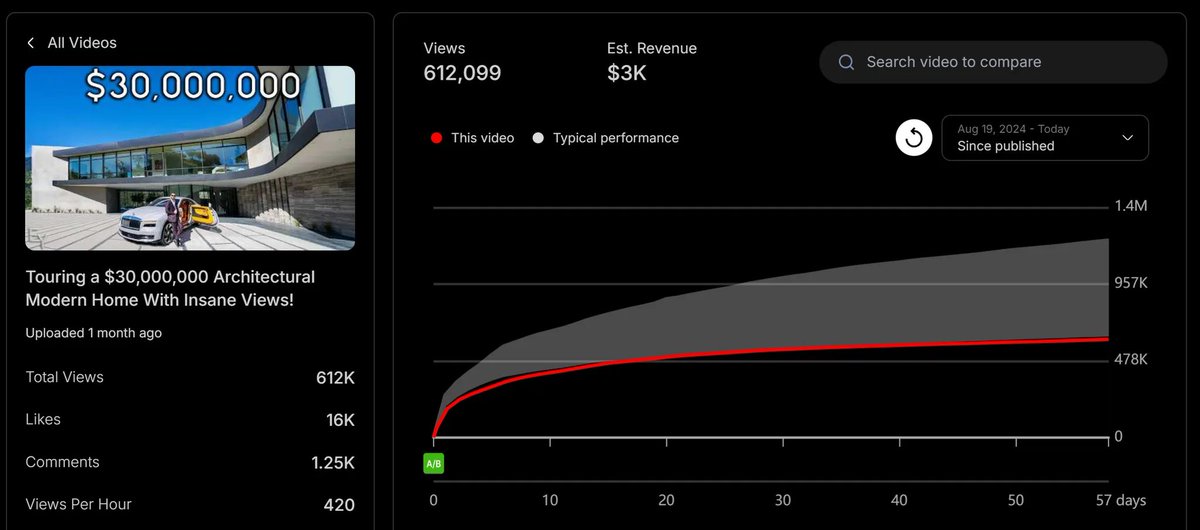
5
I also ran the same test with my own A/B simulation tool, the Viral Economy, which is built to reach new viewers.
Here’s what it found: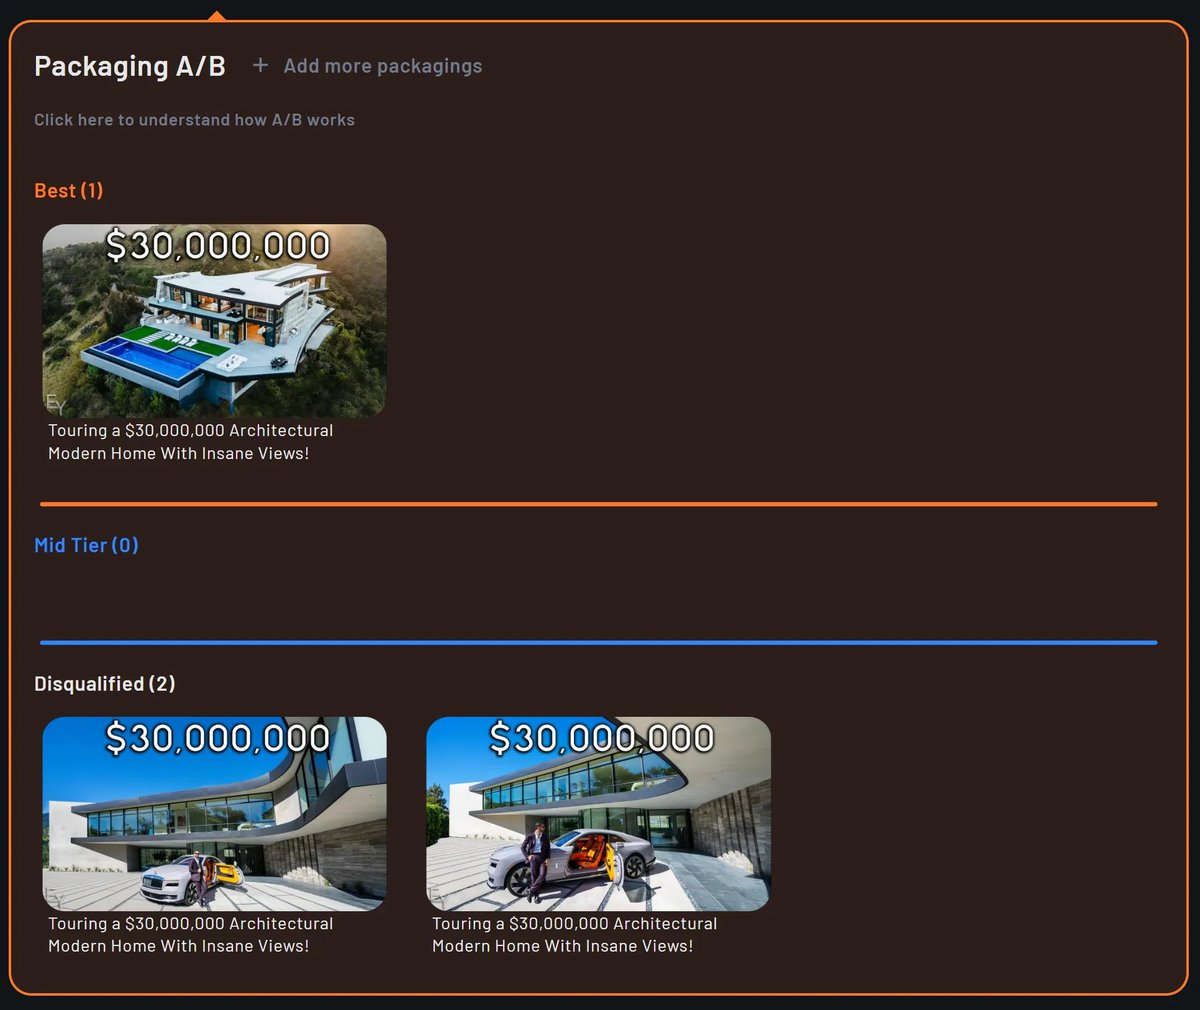
Here’s what it found:
6
So, why didn’t YouTube catch this obvious result?
How did the only thumbnail that matched the title lose out to ones where the house is barely visible?
I’ll explain why in a moment (spoiler: it’s not just a CTR or watch time issue, it’s on a fundamental level).
How did the only thumbnail that matched the title lose out to ones where the house is barely visible?
I’ll explain why in a moment (spoiler: it’s not just a CTR or watch time issue, it’s on a fundamental level).
7
The example above is far from being an exception, it’s actually the rule with YouTube A/B test.
We checked about 70 different videos from completely different niches, and according to the Viral Economy, YouTube was wrong about 80% of the time.
We checked about 70 different videos from completely different niches, and according to the Viral Economy, YouTube was wrong about 80% of the time.
8
So who’s right? A billion-dollar company or a tool built by an anonymous individual on Twitter with a cringe Prison Break avatar? 😀
Joke aside, this is a serious issue.
With the A/B feature everyone is losing, YouTube included.
Joke aside, this is a serious issue.
With the A/B feature everyone is losing, YouTube included.
9
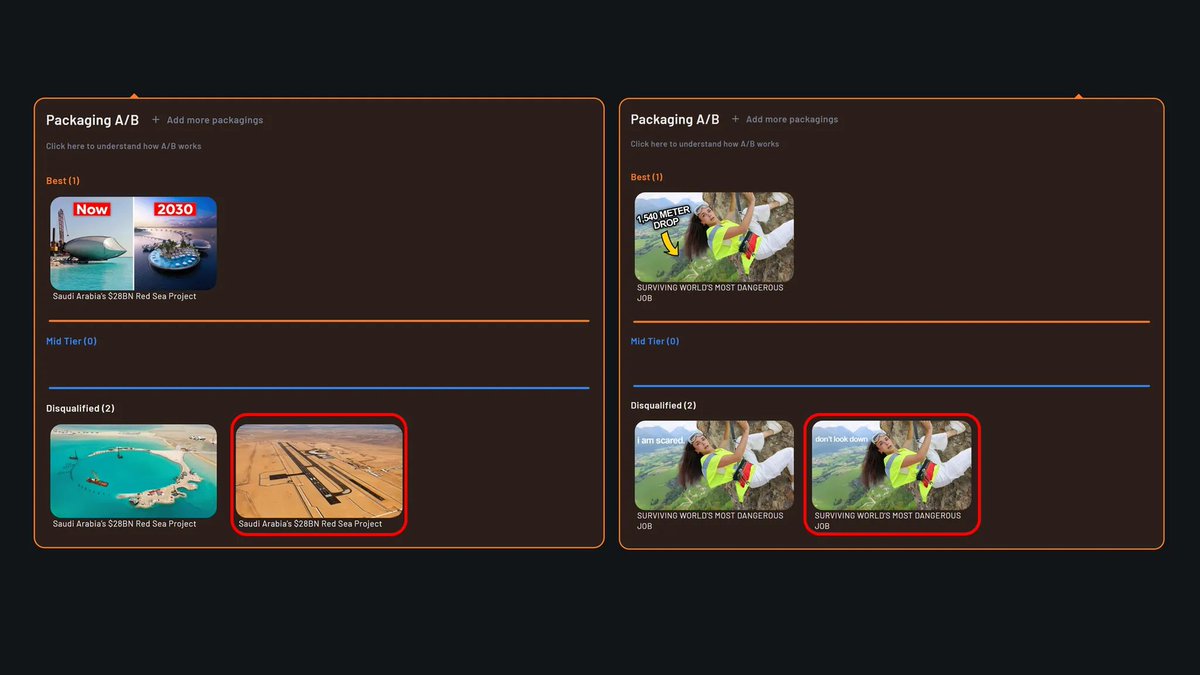
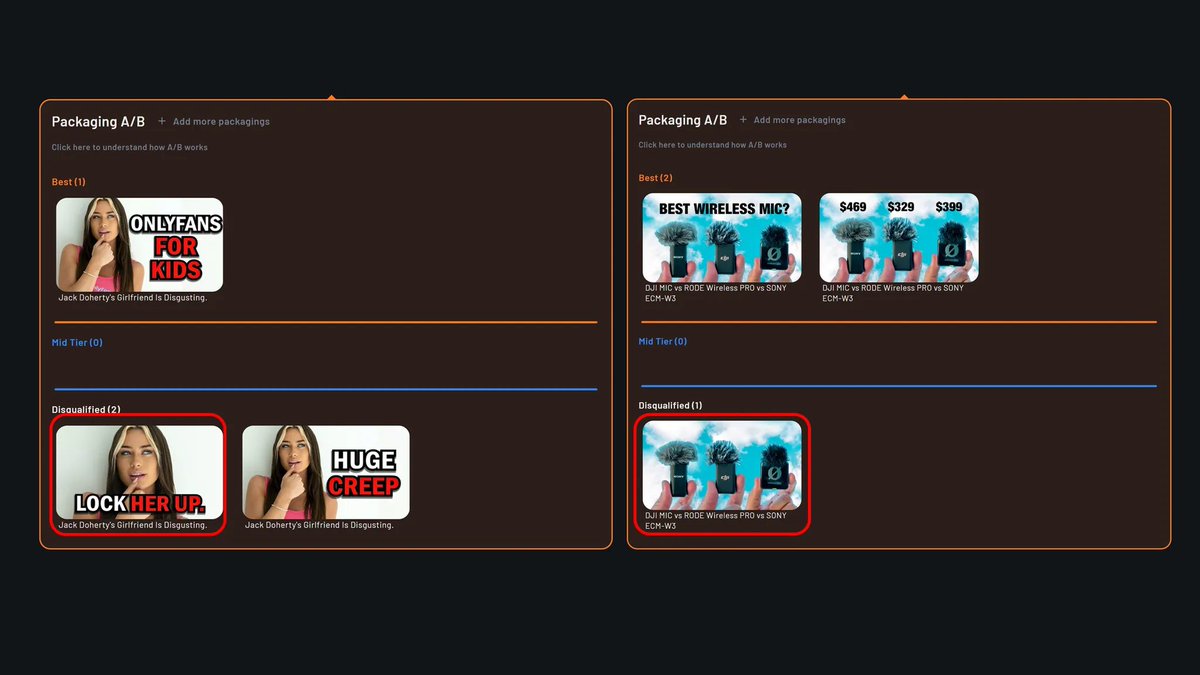
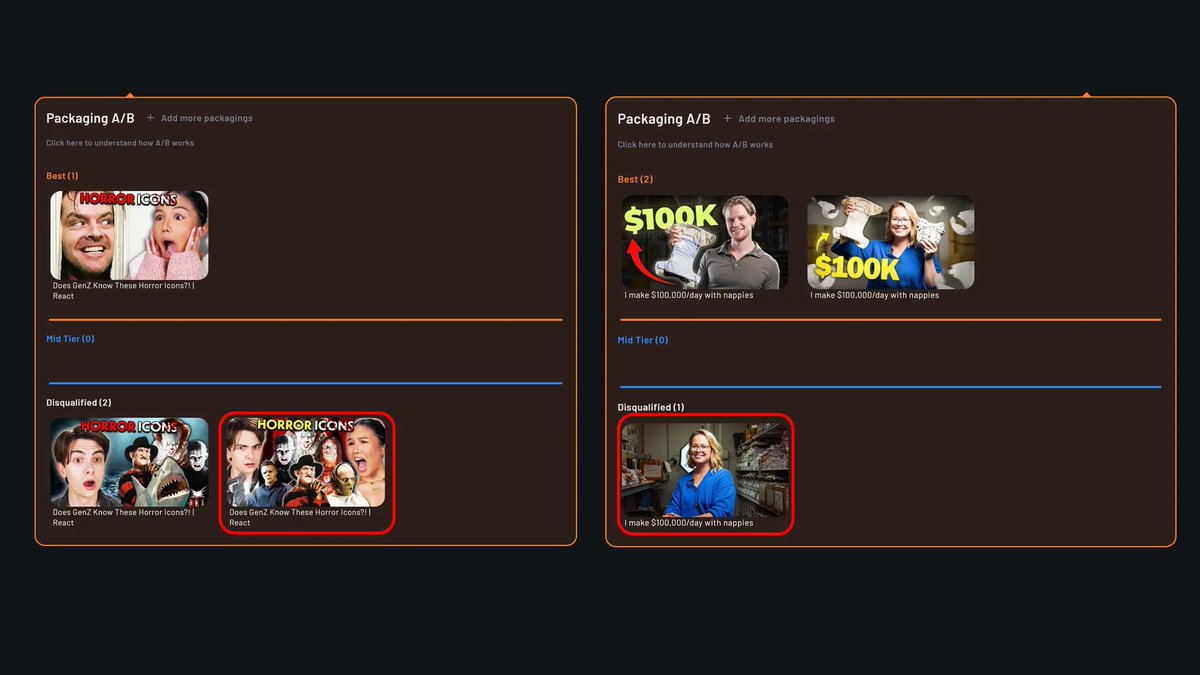
Here are a few more examples from our data that speak for themselves, I let you judge for yourself.
𝘕𝘰𝘵𝘦: 𝘛𝘩𝘦 𝘱𝘢𝘤𝘬𝘢𝘨𝘪𝘯𝘨 𝘩𝘪𝘨𝘩𝘭𝘪𝘨𝘩𝘵𝘦𝘥 𝘪𝘯 𝘳𝘦𝘥 𝘪𝘴 𝘸𝘩𝘢𝘵 𝘳𝘦𝘮𝘢𝘪𝘯𝘦𝘥 𝘰𝘯 𝘠𝘰𝘶𝘛𝘶𝘣𝘦 𝘢𝘧𝘵𝘦𝘳 𝘵𝘩𝘦 𝘈/𝘉 𝘵𝘦𝘴𝘵. 𝘐 𝘥𝘰𝘯’𝘵 𝘬𝘯𝘰𝘸 𝘪𝘧 𝘪𝘵 𝘸𝘢𝘴 𝘤𝘩𝘰𝘴𝘦𝘯 𝘢𝘴 𝘵𝘩𝘦 𝘸𝘪𝘯𝘯𝘦𝘳 𝘰𝘳 𝘪𝘧 𝘠𝘰𝘶𝘛𝘶𝘣𝘦 𝘤𝘰𝘶𝘭𝘥𝘯’𝘵 𝘥𝘦𝘤𝘪𝘥𝘦 𝘣𝘶𝘵 𝘦𝘪𝘵𝘩𝘦𝘳 𝘸𝘢𝘺, 𝘪𝘵’𝘴 𝘢𝘯 𝘪𝘴𝘴𝘶𝘦 𝘨𝘪𝘷𝘦𝘯 𝘩𝘰𝘸 𝘰𝘣𝘷𝘪𝘰𝘶𝘴 𝘵𝘩𝘦 𝘣𝘦𝘴𝘵 𝘰𝘱𝘵𝘪𝘰𝘯 𝘪𝘴 𝘧𝘰𝘳 𝘮𝘢𝘯𝘺 𝘰𝘧 𝘵𝘩𝘦𝘮.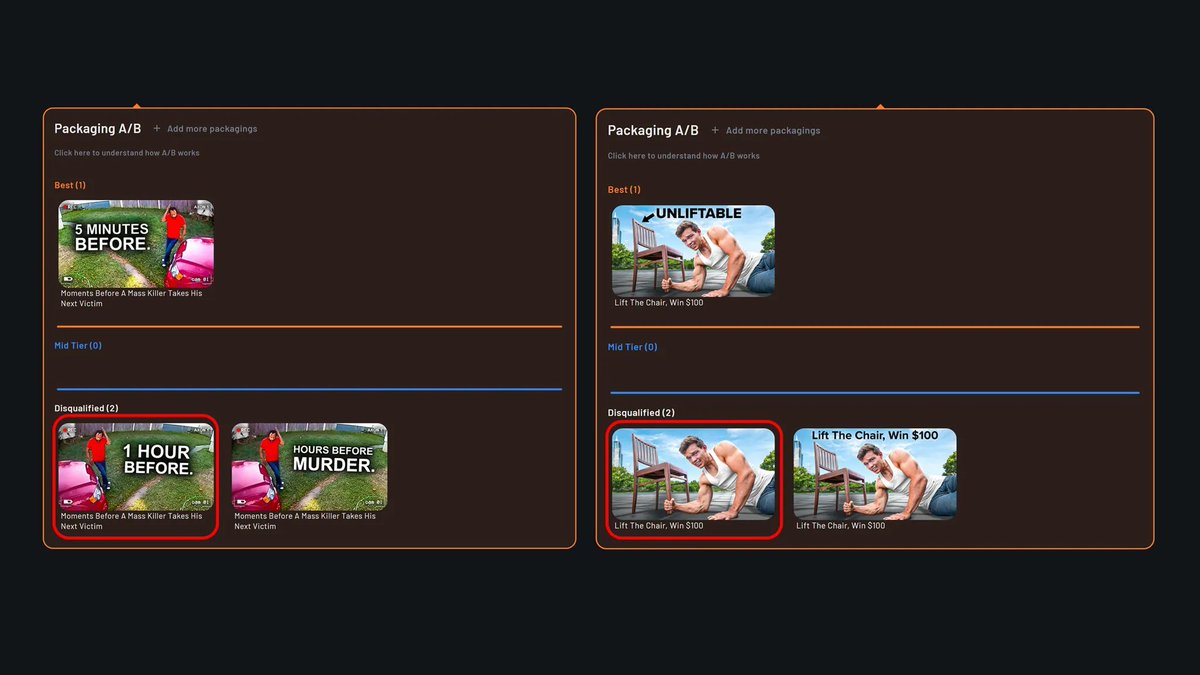
𝘕𝘰𝘵𝘦: 𝘛𝘩𝘦 𝘱𝘢𝘤𝘬𝘢𝘨𝘪𝘯𝘨 𝘩𝘪𝘨𝘩𝘭𝘪𝘨𝘩𝘵𝘦𝘥 𝘪𝘯 𝘳𝘦𝘥 𝘪𝘴 𝘸𝘩𝘢𝘵 𝘳𝘦𝘮𝘢𝘪𝘯𝘦𝘥 𝘰𝘯 𝘠𝘰𝘶𝘛𝘶𝘣𝘦 𝘢𝘧𝘵𝘦𝘳 𝘵𝘩𝘦 𝘈/𝘉 𝘵𝘦𝘴𝘵. 𝘐 𝘥𝘰𝘯’𝘵 𝘬𝘯𝘰𝘸 𝘪𝘧 𝘪𝘵 𝘸𝘢𝘴 𝘤𝘩𝘰𝘴𝘦𝘯 𝘢𝘴 𝘵𝘩𝘦 𝘸𝘪𝘯𝘯𝘦𝘳 𝘰𝘳 𝘪𝘧 𝘠𝘰𝘶𝘛𝘶𝘣𝘦 𝘤𝘰𝘶𝘭𝘥𝘯’𝘵 𝘥𝘦𝘤𝘪𝘥𝘦 𝘣𝘶𝘵 𝘦𝘪𝘵𝘩𝘦𝘳 𝘸𝘢𝘺, 𝘪𝘵’𝘴 𝘢𝘯 𝘪𝘴𝘴𝘶𝘦 𝘨𝘪𝘷𝘦𝘯 𝘩𝘰𝘸 𝘰𝘣𝘷𝘪𝘰𝘶𝘴 𝘵𝘩𝘦 𝘣𝘦𝘴𝘵 𝘰𝘱𝘵𝘪𝘰𝘯 𝘪𝘴 𝘧𝘰𝘳 𝘮𝘢𝘯𝘺 𝘰𝘧 𝘵𝘩𝘦𝘮.
10
11
12
13
And the list goes on and on.
Let’s dive deeper into what causes this issue now.
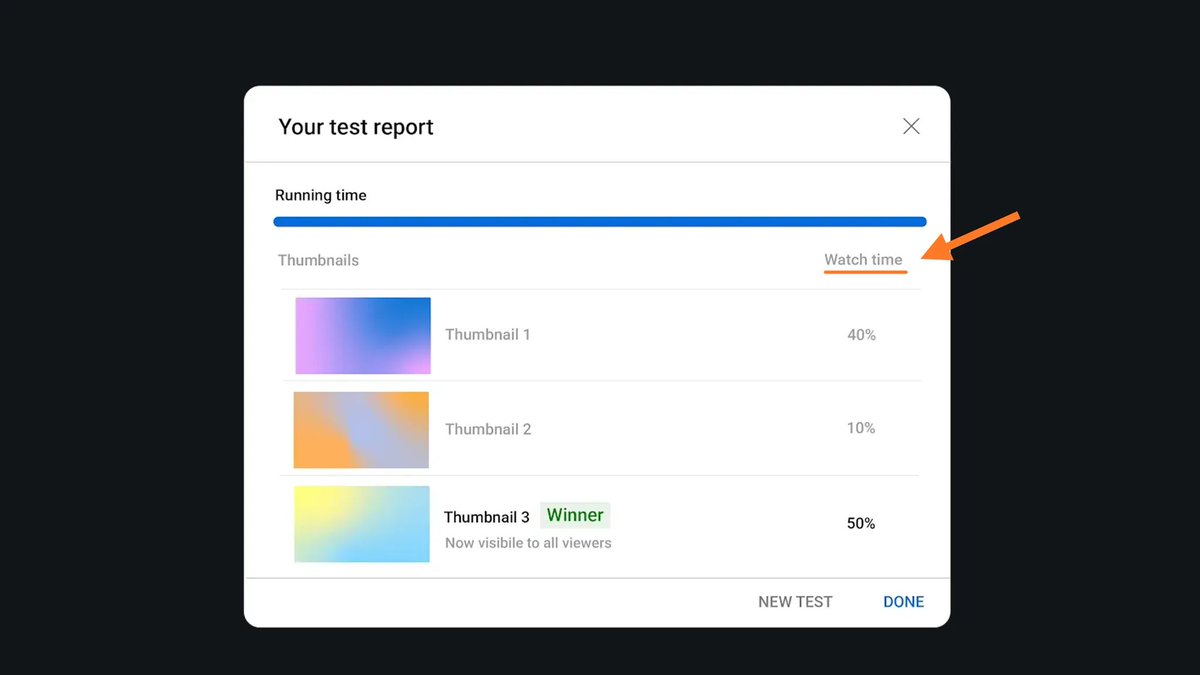
According to YouTube, the tool is built to “get you the highest amount of viewer engagement”, which they translates into watch time.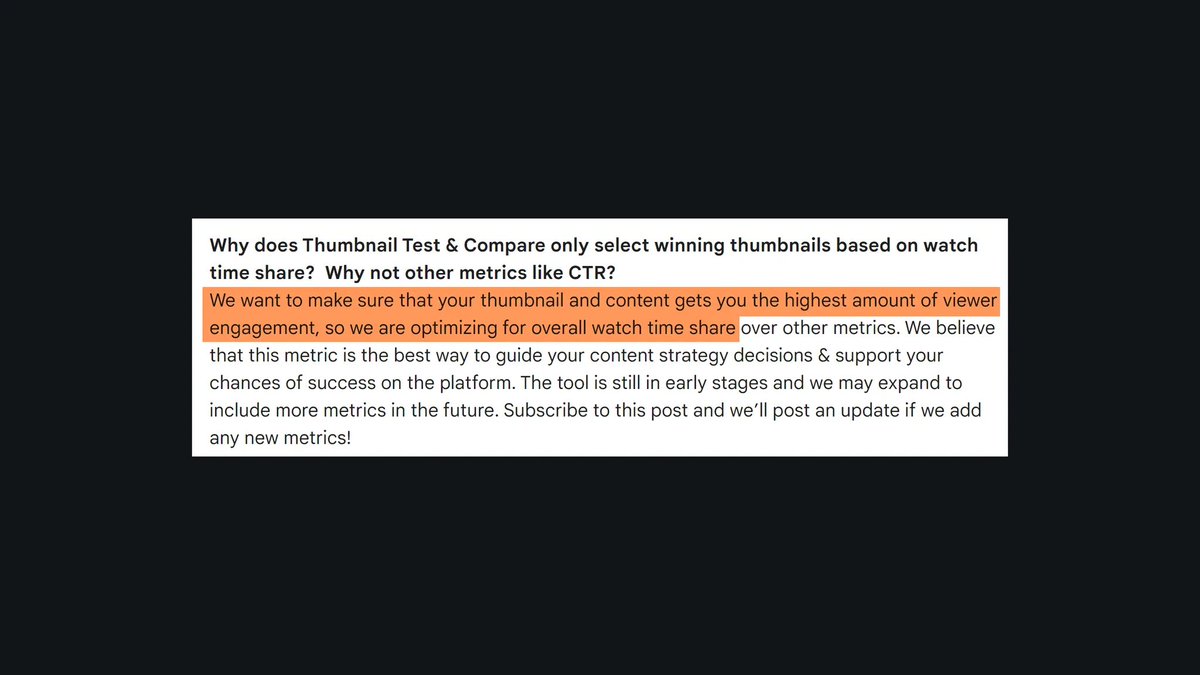
Let’s dive deeper into what causes this issue now.
According to YouTube, the tool is built to “get you the highest amount of viewer engagement”, which they translates into watch time.
14
As it involves a lot of complexity, I’ll try to simplify so this thread can be enlightening and actionable to you.
For those who follow me, you might remember my feedback thread for YouTube about CTR & AVD.
The A/B feature has a similar problem except it’s even worse because this time, it involves the algorithm.

For those who follow me, you might remember my feedback thread for YouTube about CTR & AVD.
The A/B feature has a similar problem except it’s even worse because this time, it involves the algorithm.
wono@wono_strategy
I've been contacted by people working at YouTube for feedback on the analytics. (cc @hitsman & @BaerJustus)
So here is how some metrics in the analytics push creators to make huge mistakes:
So here is how some metrics in the analytics push creators to make huge mistakes:
15
As we’ve seen, this is how the current A/B feature on YouTube works:

16
Although using watch time as a metric is the right decision, the way YouTube built it is fucked up.
And bad news for YouTube: this problem can’t be solved, the feature has to be completely rebuilt from scratch.
Let’s see why:
And bad news for YouTube: this problem can’t be solved, the feature has to be completely rebuilt from scratch.
Let’s see why:
17
𝟏) 𝐓𝐇𝐄 𝐍𝐄𝐂𝐄𝐒𝐒𝐀𝐑𝐘 𝐁𝐀𝐒𝐈𝐂𝐒
Unlike what most people think, it’s not:
- The algorithm looks for viewers for videos
it’s the opposite:
- The algorithm looks for videos for viewers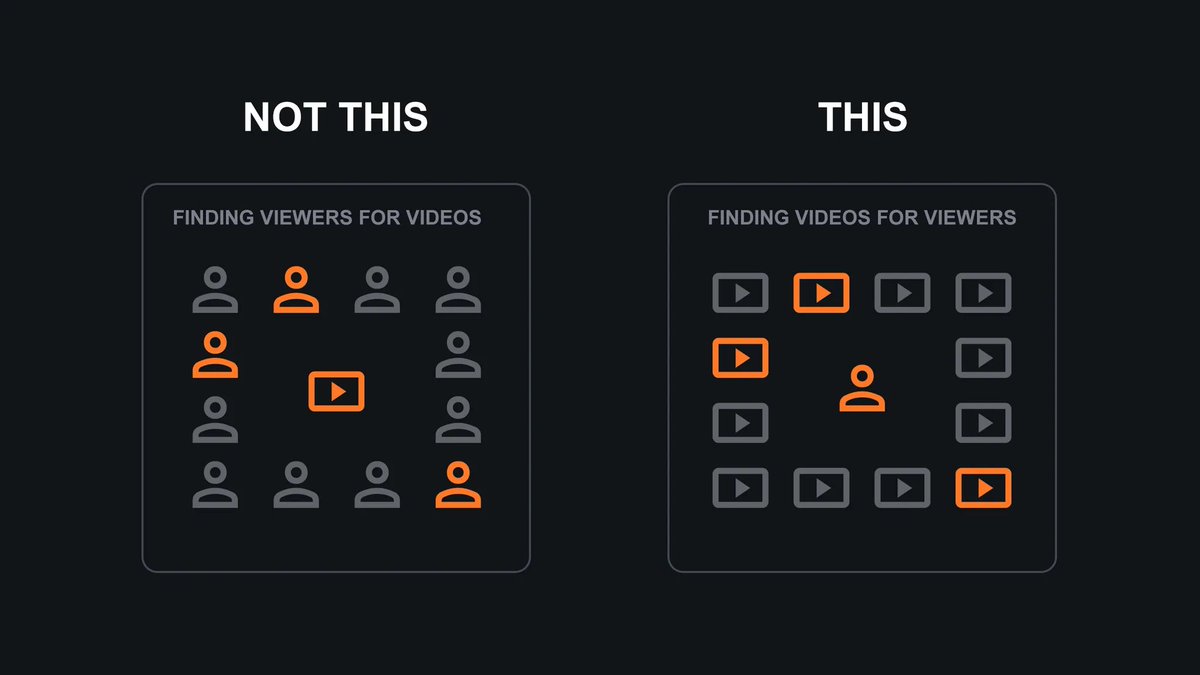
Unlike what most people think, it’s not:
- The algorithm looks for viewers for videos
it’s the opposite:
- The algorithm looks for videos for viewers
18
I won’t explore this further because it’s very complex, and that’s not the point of this thread.
But it’s an important element to understand why the A/B test feature is broken.
But it’s an important element to understand why the A/B test feature is broken.
19
Talking about videos, every piece of content falls somewhere within the following spectrum:
- Niche: Requires prior context to spark interest
- Reach: No prior context is required to spark interest
Most of the time, it’s somewhere in between.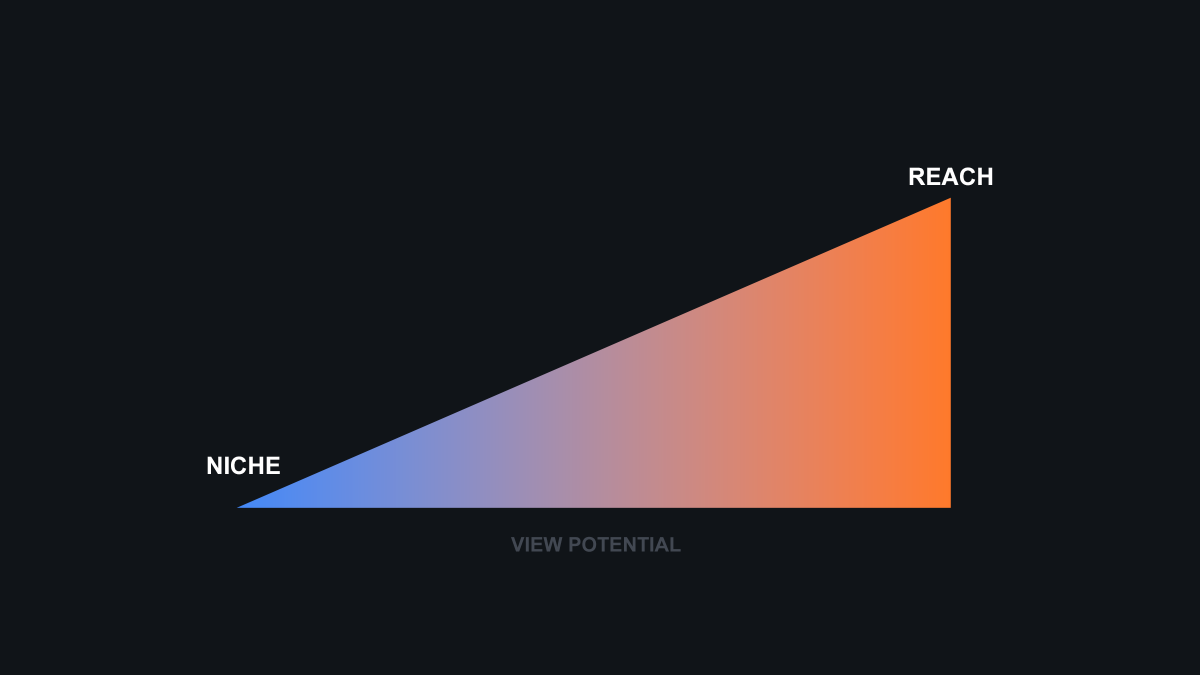
- Niche: Requires prior context to spark interest
- Reach: No prior context is required to spark interest
Most of the time, it’s somewhere in between.
20
For the viewers however, it’s another story as they are infintely more complex.
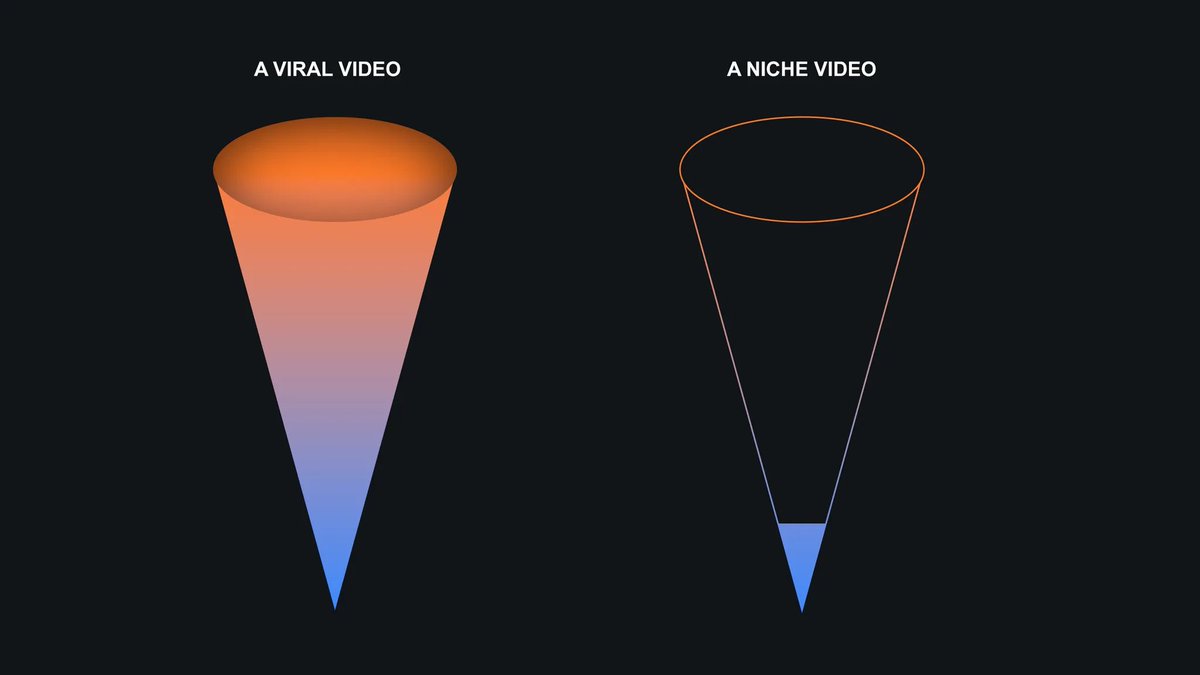
The best way to illustrate in a simple way their interests would be through a conical spectrum:
The best way to illustrate in a simple way their interests would be through a conical spectrum:
21
So the audience of a YouTube video would look like this:
22
Important take away so far:
- The algorithm is seeking videos for viewers, not viewers for videos.
- A piece of content is either “niche”, “reach” or (most of the time) somewhere in between.
Now that you have the basics, let’s get to the good stuff.
- The algorithm is seeking videos for viewers, not viewers for videos.
- A piece of content is either “niche”, “reach” or (most of the time) somewhere in between.
Now that you have the basics, let’s get to the good stuff.
23
𝟐) 𝐇𝐎𝐖 𝐓𝐇𝐄 𝐀/𝐁 𝐅𝐄𝐀𝐓𝐔𝐑𝐄 𝐌𝐈𝐒𝐋𝐄𝐀𝐃𝐒 𝐓𝐇𝐄 𝐀𝐋𝐆𝐎𝐑𝐈𝐓𝐇𝐌
⚠️ To keep it accessible to everyone, the following explanation is a simplified version.
It’s far (far) more complex than that in reality.
⚠️ To keep it accessible to everyone, the following explanation is a simplified version.
It’s far (far) more complex than that in reality.
24
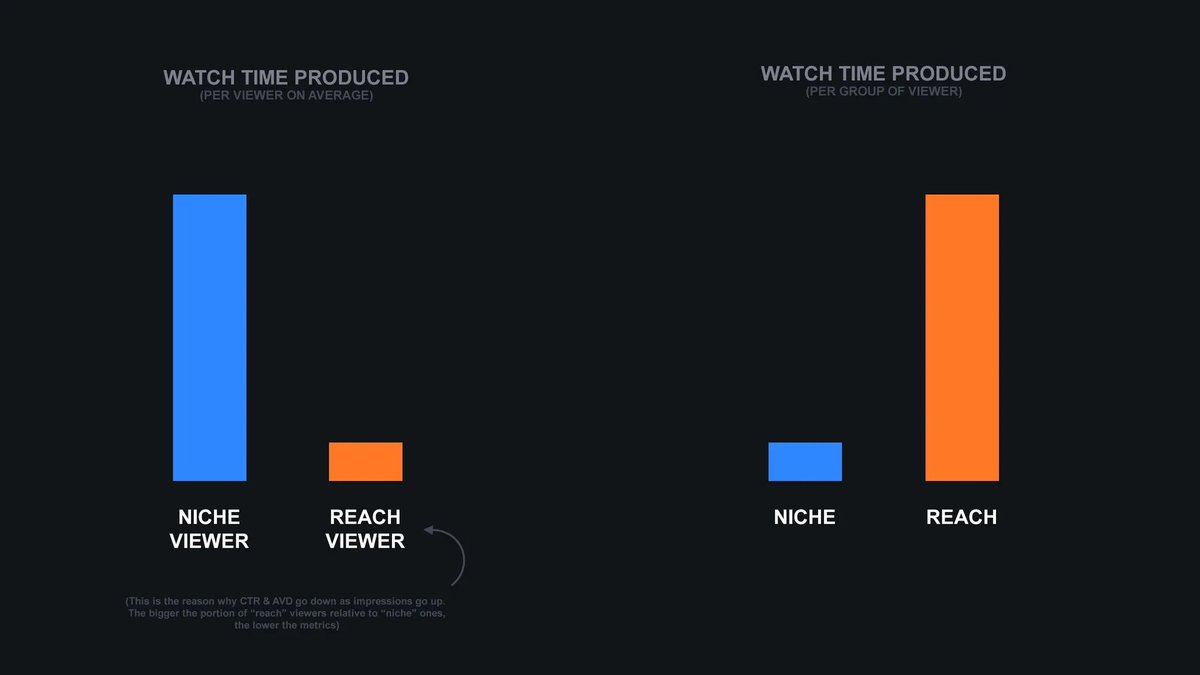
What weighs more, 100 sardines or 1 whale? 1 whale.
Which are more numerous in the ocean, sardines or whales? Sardines.
The same logic applies to YouTube:
Which viewers produce more watch time? Those familiar with the topic/content, or “niche” viewers.
Which are more numerous in the ocean, sardines or whales? Sardines.
The same logic applies to YouTube:
Which viewers produce more watch time? Those familiar with the topic/content, or “niche” viewers.
25
Which are more numerous? Reach viewers.
This is the first major flaw in the A/B feature, it’s blind to this distinction.
Just like the CTR & AVD problem, here, YouTube assumes all viewers are the same.
They are not.
This is the first major flaw in the A/B feature, it’s blind to this distinction.
Just like the CTR & AVD problem, here, YouTube assumes all viewers are the same.
They are not.
26
There’s a huge asymmetry in how viewers produce watch time.
“Niche viewers” are like the whales in our example, individually they produce more watch time on average than a “reach viewer”.
“Niche viewers” are like the whales in our example, individually they produce more watch time on average than a “reach viewer”.
27
But because “reach” viewers are far more numerous (just like sardines), as a group they produce way more watch time.
28
As we've seen, a video is fixed on the niche/reach spectrum and can’t move.
The same is true for thumbnails: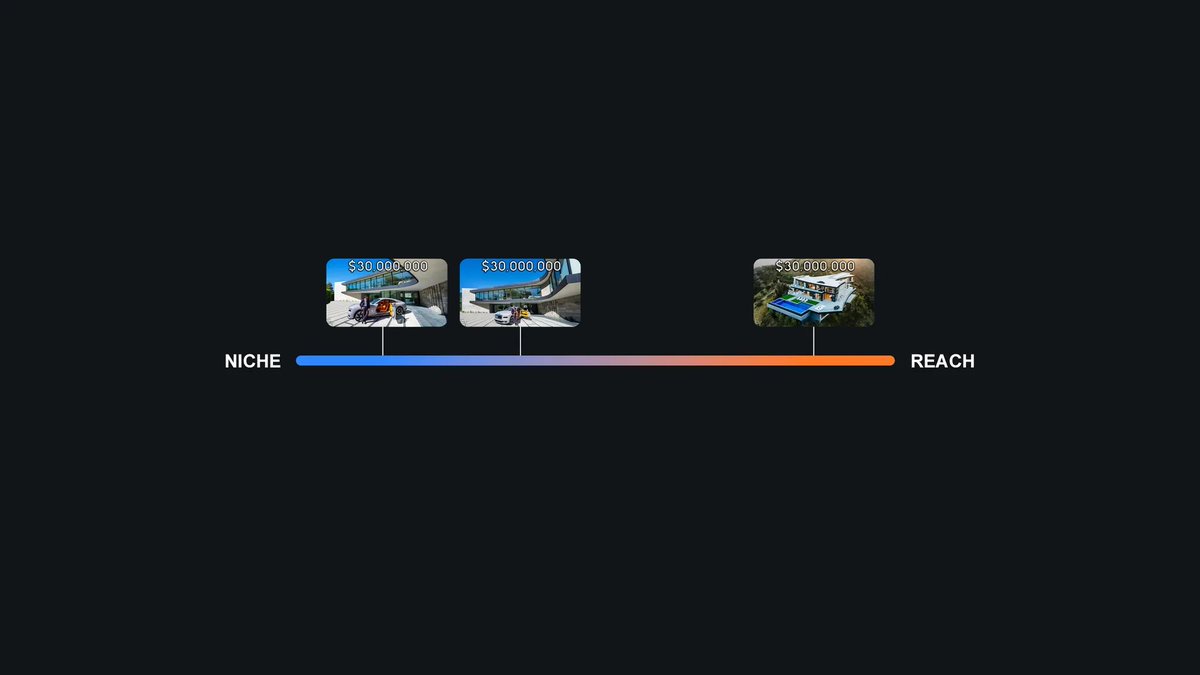
The same is true for thumbnails:
29
Viewers however are far more complex.
Their interests are constantly shifting, but if we could freeze time, it would look like this: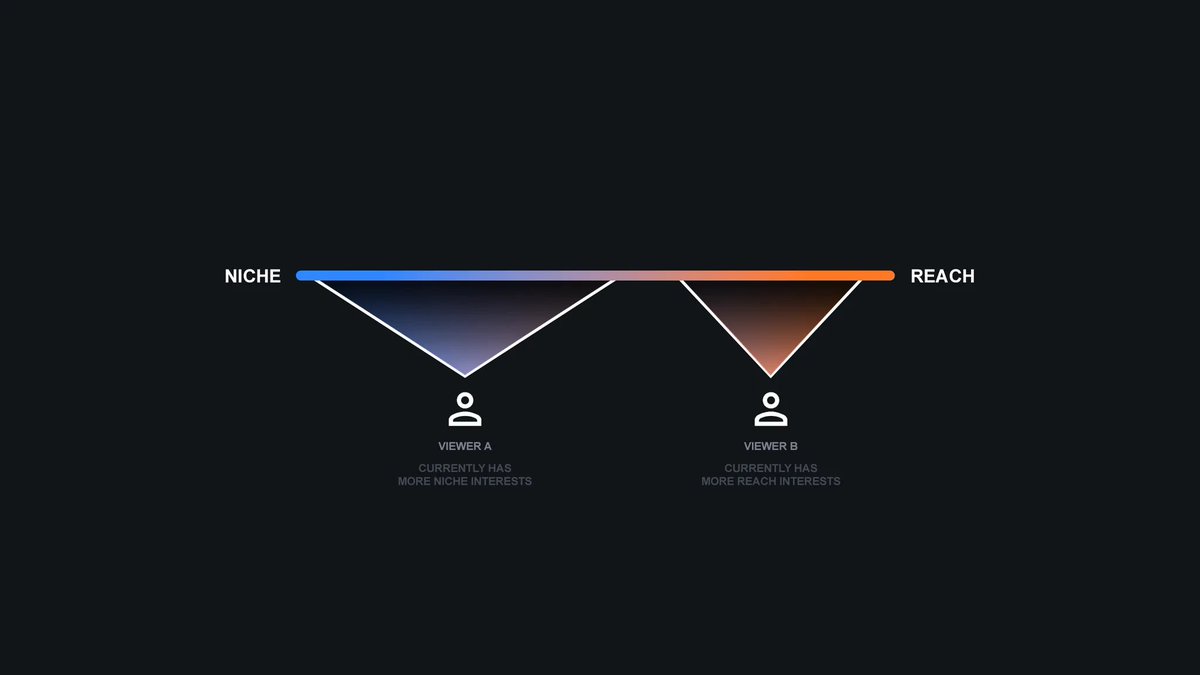
Their interests are constantly shifting, but if we could freeze time, it would look like this:
30
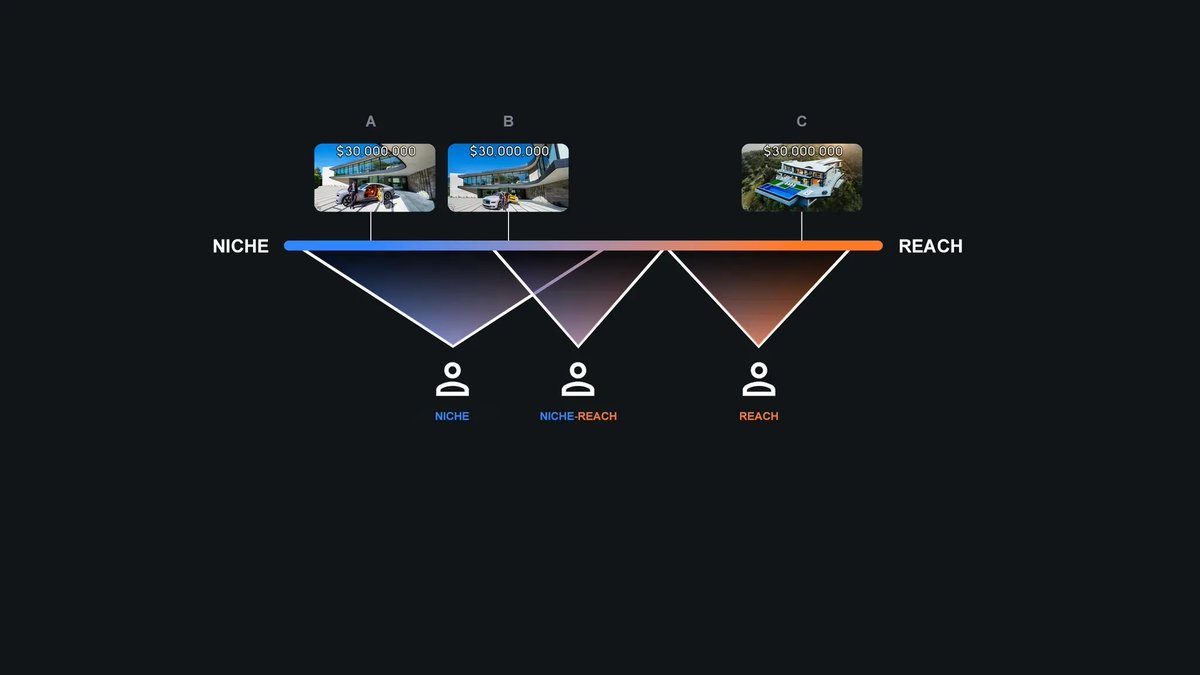
Now if we combine viewers and thumbnails we get this:
31
Depending on which thumbnail is recommended, each viewer because of their interests difference, will not act the same:
- The NICHE viewer would click on A & B but not C
- The NICHE-REACH viewer would click on B but not A & C
- The REACH viewer would click on C but not A & B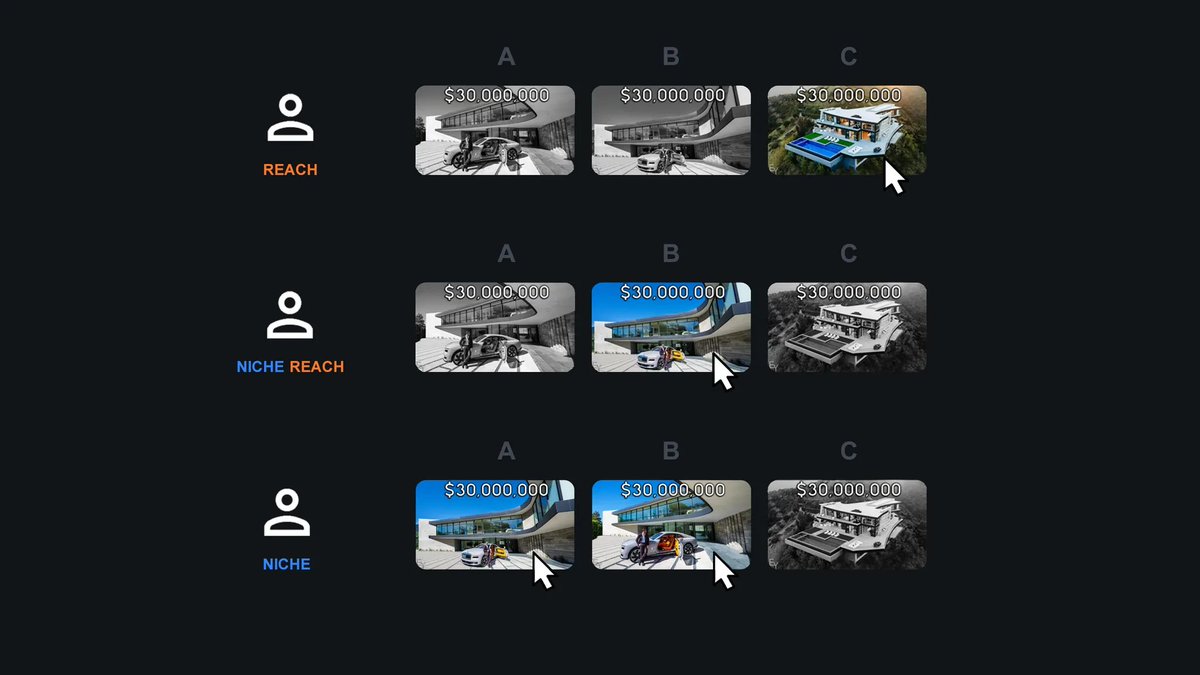
- The NICHE viewer would click on A & B but not C
- The NICHE-REACH viewer would click on B but not A & C
- The REACH viewer would click on C but not A & B
32
And as previously discussed, the more niche the viewer, the more watch time they generate on average.

33
Remember, the A/B test is running live randomly showing one of the 3 thumbnails to the viewers.
And do you know what else is also running live in parallel?
The algorithm.
And do you know what else is also running live in parallel?
The algorithm.
34
Here’s the consequence:
Since viewers aren’t all seeing the same thumbnail, REACH viewers end up with a 2/3 chance (66%) of not seeing the optimal thumbnail.
So, 66% of the time, they don’t click, hurting the video’s reach.
Since viewers aren’t all seeing the same thumbnail, REACH viewers end up with a 2/3 chance (66%) of not seeing the optimal thumbnail.
So, 66% of the time, they don’t click, hurting the video’s reach.
35
On the other side, “niche” traffic gets amplified because NICHE viewers produce more watch time on average.
And in this case, they also have a 2/3 chance (66%) of seeing a thumbnail that aligns with their interests.
And in this case, they also have a 2/3 chance (66%) of seeing a thumbnail that aligns with their interests.
36
Creating a massive bias toward niche thumbnails:

37
Biased by the A/B feature, the algorithm assumes that viewers similar to those in the REACH category aren’t the right fit for this video and will progressively stop recommending it to them.
38
This means not only does the A/B misleads the algorithm, it also fucks the content creator over in the process.
Instead of having a “normal” reach that would look like this (where each category of viewer is explored properly):
Instead of having a “normal” reach that would look like this (where each category of viewer is explored properly):
39
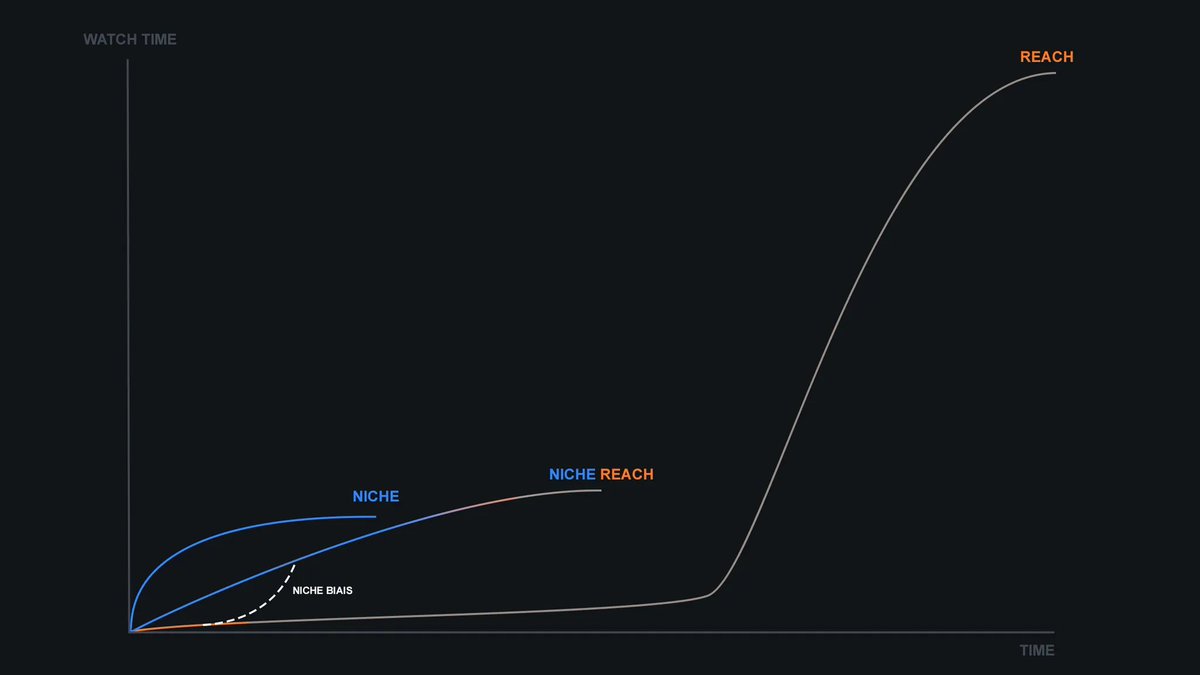
There’s a biais that leads the algorithm away from the REACH path:
40
A lot of REACH viewers will never be reached.
And the final nail in the coffin:
The A/B test eventually stops, in order to provide watch time share results per thumbnail.
And the final nail in the coffin:
The A/B test eventually stops, in order to provide watch time share results per thumbnail.
41
This further amplifies the niche bias, as REACH viewers take longer to be reached than NICHE viewers.

42
The A/B feature assumes the watch time distribution per thumbnail will remain the same forever when in reality it’s more often than not asymmetrical.
What the A/B feature assumes:
What the A/B feature assumes:
43
Reality:

44
When you get your thumbnail results, depending on how reach/niche each thumbnail is, this is the reality of it:

45
Caused by the niche bias:

46
So in layman’s terms:
- The A/B feature is (unwillingly) designed to kill the reach of your video
- The A/B results don’t reflect the preferences of your video’s true audience
Do you understand how fucked up it is?
- The A/B feature is (unwillingly) designed to kill the reach of your video
- The A/B results don’t reflect the preferences of your video’s true audience
Do you understand how fucked up it is?
47
Before you ask, if you’re wondering whether the A/B feature ruined your video’s reach, the answer is most likely yes.
The video I mentioned at the start perfectly illustrates this explanation.
Check that:
The video I mentioned at the start perfectly illustrates this explanation.
Check that:
48
As you can see, the A/B test was run from the beginning, with no additional changes to the packaging.
It’s a video about an “architectural modern home with insane views,” yet the thumbnail prominently features a car in the foreground.
Weird isn’t it?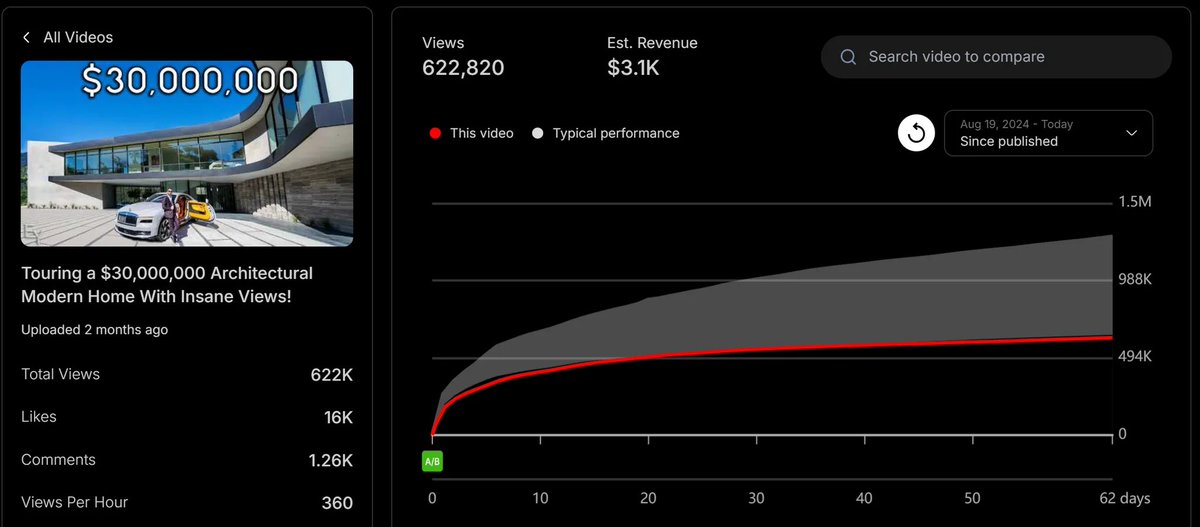
It’s a video about an “architectural modern home with insane views,” yet the thumbnail prominently features a car in the foreground.
Weird isn’t it?
49
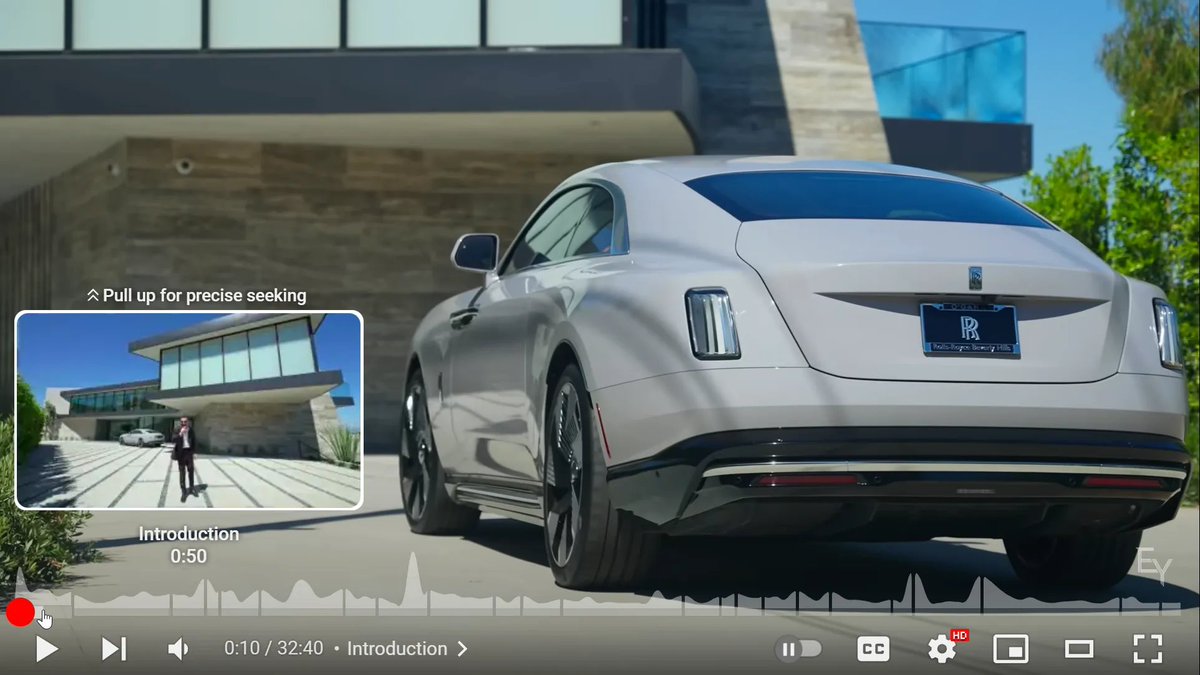
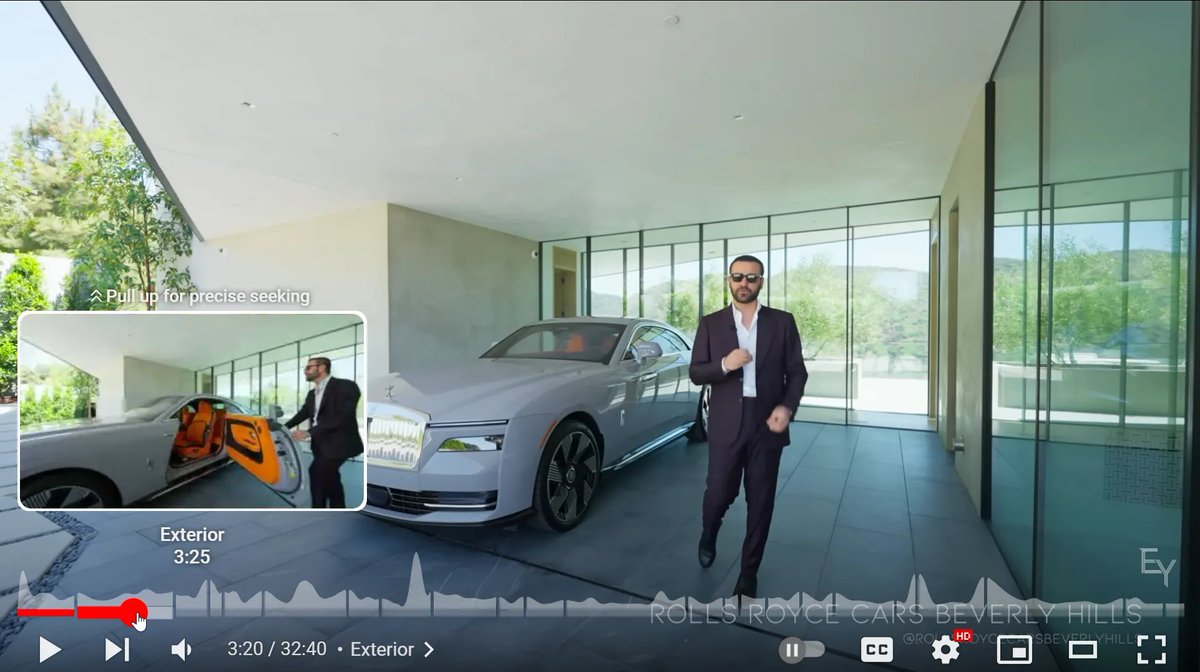
I dug deeper, and here’s what I found at about 3 minutes: he included a sponsored segment for “Rolls Royce Beverly Hills,” featuring the very first electric Rolls Royce model.
50
In the first 4mn, the car is shown several times and during the sponsored segment, he highlights the interior and discusses it briefly.
Because of that, the video got traction amongst car lovers.
Because of that, the video got traction amongst car lovers.
51
As a result, the recommendation algorithm kept showing the video to more and more of them, biasing it toward this niche.
The perfect illustration of the “niche bias”.
The perfect illustration of the “niche bias”.
52
Viewers interested in villa tours were shown car thumbnails 2 out of 3 times, which didn’t interest them.
They didn’t click, so the algorithm gradually recommended the video less and less to that kind of viewers, reinforcing the bias.
They didn’t click, so the algorithm gradually recommended the video less and less to that kind of viewers, reinforcing the bias.
53
That's the reason why the "car thumbnail" won over the "house thumbnail," even though it doesn’t represent the content of the video.
54
On the bright side, if your goal is to target niche viewers, the A/B test is ideally suited for this purpose and may actually work great some cases.
For example here (in red, the thumbnail that won the YouTube A/B), the video was uploaded late april 2024.
For example here (in red, the thumbnail that won the YouTube A/B), the video was uploaded late april 2024.
55
Since the content was produced for a niche audience and serves a purpose specific to a limited time frame (only relevant 2 months out of the year), the niche bias isn’t a problem.
56
𝟑) 𝐂𝐎𝐍𝐂𝐋𝐔𝐒𝐈𝐎𝐍
The A/B test feature is fundamentally broken.
It compromises (or at best, influences) what it’s supposed to measure.
Much like in quantum physics, where measuring a system directly impacts it.
Shifting what you’re trying to observe and altering the outcome, leaving the original, untouched state out of reach (observer effect).
The A/B test feature is fundamentally broken.
It compromises (or at best, influences) what it’s supposed to measure.
Much like in quantum physics, where measuring a system directly impacts it.
Shifting what you’re trying to observe and altering the outcome, leaving the original, untouched state out of reach (observer effect).
57
Using the YouTube A/B tool will kill your reach.
I’m just scratching the surface here, I could go much deeper, but this should be enough to get the big picture.
If you're looking for a solution, try the Viral Economy:
investors.kitchen
I’m just scratching the surface here, I could go much deeper, but this should be enough to get the big picture.
If you're looking for a solution, try the Viral Economy:
investors.kitchen
58
Yes this is a shameless plug but I truly believe this is the best tool for A/B simulation out here since I built it.
Why? Because this fundamental problem goes beyond just YouTube, it's also present on any live third-party A/B tool you can find out here (for the same reason).
Why? Because this fundamental problem goes beyond just YouTube, it's also present on any live third-party A/B tool you can find out here (for the same reason).
59
Want to save a video butchered by the A/B feature? Use the Viral Economy and find the best thumbnail.
Want to ensure your next project has the most "reach" packaging? Use the Viral Economy.
Want to ensure your next project has the most "reach" packaging? Use the Viral Economy.
60
Also, unlike YouTube, you can test an infinite combination of title & thumbnails (not just 3), without wasting a single precious impression YouTubethat could potentially bias the algorithm and kill your reach.
investors.kitchen
investors.kitchen
61
For the first time, I’m offering 15 people 3 free A/B simulations in the Viral Economy for their projects (present or future).
For that, RT the first tweet of this thread to both raise awareness of this problem, and have a chance of winning.
(Results in 48h under this thread)
For that, RT the first tweet of this thread to both raise awareness of this problem, and have a chance of winning.
(Results in 48h under this thread)
62
I also encourage you to share your YouTube A/B results from YouTube below as I might dig deeper into it in the future.
Thank you for your attention.
Thank you for your attention.


