The time has come to debunk the biggest lie (or ignorance/lack of...

wono@wono_strategy
14 views
Mar 01, 2025
~3 min read
Advertisement
1
The time has come to debunk the biggest lie (or ignorance/lack of experience) spread across YouTube:
Good retention graph = more views
This is 100% wrong (not even 99%).
Don't trust me, the proofs are here:
(thread)
Good retention graph = more views
This is 100% wrong (not even 99%).
Don't trust me, the proofs are here:
(thread)
2
In 2018 I was running a pro gameplay channel on Dota 2 where I uploaded 1 video/day (500+ uploads total).
I used this channel as a laboratory to experiment with YouTube.
One day I had the opportunity to finally check if retention graphs had a correlation with views.
I used this channel as a laboratory to experiment with YouTube.
One day I had the opportunity to finally check if retention graphs had a correlation with views.
3
A viewer sent me one REALLY remarkable gameplay:
Someone managed to win 667 games in a row (with a ~50% avg winrate, it's like flipping a coin 667 times and getting tails on every single one of them).
So I dug into it, but it was really disappointing.
Someone managed to win 667 games in a row (with a ~50% avg winrate, it's like flipping a coin 667 times and getting tails on every single one of them).
So I dug into it, but it was really disappointing.
4
It was just a bunch of cheaters using a server exploit to farm ladder points with bot accounts.
The gameplay was literally 18 minutes of one team feeding kills to another. Extremely boring.
The gameplay was literally 18 minutes of one team feeding kills to another. Extremely boring.
5
So I was about to dish out this replay until an idea came to mind:
Isn't that a great opportunity to test the correlation between the retention graph and views?
Knowing the retention graph would be horrible, I decided to do it for science.
The results were mind-blowing.
Isn't that a great opportunity to test the correlation between the retention graph and views?
Knowing the retention graph would be horrible, I decided to do it for science.
The results were mind-blowing.
6
I expected the video to be a disaster, and I was ready to put it back in private.
But to my surprise, it went like this:
- 1/10 after 2 hours
- 3/10 after 12 hours
- 5/10 after 24 hours
But to my surprise, it went like this:
- 1/10 after 2 hours
- 3/10 after 12 hours
- 5/10 after 24 hours
7
After a month I analyzed the data and this is what I found:
• I lost 20 subs in the first 24h but overall I gained +48 subs, quite surprising.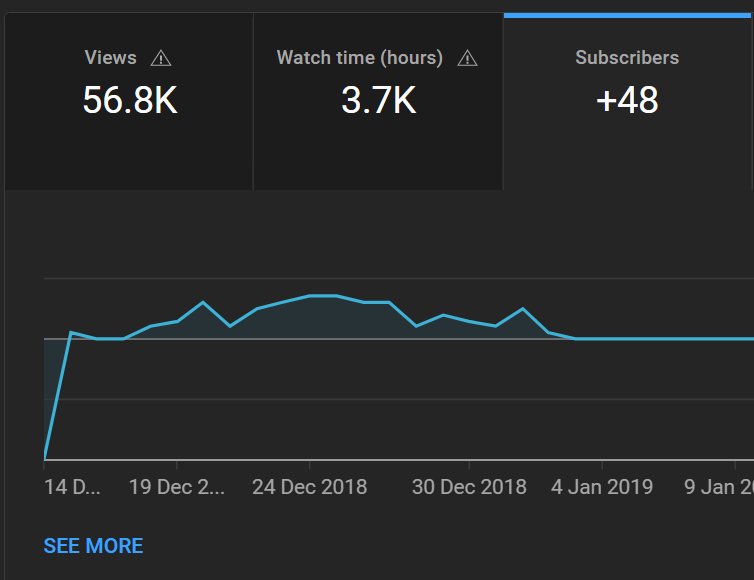
• I lost 20 subs in the first 24h but overall I gained +48 subs, quite surprising.
8
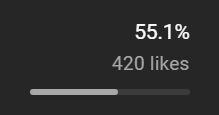
• Not very surprising: a lot of dislikes
9
• The video outperformed by x5 my least viewed videos in this period

10
The retention graph is by far the worst I have ever had in my whole YouTube career (12 years).
Again not a surprise, only 2 minutes out of 20 are interesting.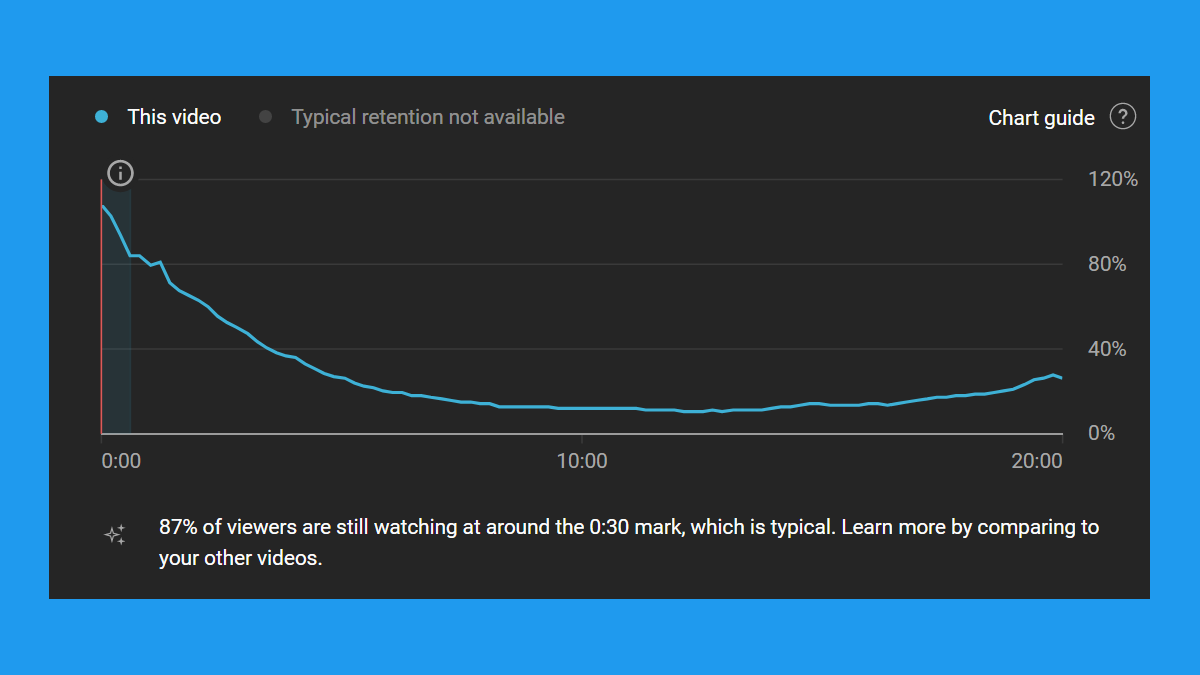
Again not a surprise, only 2 minutes out of 20 are interesting.
11
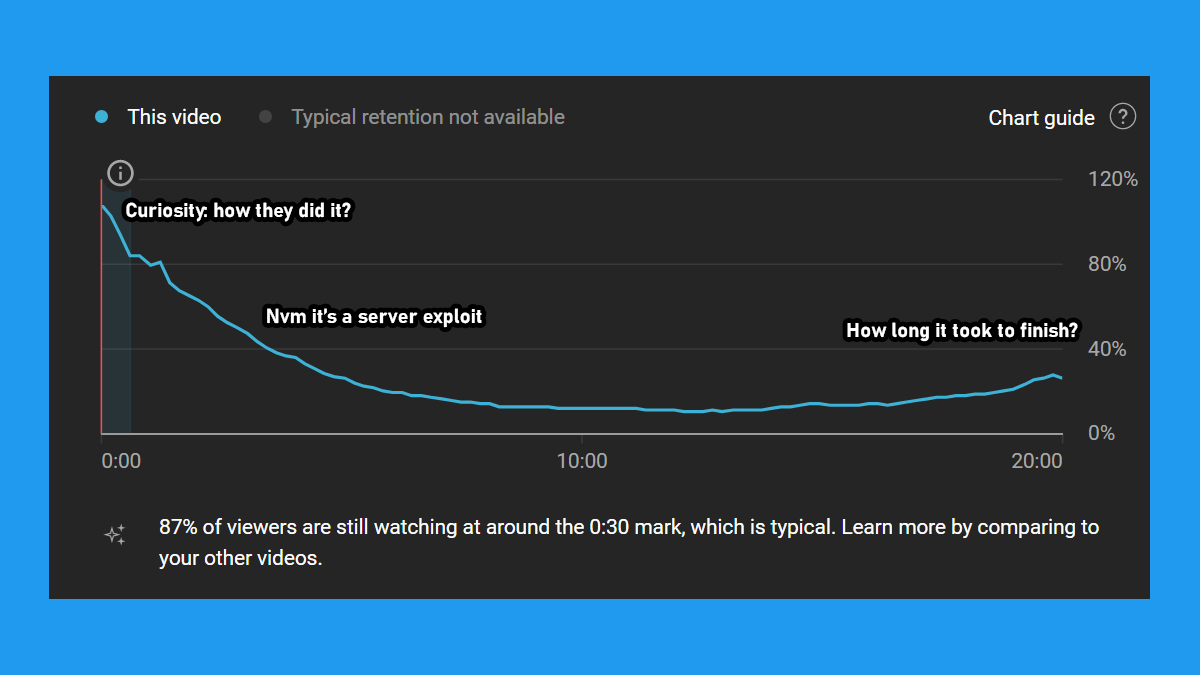
Basically the viewer's journey:
12
Here is a comparison between retention graphs of my least viewed video from that period and this video

13
This extreme case taught me 3 things:
• the retention graph isn't an indicator of views
• quality is not necessarily needed to get views
• "remarkability" is everything
Bad but remarkable content (like this one) will outperform good but average content (like the 10k video).
• the retention graph isn't an indicator of views
• quality is not necessarily needed to get views
• "remarkability" is everything
Bad but remarkable content (like this one) will outperform good but average content (like the 10k video).
14
By remarkable, I mean as Seth Godin puts it: "worth making a remark about".
It means distinct, out of the ordinary, and one-of-a-kind.
It means distinct, out of the ordinary, and one-of-a-kind.
15
I'm not saying to make shit content; quite the opposite in fact, making low-quality content is the worst way to build an audience.
But if you want to get more views, your content HAS TO BE remarkable somehow
Nothing else matters when it comes to getting a lot of views.
But if you want to get more views, your content HAS TO BE remarkable somehow
Nothing else matters when it comes to getting a lot of views.
16
Conclusion:
• Remarkable low-quality content = views 📈
• Remarkable average content = lot of views 📈📈
• Remarkable high-quality content = shit ton of views 🚀
• Remarkable low-quality content = views 📈
• Remarkable average content = lot of views 📈📈
• Remarkable high-quality content = shit ton of views 🚀
17
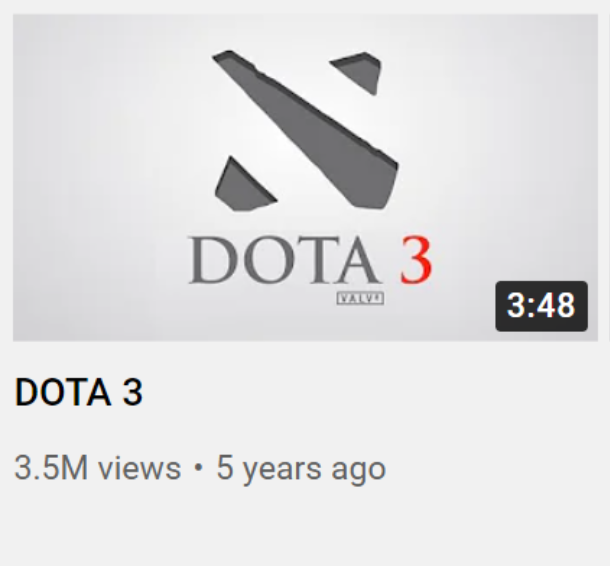
A lot of my most viewed videos of all time are the most effortless I have ever made as you can see here:
18
Or here:
19
Now don't get me wrong, I'm not saying the retention graph is a bad metric, it is great to understand how good your content is.
A good retention graph will not get you more views, but it will get you better and more dedicated viewers.
Hope you found this thread helpful. 🫡
A good retention graph will not get you more views, but it will get you better and more dedicated viewers.
Hope you found this thread helpful. 🫡

