How clueless YouTube gurus use data metrics (CTR, AVD, and...

wono@wono_strategy
13 views
Mar 01, 2025
~14 min read
Advertisement
1
How clueless YouTube gurus use data metrics (CTR, AVD, and retention graphs) to fool content creators.
(Through ignorance, incompetence, or both.)
Mega thread
(Through ignorance, incompetence, or both.)
Mega thread
2
When I started this Twitter 3 months ago, I knew debunking YT gurus wouldn't be a peaceful journey.
But I've never mentioned anyone by name so far.
My goal is to fight ideas, not people, but today I will make an exception.
Sorry not sorry.
But I've never mentioned anyone by name so far.
My goal is to fight ideas, not people, but today I will make an exception.
Sorry not sorry.
3
This thread is a PERFECT illustration of how self-proclaimed youtube experts can completely ruin your career as a creator if you follow them blindly.
They spread lies & data they don't understand to prove points they never battle-tested.
I highly advise you to read it entirely.
They spread lies & data they don't understand to prove points they never battle-tested.
I highly advise you to read it entirely.
4
A bit of context first.
I have been a youtube creator since 2011 and have built 7 channels in total over the last 12 years, I created this Twitter to share my experience and what I've learned along the way.
I have been a youtube creator since 2011 and have built 7 channels in total over the last 12 years, I created this Twitter to share my experience and what I've learned along the way.
5
Among the things I share this:
CTR/AVD/Retention graphs are fairy tales WHEN it comes to understanding virality (or more views).
These metrics (especially CTR & AVD) hold way more noise than signal.
CTR/AVD/Retention graphs are fairy tales WHEN it comes to understanding virality (or more views).
These metrics (especially CTR & AVD) hold way more noise than signal.
6
But recently, below this tweet, 2 "how to youtube" twitter accounts (@ItsBuzzyYT & @LowKeyJude) replied, showing their disagreement (which is completely fine, I'm always open to debate).
wono@wono_strategy
How to ruin a perfectly fine channel:
• "The CTR is low, the thumbnail has to be changed"
• "Let's talk very fast in the intro to increase retention"
• "This creator has such big results, let's copy his content"
• "The CTR is low, the thumbnail has to be changed"
• "Let's talk very fast in the intro to increase retention"
• "This creator has such big results, let's copy his content"
7
You can find the whole debate here (by scrolling up) if you're interested:
(unless they remove their tweets)
(unless they remove their tweets)
wono@wono_strategy
@ItsBuzzyYT @LowKeyJude Let me know then, I don't want to paraphrase you in a dishonest way.
Every single word from you will be screenshotted so the fidelity of your words will be 100% the reality.
Just answer this:
Are CTR/AVD important metrics to watch to build an audience? And why?
Every single word from you will be screenshotted so the fidelity of your words will be 100% the reality.
Just answer this:
Are CTR/AVD important metrics to watch to build an audience? And why?
8
Important note: none of them ever built a youtube channel from scratch.
At some point in the debate, it felt like explaining colors to a blind person, so I offered to prove them wrong in a thread as it started to get pointless.
At some point in the debate, it felt like explaining colors to a blind person, so I offered to prove them wrong in a thread as it started to get pointless.
wono@wono_strategy
@ItsBuzzyYT @LowKeyJude Let me know then, I don't want to paraphrase you in a dishonest way.
Every single word from you will be screenshotted so the fidelity of your words will be 100% the reality.
Just answer this:
Are CTR/AVD important metrics to watch to build an audience? And why?
Every single word from you will be screenshotted so the fidelity of your words will be 100% the reality.
Just answer this:
Are CTR/AVD important metrics to watch to build an audience? And why?
9
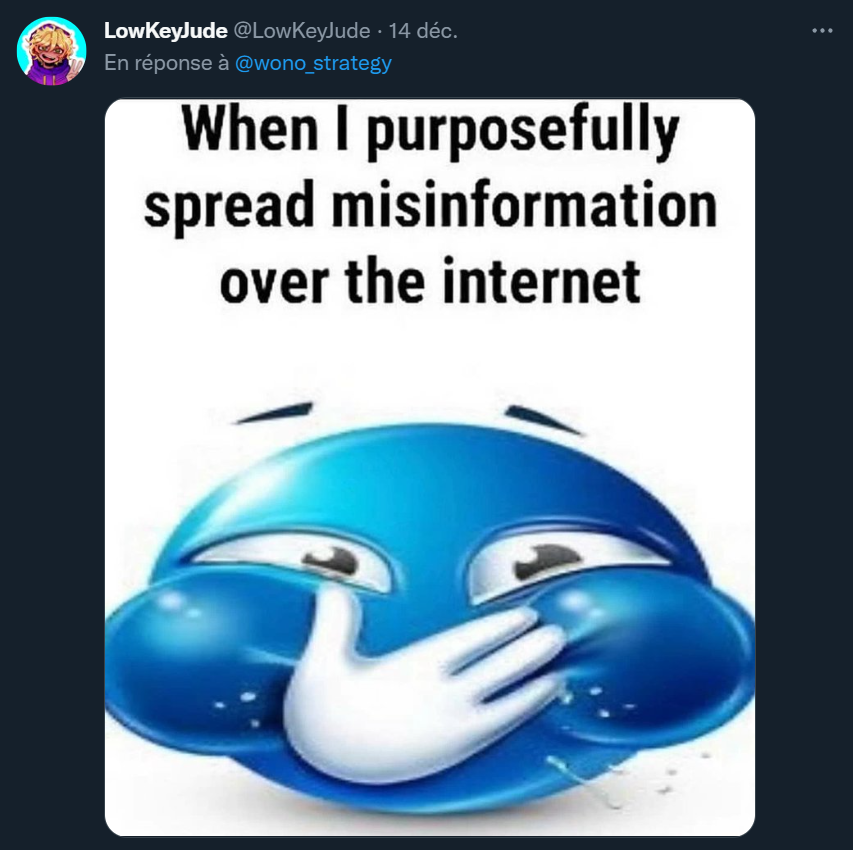
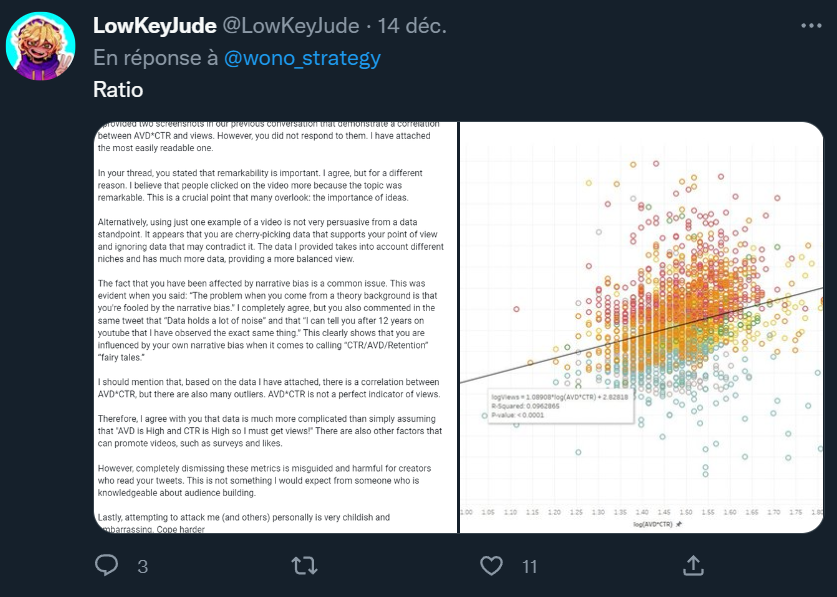
But the next day, under my new thread, they chose to take another path, disrespect and discredit through sarcasm:

10
So without further ado, here is the way, way less cool version of me, answering their arguments and childish behavior.
By the end of this thread, you'll have a crystal clear understanding of how clueless and dangerous to creators they are.
By the end of this thread, you'll have a crystal clear understanding of how clueless and dangerous to creators they are.
11
Their main argument is the following:
AVD*CTR = More impressions = more views.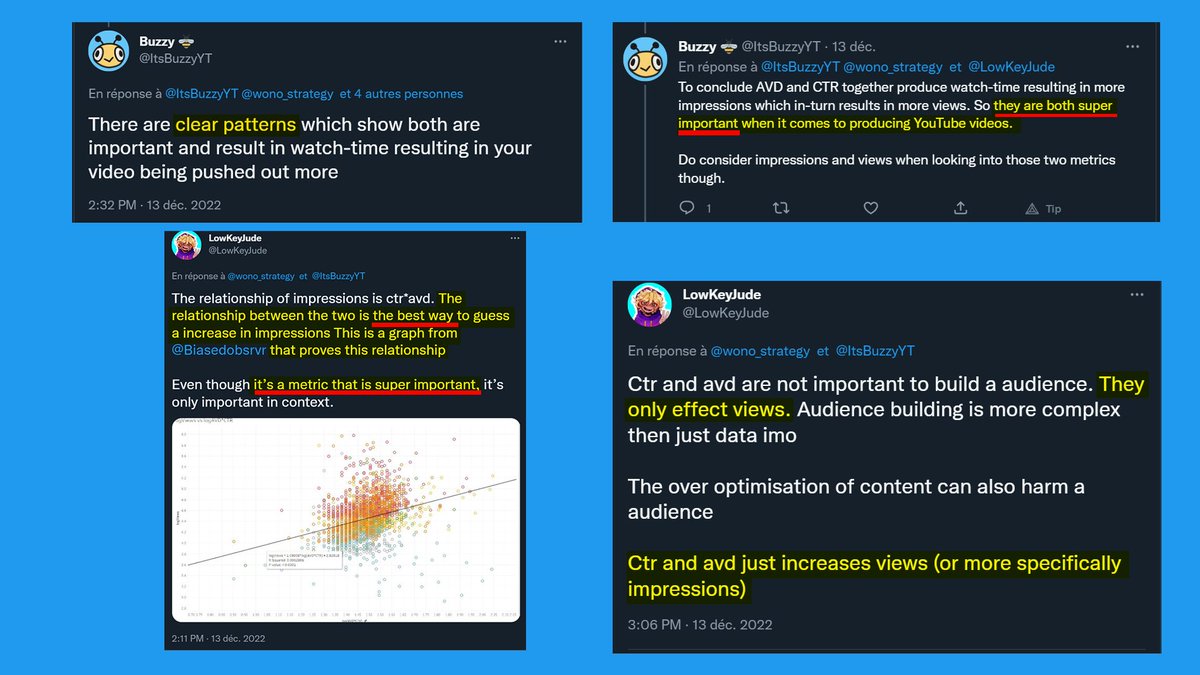
AVD*CTR = More impressions = more views.
12
The foundation of their argument is this graph.
"Wow it seems so complicated, I can't understand shit, this can only be the truth!"
is apparently how these two approached it.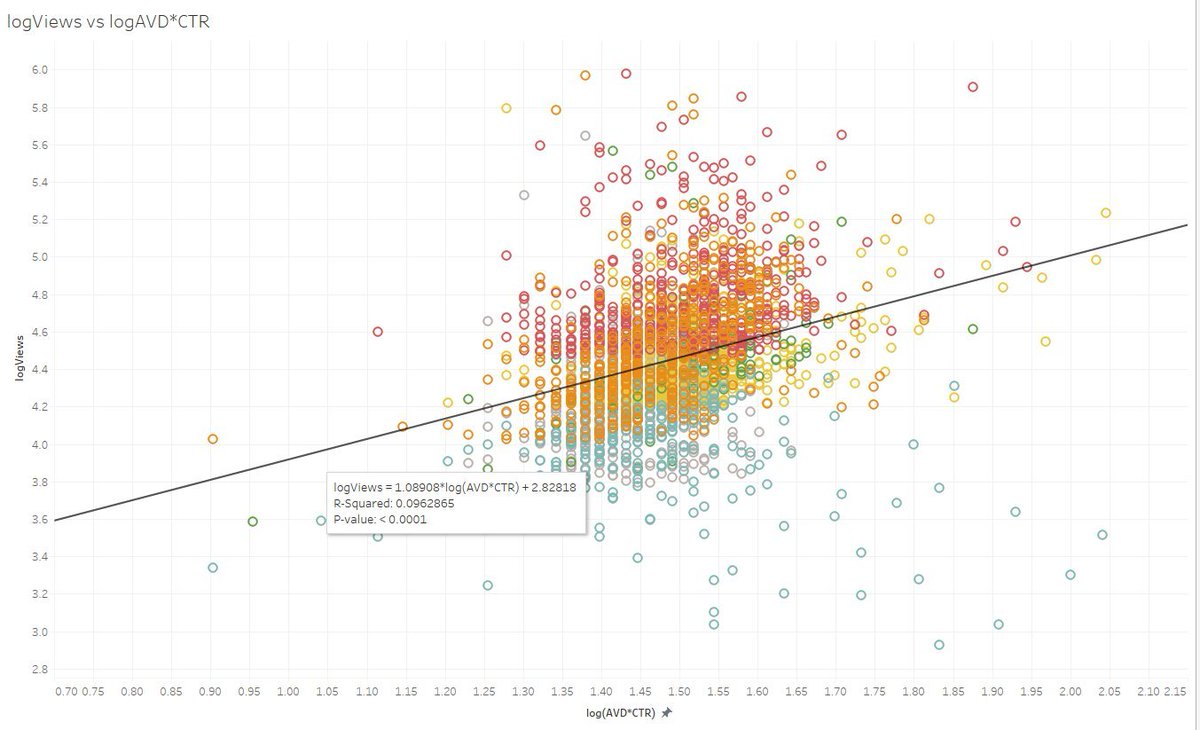
"Wow it seems so complicated, I can't understand shit, this can only be the truth!"
is apparently how these two approached it.
13
Bad news, the conclusion of this graph... is wrong.
Not only the conclusion of this graph is WRONG, but it demonstrates the EXACT OPPOSITE.
We'll get into that, but first a bit of structure.
Not only the conclusion of this graph is WRONG, but it demonstrates the EXACT OPPOSITE.
We'll get into that, but first a bit of structure.
14
I want this thread to be as digest as possible because there will be some technical stuff.
It's way easier to spread a lie than to prove it is a lie, but I will make it as ELI5 as possible so everyone can understand.
It's way easier to spread a lie than to prove it is a lie, but I will make it as ELI5 as possible so everyone can understand.
15
Summary:
1. The basics
2. Data manipulation
3. Conclusion
1. The basics
2. Data manipulation
3. Conclusion
16
Disclaimer:


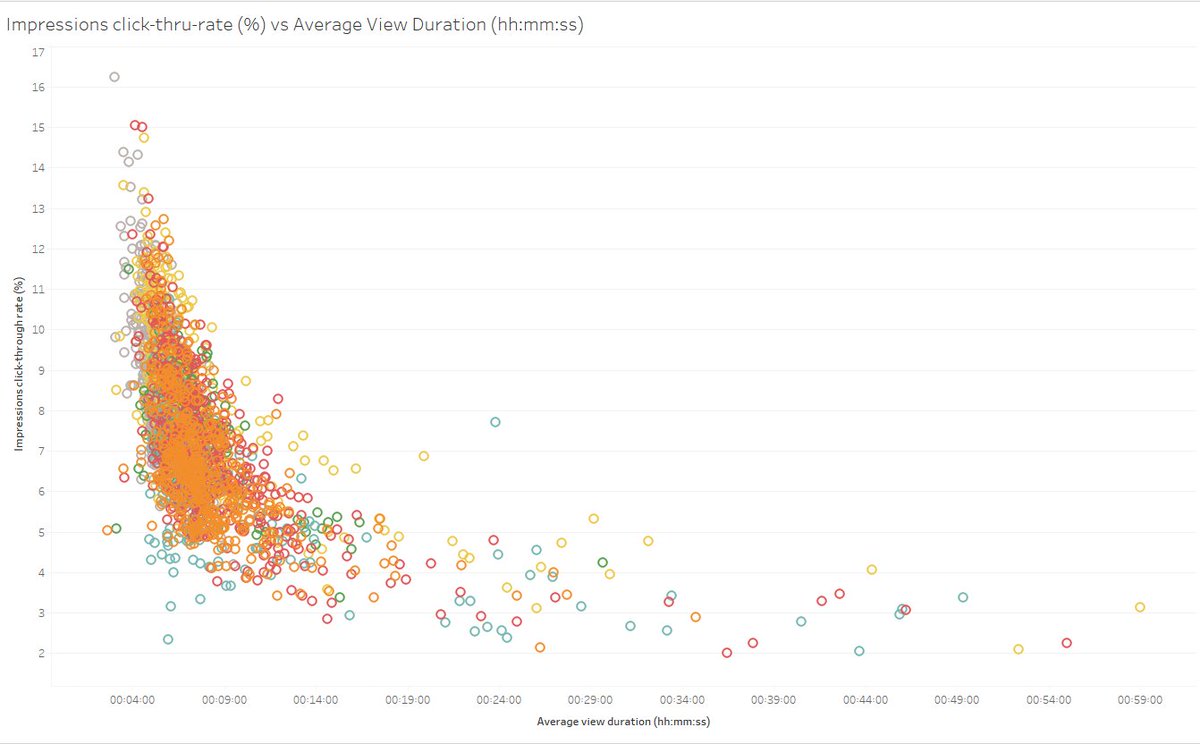
Chris Gileta@Biasedobsrvr
Wanted to follow up @weill tweet to explain a bit more about AVD (Average View Duration) multiplied by CTR (Impressions Click-Through Rate) (CTR*AVD), what it means and why it's one the most important metrics to Youtube's algorithm.
Thread 👇
Thread 👇
17
1️⃣ The basics
Before we get into the technical stuff and show all the flaws in this graphic, I will start with some common sense that people addicted to data tend to overlook completely:
The. Reality. Is. Extremely. Complex.
Before we get into the technical stuff and show all the flaws in this graphic, I will start with some common sense that people addicted to data tend to overlook completely:
The. Reality. Is. Extremely. Complex.
18
Data 101: Correlation IS NOT causation
What does this mean?
Just because there is a correlation doesn't mean it is true.
The truth lies in causation, that's what we're looking for to prove a correlation.
Too technical?
Here's an easy-to-understand example:
What does this mean?
Just because there is a correlation doesn't mean it is true.
The truth lies in causation, that's what we're looking for to prove a correlation.
Too technical?
Here's an easy-to-understand example:
19
"AVD*CTR = more views"
is as true as:
"More potatoes peeled = more fish captured"
Here is the rationale behind this:
is as true as:
"More potatoes peeled = more fish captured"
Here is the rationale behind this:
20
Can you deny that there is a correlation between potatoes peeled and the number of fish caught?
No.
Is it true to say that the more potatoes are peeled, the more fish will get caught?
No.
Why?
Because correlation is not causation.
No.
Is it true to say that the more potatoes are peeled, the more fish will get caught?
No.
Why?
Because correlation is not causation.
21
Causation:
The boat brings more fish:
- not because of the potatoes peeled
but because:
- the area has fish
- the more people go, the more "hands" can fish
"more people = more fish" is not true either,
It is true ONLY if the area where the boat goes fishing has fish.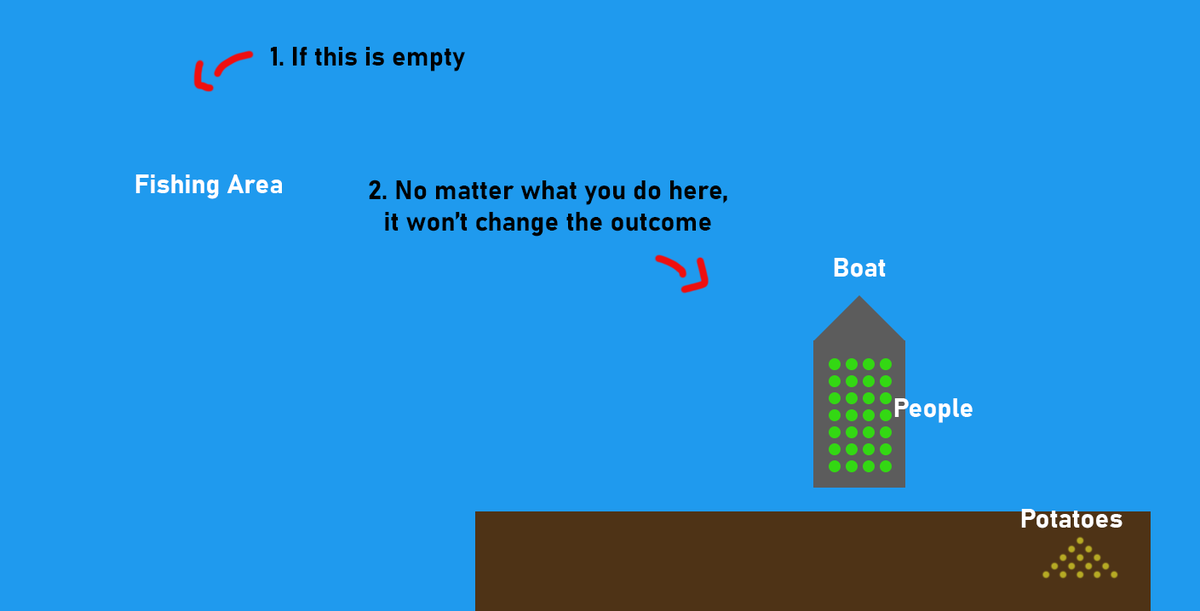
The boat brings more fish:
- not because of the potatoes peeled
but because:
- the area has fish
- the more people go, the more "hands" can fish
"more people = more fish" is not true either,
It is true ONLY if the area where the boat goes fishing has fish.
22
5 people in a fishing area full of fish will bring more than 1000 people to a place where there are no fish.
Conclusion: If you want to catch more fish, study them:
• Find their location
• Study their behavior
• Study how to bait and catch them
Conclusion: If you want to catch more fish, study them:
• Find their location
• Study their behavior
• Study how to bait and catch them
23
Now replace:
• Potatoes with CTR
• People with AVD
• Fish with views
The narrative:
"High CTR/AVD or a good Retention graph (or whatever combination) = more views."
is WRONG, period.
Can it work sometimes?
Sure, just like more people = more fish can work sometimes too.
• Potatoes with CTR
• People with AVD
• Fish with views
The narrative:
"High CTR/AVD or a good Retention graph (or whatever combination) = more views."
is WRONG, period.
Can it work sometimes?
Sure, just like more people = more fish can work sometimes too.
24
What brings views then?
Two words: REMARKABLE CONTENT (as Seth Godin puts it: something worth making a remark about)
That's why it's so important to understand market dynamics, and why I talk a lot about the "attention market".

Two words: REMARKABLE CONTENT (as Seth Godin puts it: something worth making a remark about)
That's why it's so important to understand market dynamics, and why I talk a lot about the "attention market".
wono@wono_strategy
Conclusion:
• Remarkable low-quality content = views 📈
• Remarkable average content = lot of views 📈📈
• Remarkable high-quality content = shit ton of views 🚀
• Remarkable low-quality content = views 📈
• Remarkable average content = lot of views 📈📈
• Remarkable high-quality content = shit ton of views 🚀
25
If you want to get more views, learn how to find remarkable ideas.
THEN work on retention & thumbnail/title, not the other way around.
✅ "Remarkable = views" is always true
❌ "Good retention graph = views" is wrong because without the remarkable condition, it doesn't work.
THEN work on retention & thumbnail/title, not the other way around.
✅ "Remarkable = views" is always true
❌ "Good retention graph = views" is wrong because without the remarkable condition, it doesn't work.
26
Do you start to understand why my bio has "CTR/AVD/Retention = views is a fairy tale"?
Because I sailed and fished the youtube sea for 12 years:
• I've built 7 channels
• Uploaded 1500+ videos
Not only that, I also studied it very carefully.
Because I sailed and fished the youtube sea for 12 years:
• I've built 7 channels
• Uploaded 1500+ videos
Not only that, I also studied it very carefully.
27
I built audiences and went viral several years before CTR/AVD/Retention graphs/Impressions and all these metrics existed.
I had to learn the fundamentals before all that noise and rely on signals.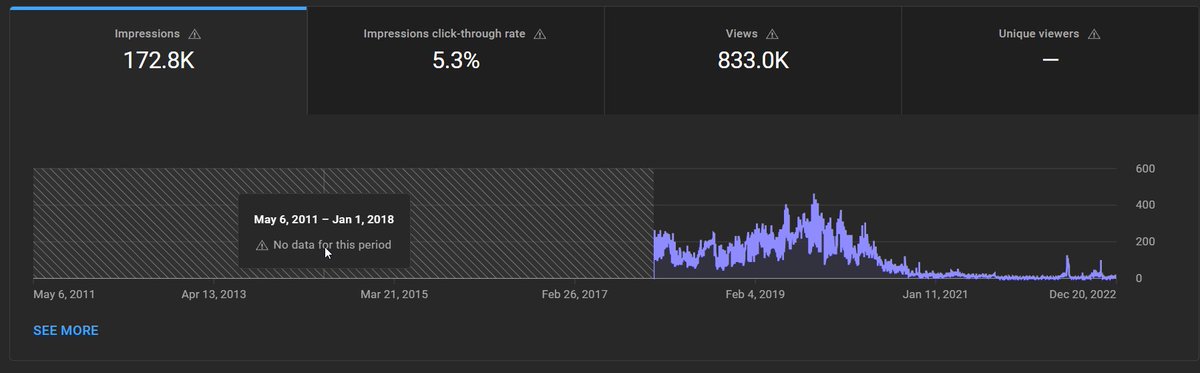
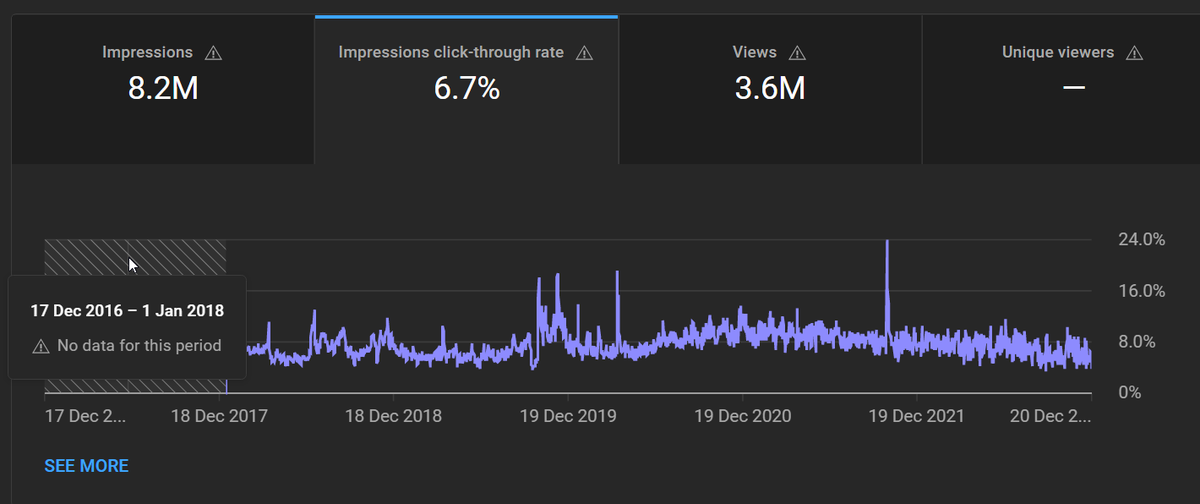
I had to learn the fundamentals before all that noise and rely on signals.
28
I don't need mathematical proofs to see that AVD*CTR is absurd.
AVD*CTR is as bullshit to me as "more potatoes = more fish" is bullshit to you.
Though 2000 years ago, when we didn't know much about fish, people could easily believe that.
AVD*CTR is as bullshit to me as "more potatoes = more fish" is bullshit to you.
Though 2000 years ago, when we didn't know much about fish, people could easily believe that.
29
If you're not an expert that's fine to believe it, but when you claim to be an expert, this tells a lot about you.
What would you think of someone claiming he's an expert fisherman telling you:
"Listen son, the secret is: people*potatoes peeled = more fish"
What would you think of someone claiming he's an expert fisherman telling you:
"Listen son, the secret is: people*potatoes peeled = more fish"
30
Now that you have the big picture, we'll get into the technical stuff to prove (factually & mathematically this time) how wrong this conclusion is.
Don't worry, I will make it easy to understand for everyone.
Don't worry, I will make it easy to understand for everyone.
31
2️⃣ Data Manipulation
What is important to understand with big data, is that the more information, the more noise.
As Nassim Taleb puts it: "more data = more information = more false information."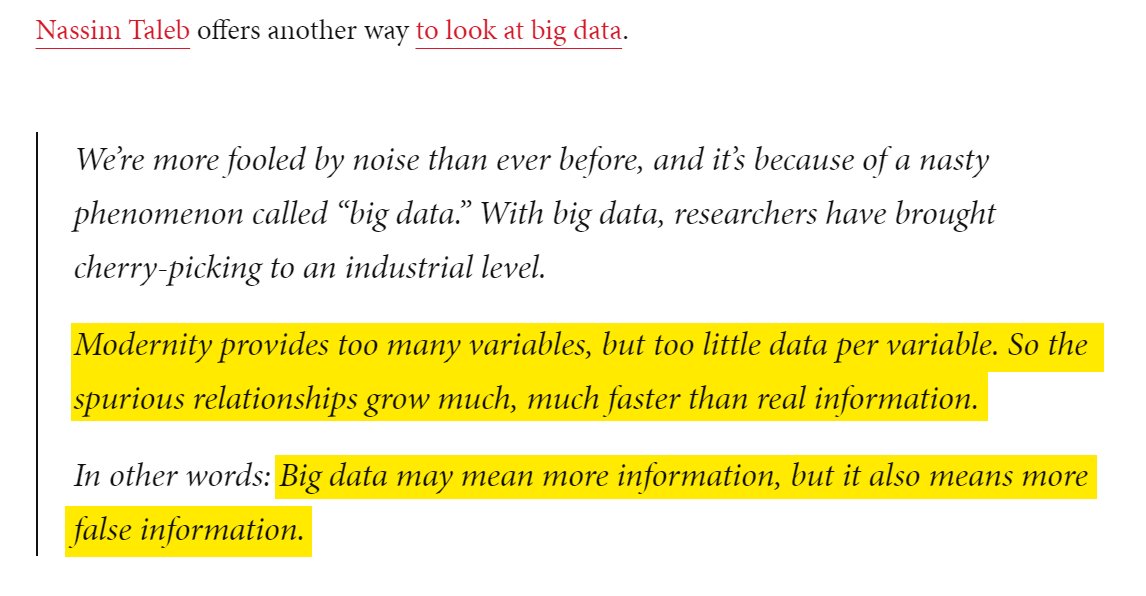
What is important to understand with big data, is that the more information, the more noise.
As Nassim Taleb puts it: "more data = more information = more false information."
32
- "data doesn't lie" 🤦♂️
- "for the most part, it's the best thing to follow" 🤦♂️ 🤦♂️
There are many, many, many, many, maaaaaany ways to deceive people with data.
In fact, it is way easier to spread misinformation using data and I will prove it.
- "for the most part, it's the best thing to follow" 🤦♂️ 🤦♂️
There are many, many, many, many, maaaaaany ways to deceive people with data.
In fact, it is way easier to spread misinformation using data and I will prove it.
33
Now it's time to prove the conclusion of this graph wrong since they've been copy-pasting it left and right (from the thread below).
Chris Gileta@Biasedobsrvr
Wanted to follow up @weill tweet to explain a bit more about AVD (Average View Duration) multiplied by CTR (Impressions Click-Through Rate) (CTR*AVD), what it means and why it's one the most important metrics to Youtube's algorithm.
Thread 👇
Thread 👇
34
Here, @LowKeyJude says:
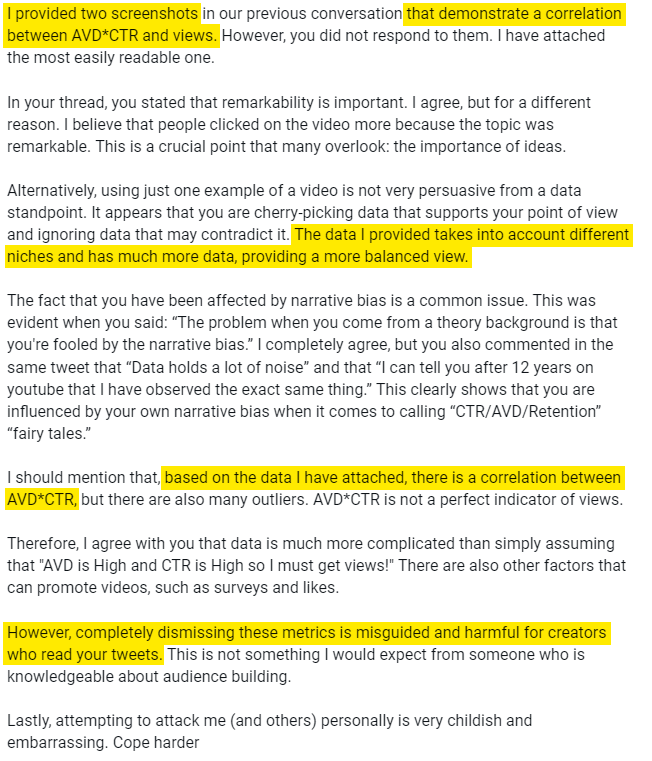
• "that demonstrate a correlation between AVD*CTR & views"
• "based on the data, there is a correlation between AVD*CTR"
• "Completely dismissing these metrics is misguided and harmful for other creators who read your tweets"
Full version below: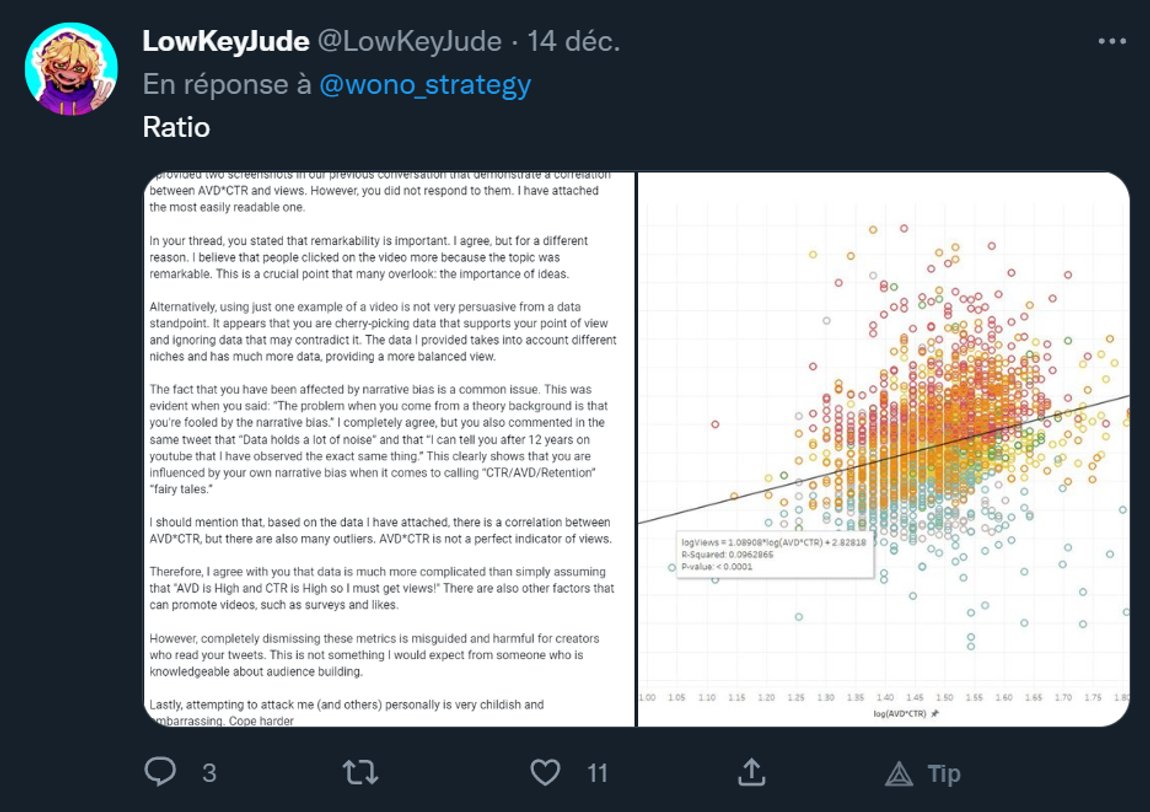
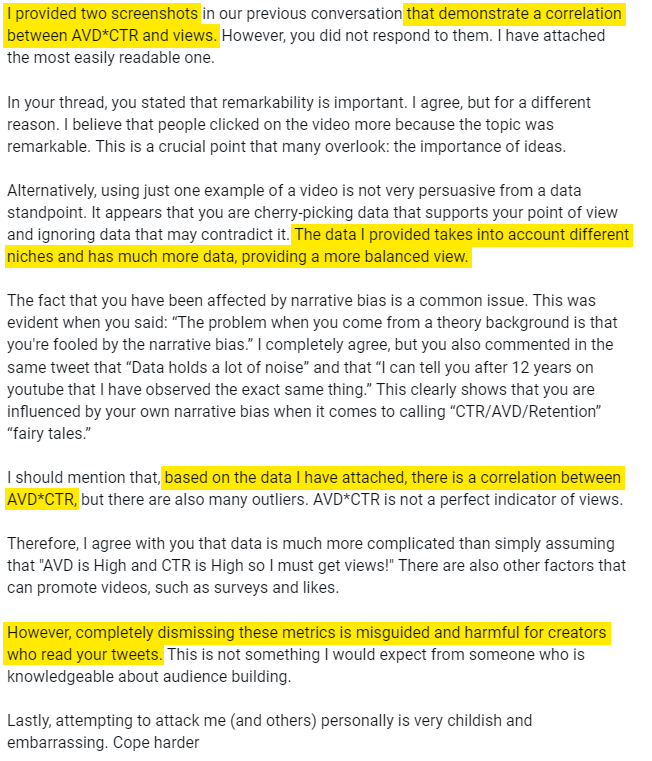
• "that demonstrate a correlation between AVD*CTR & views"
• "based on the data, there is a correlation between AVD*CTR"
• "Completely dismissing these metrics is misguided and harmful for other creators who read your tweets"
Full version below:
35
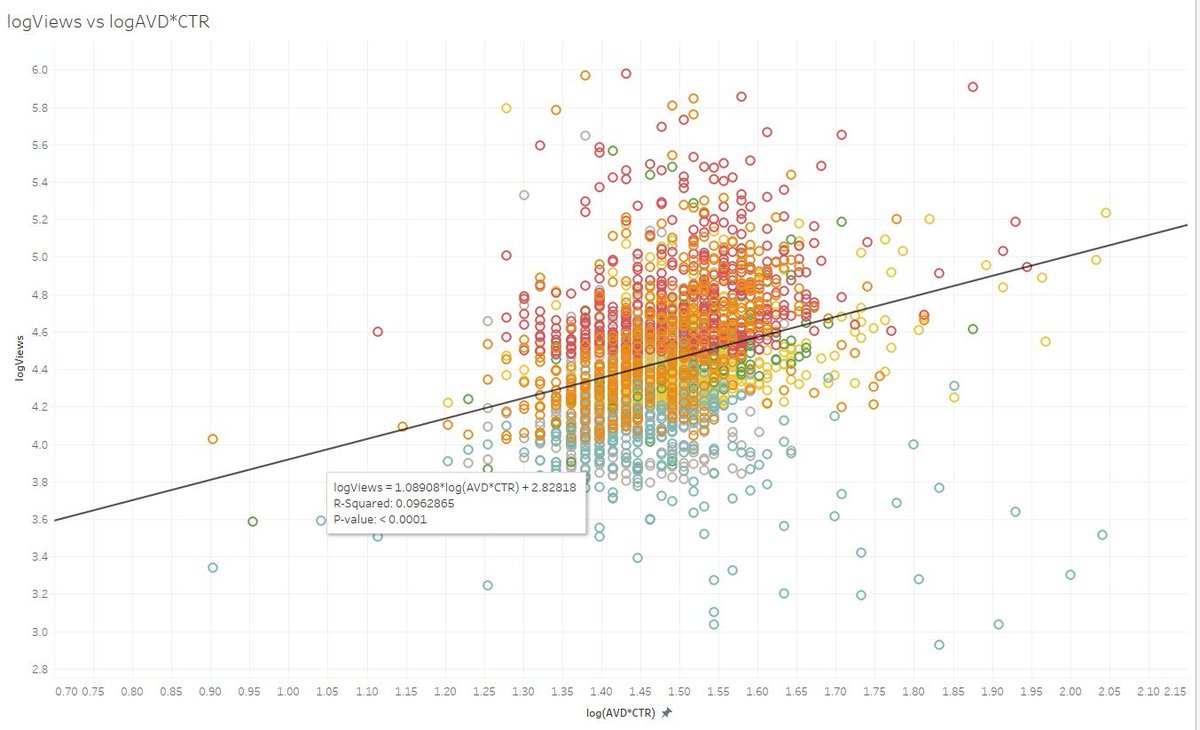
Now let's do some maths (if you're allergic don't worry, I'll make it easy to understand)
I want you to focus on this number from the graph: R² = 0.096 (pic below)
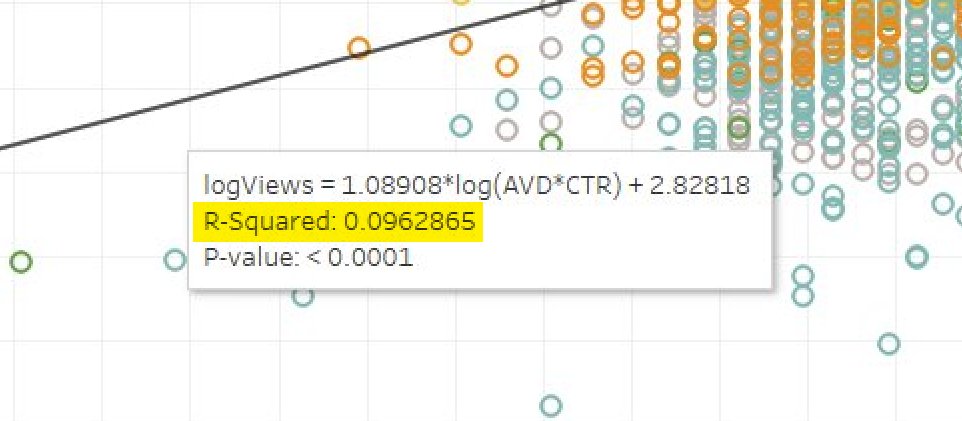
I want you to focus on this number from the graph: R² = 0.096 (pic below)
36
Now, first, read the rules in the pics below.
The model predicts the outcome 9.6% of the time (R² = 0.096)
Do you know what this means?
That it does NOT predict the outcome 90.4% of the time.
Ouch.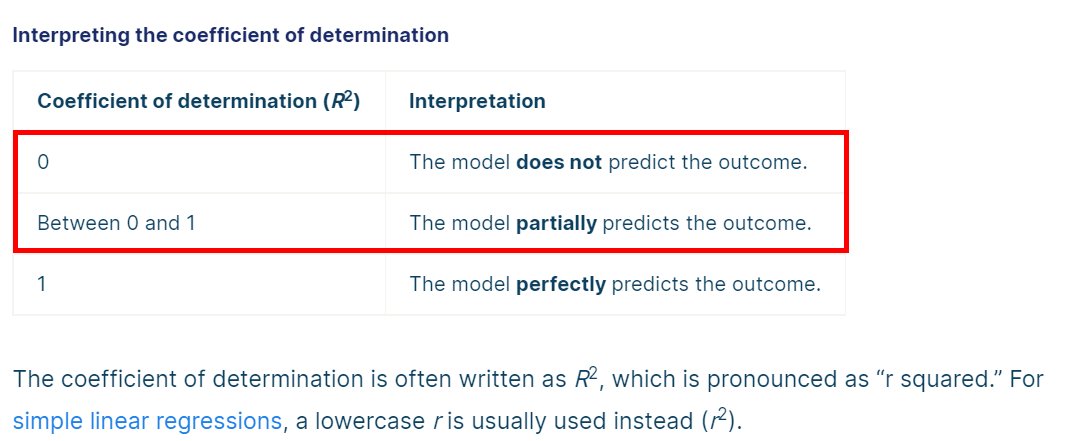
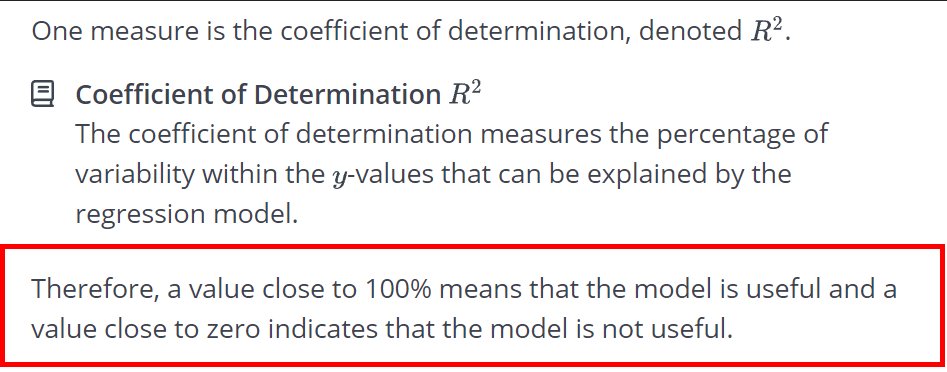
The model predicts the outcome 9.6% of the time (R² = 0.096)
Do you know what this means?
That it does NOT predict the outcome 90.4% of the time.
Ouch.
37
The conclusion of this graph is, in fact, the exact opposite:
90.4% of the time, there is no correlation.
Correlation!!!!
We are not talking about CAUSATION yet!
90.4% of the time, there is no correlation.
Correlation!!!!
We are not talking about CAUSATION yet!
38
I could end this thread right here and it would be game over.
But it wouldn't be fun, right @LowKeyJude?
You brought your friends over to the party, so why stop here? 🤗
But it wouldn't be fun, right @LowKeyJude?
You brought your friends over to the party, so why stop here? 🤗
39
Now let's spice things up:
Let's admit the R² was not 0.096 but 0.99999.
Well, guess what, it still wouldn't prove the causation.
Why? Because of 4 things:
Let's admit the R² was not 0.096 but 0.99999.
Well, guess what, it still wouldn't prove the causation.
Why? Because of 4 things:
40
1. Spurious correlations
The more variables, the more we can find correlations that are not causations.
The more variables, the more we can find correlations that are not causations.
41

42
CTR & AVD (same for the retention graph) are just 2 metrics among {x} others.
In other words, 2 pieces of a puzzle youtube provide to creators.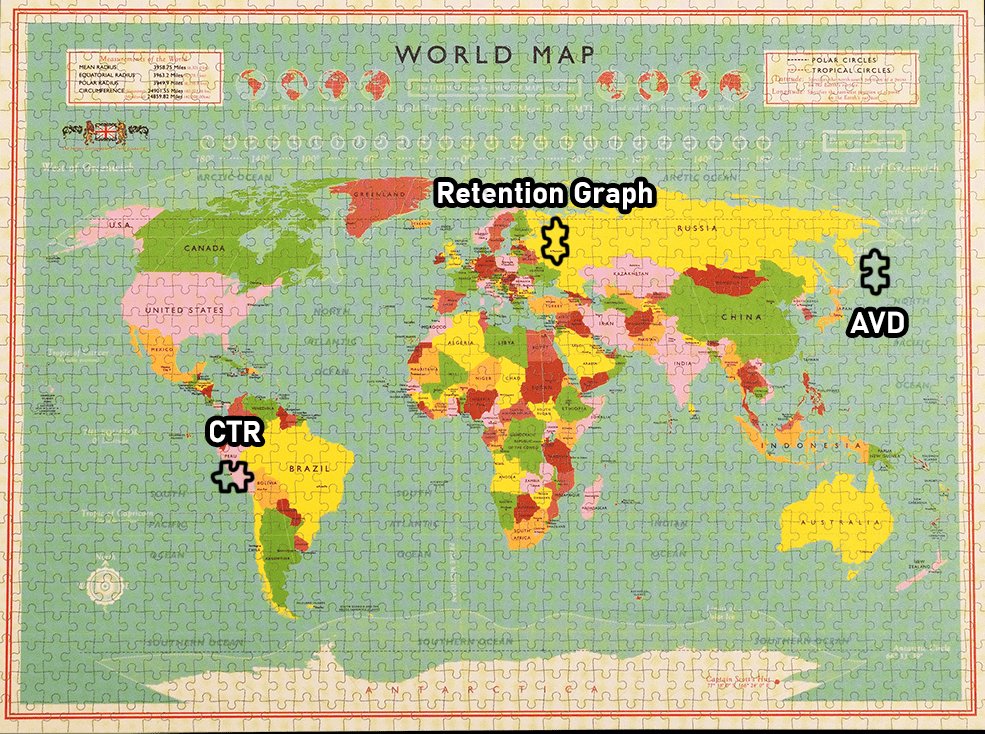
In other words, 2 pieces of a puzzle youtube provide to creators.
43
Since we do not know all the variables youtube look at, we can't prove AVD*CTR is not a spurious correlation.
Even at a 99.9% correlation.
Just like my potato = fish example, it can correlate without being causation (as long as the fishing area is full of fish).
Even at a 99.9% correlation.
Just like my potato = fish example, it can correlate without being causation (as long as the fishing area is full of fish).
44
What is even sadder is:
The correlation between:
• The number of people who drowned by falling into a pool
and
• Films Nicolas Cage appeared in
is 7 times more relevant than AVD*CTR 😂 (correlation speaking, if we occult causation)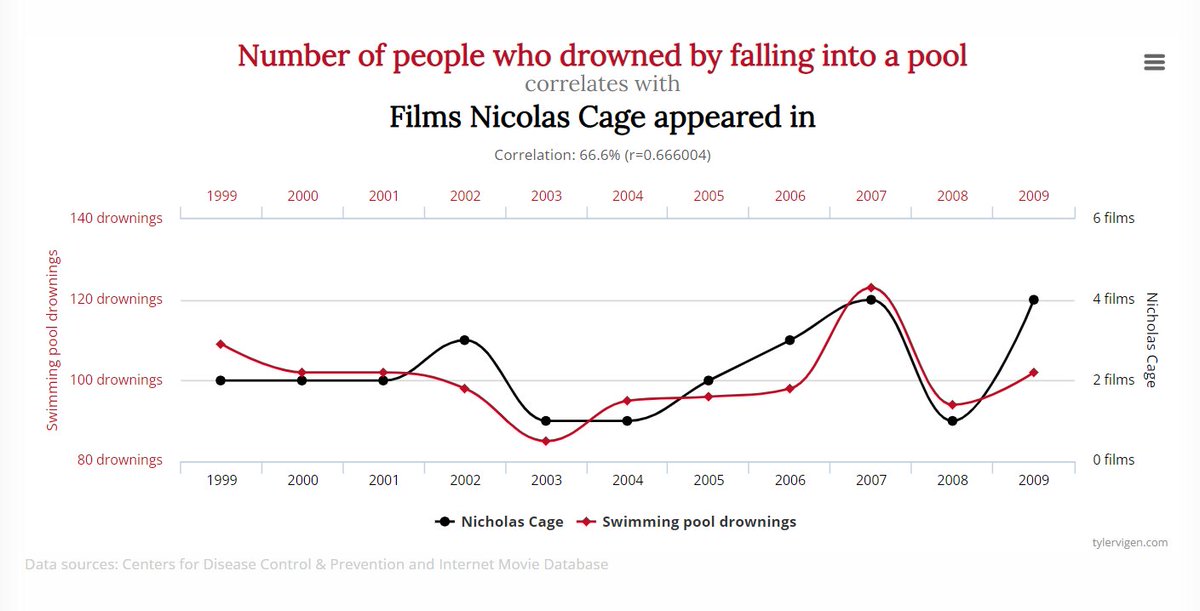
The correlation between:
• The number of people who drowned by falling into a pool
and
• Films Nicolas Cage appeared in
is 7 times more relevant than AVD*CTR 😂 (correlation speaking, if we occult causation)
45
2. Simpson's Paradox
The only information we have about the videos in this data set is:
"2400 videos (gaming niche)"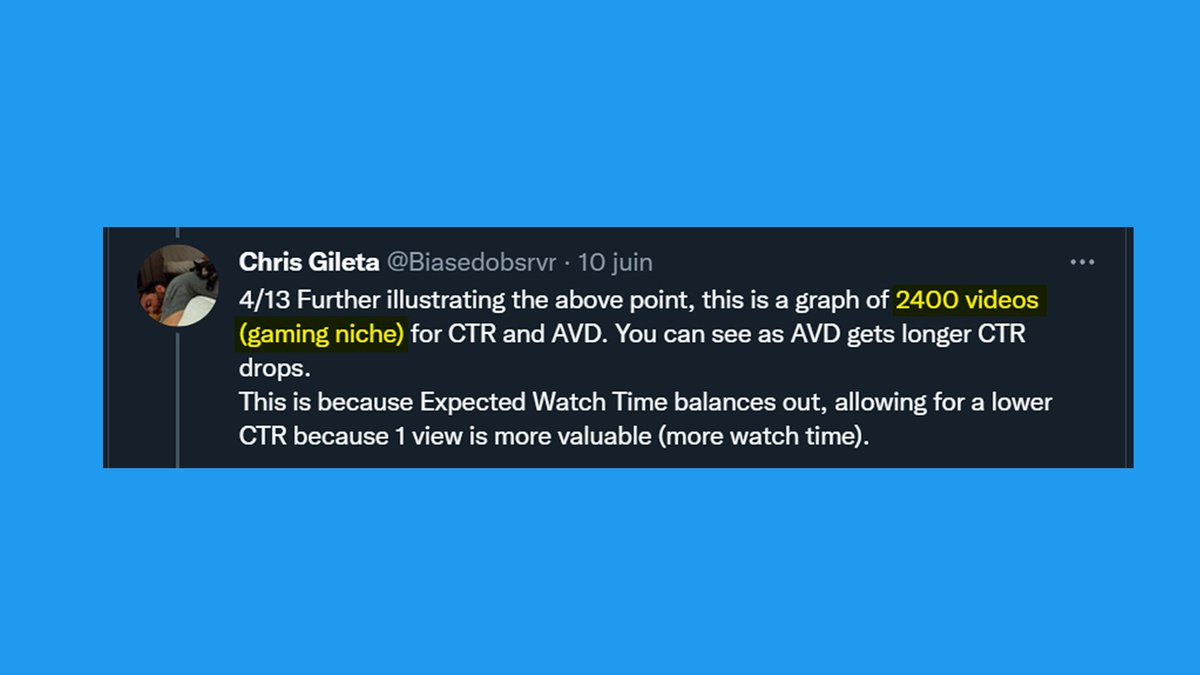
The only information we have about the videos in this data set is:
"2400 videos (gaming niche)"
46
Here is how you can manipulate data with Simpson's Paradox:

47
And in this example, key elements are missing:
• how many channels (and their name)
• how old they are
• how many subs
• how many videos (per channel)
etc..
• how many channels (and their name)
• how old they are
• how many subs
• how many videos (per channel)
etc..
48
If the videos were just selected based on being "gaming" they hold a lot of noise, hiding signals even more.
For instance:
• 100k views with 10 000 000 subs = noise (audience)
• 100k views with 1000 subs = signal (remarkable)
Same number of views, different conclusion.
For instance:
• 100k views with 10 000 000 subs = noise (audience)
• 100k views with 1000 subs = signal (remarkable)
Same number of views, different conclusion.
49
3. Logarithmic view manipulation
I won't go too much into detail here because it would be too technical (not the goal).
It's very visual tho, look at this graph:
• Linear (normal) scale on the left
• Log scale on the right
More info here: badriadhikari.github.io/data-viz-works…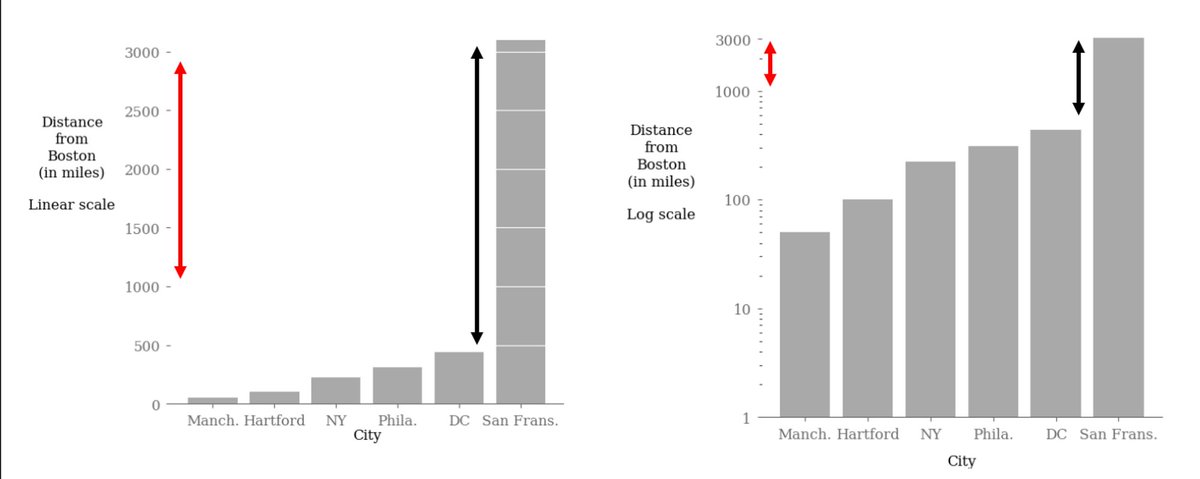
I won't go too much into detail here because it would be too technical (not the goal).
It's very visual tho, look at this graph:
• Linear (normal) scale on the left
• Log scale on the right
More info here: badriadhikari.github.io/data-viz-works…
50
This graph is on a log scale.
This means that on a normal scale, the dots would be way more spread (up and down).
Look at the difference of views between these dots, they are not far away in terms of distance, but the views are 10x higher each time:
This means that on a normal scale, the dots would be way more spread (up and down).
Look at the difference of views between these dots, they are not far away in terms of distance, but the views are 10x higher each time:
51
⚠️ I'm not saying the author did that on purpose to deceive the reader. Again, I have nothing against the author.
The log scale can be useful for many things, especially to read exponentials, but it gives a false sense of high accuracy.
The log scale can be useful for many things, especially to read exponentials, but it gives a false sense of high accuracy.
52
4. Manipulation using averages
Averages are great for many things but can also lead to completely absurd conclusions.
Here is a dead-simple example of an absurd conclusion using average: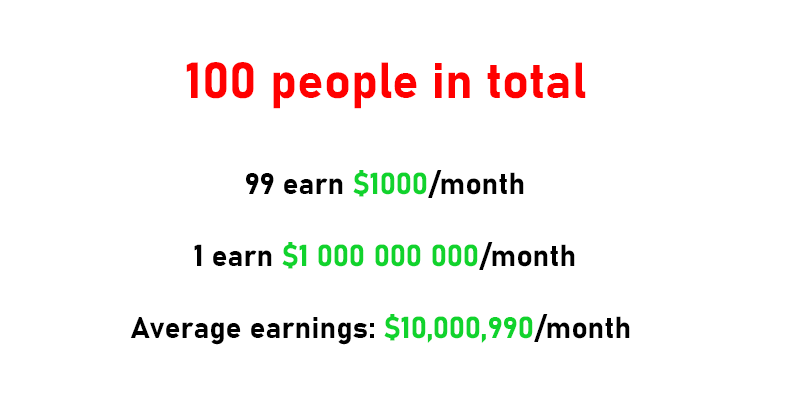
Averages are great for many things but can also lead to completely absurd conclusions.
Here is a dead-simple example of an absurd conclusion using average:
53
That's the problem with averages, they hide variations.
It's fine if you want to study the average, but terrible when you want to study outliers (high performing videos).
In the example above, it only took 1 outlier to completely fuck up the relevancy of the average.
It's fine if you want to study the average, but terrible when you want to study outliers (high performing videos).
In the example above, it only took 1 outlier to completely fuck up the relevancy of the average.
54
In this graph, the average is between ~8k & 80k views.
The problem is, the average carries too much noise (for the reasons I already mentioned).
Again, we want to study outliers, not the average videos on youtube.
The problem is, the average carries too much noise (for the reasons I already mentioned).
Again, we want to study outliers, not the average videos on youtube.
55
And now to nail the coffin here is a graph my associate made and shared with me.
Translation below for non-math people.
Translation below for non-math people.
56
This prediction uses their AVD*CTR model to get a 500k views video.
Red is the area where it predicts more than 500k views, white less than 500k and the red dotted line 500k.
Taking into account the fact that nearly all videos over 5k views on YouTube have a CTR below 20%.
Red is the area where it predicts more than 500k views, white less than 500k and the red dotted line 500k.
Taking into account the fact that nearly all videos over 5k views on YouTube have a CTR below 20%.
57
According to the AVD*CTR model, you need an AVD higher than 35 minutes (2100 secs) to get a video above 500k views.
Conclusion:
👉 Videos under 35 mn with over 500k views on youtube are extremely rare
Alternative conclusion: AVD*CTR is bullshit.
Believe which one you want.
Conclusion:
👉 Videos under 35 mn with over 500k views on youtube are extremely rare
Alternative conclusion: AVD*CTR is bullshit.
Believe which one you want.
58
Now read the yellow highlights again:

59
But it's not over lol.
The author of this thread mentions a paper from Google, and says "Google outlines this", in reference to AVD*CTR = expected watch time per impression.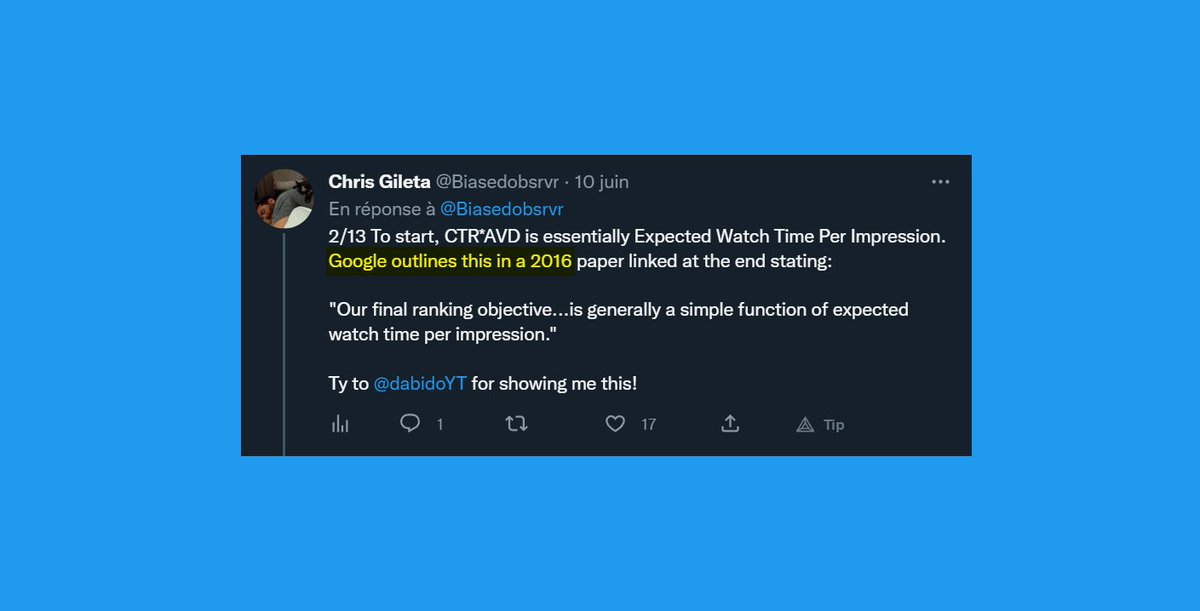
The author of this thread mentions a paper from Google, and says "Google outlines this", in reference to AVD*CTR = expected watch time per impression.
60
So I downloaded it.
And that's not what the paper says at all.
Here is the full context:
• In red is the quote used in the thread (screen above)
• In yellow, the context
And that's not what the paper says at all.
Here is the full context:
• In red is the quote used in the thread (screen above)
• In yellow, the context
61
The paper here says youtube uses two neural networks:
• "candidate generation"
• "ranking"
Or in simple words:
• This is a list of 100 videos this user is likely to like ("candidate generation")
• Ranked from 1 to 100 by "likely-ness" ("ranking")
(100 is arbitrary)
• "candidate generation"
• "ranking"
Or in simple words:
• This is a list of 100 videos this user is likely to like ("candidate generation")
• Ranked from 1 to 100 by "likely-ness" ("ranking")
(100 is arbitrary)
62
For the user. (pic below)
In other words, the paper talks about "ranking per user", because obviously, each user is unique (personal watching patterns and center of interests.)
Saying "Google outlines this" (CTR*AVD = expected watch time per impression) is wrong.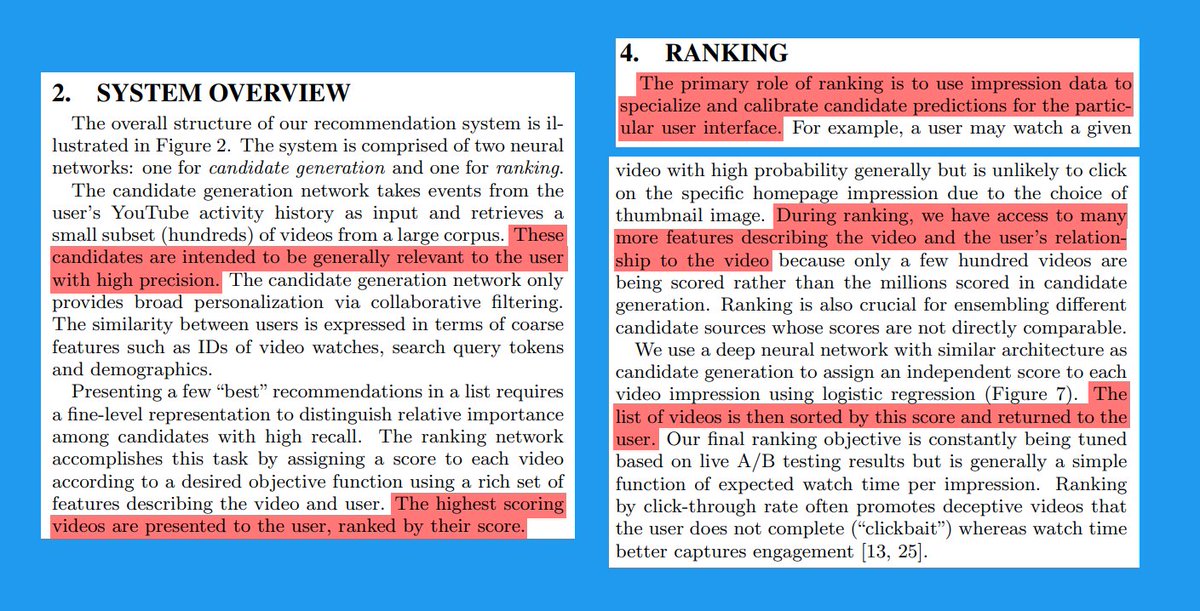
In other words, the paper talks about "ranking per user", because obviously, each user is unique (personal watching patterns and center of interests.)
Saying "Google outlines this" (CTR*AVD = expected watch time per impression) is wrong.
63
There's a difference between:
Expected watch time per impression PER USER (what the paper says)
and
Expected watch time per impression that is GLOBAL, blending all users together
It's explicitely stated in this FAQ about CTR: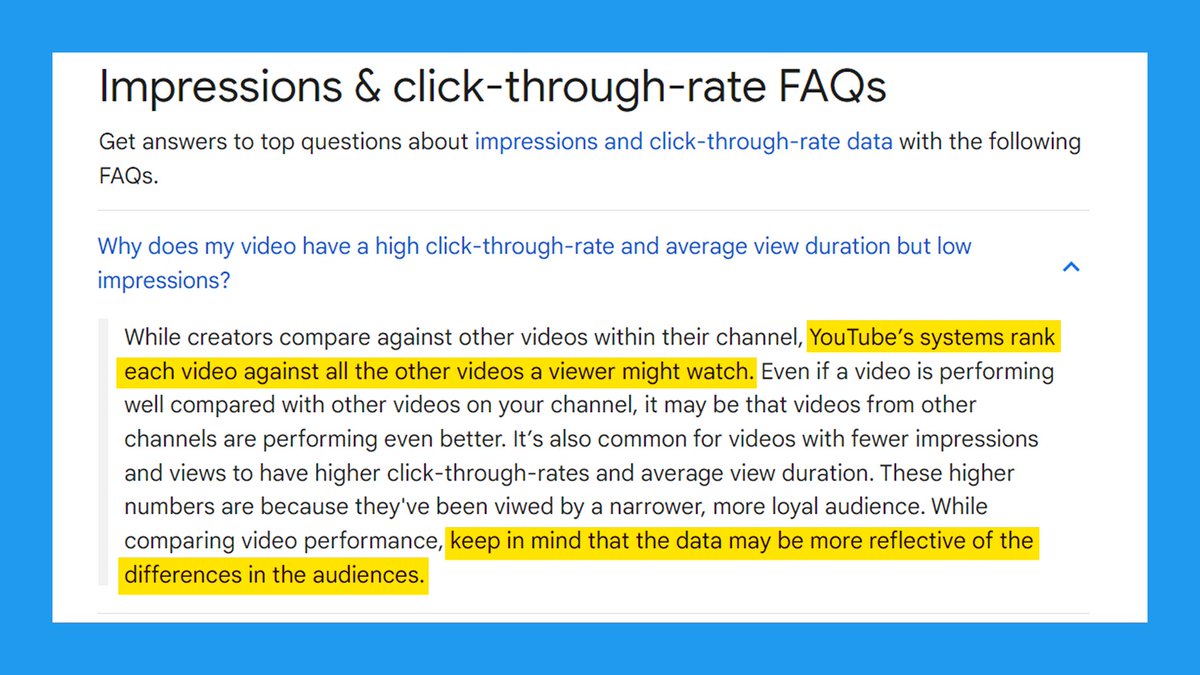
Expected watch time per impression PER USER (what the paper says)
and
Expected watch time per impression that is GLOBAL, blending all users together
It's explicitely stated in this FAQ about CTR:
64
AVD*CTR is an average
of an average (AVD)
multiplied by another average (CTR).
Creating a mega Simpson's paradox resulting in complete nonsense.
of an average (AVD)
multiplied by another average (CTR).
Creating a mega Simpson's paradox resulting in complete nonsense.
65
Not to mention this paper is from 2016 and clearly states that "the final objective is constantly being tuned on live A/B testing."
7 years of live A/B testing and improvement by youtube since then.
lol
7 years of live A/B testing and improvement by youtube since then.
lol
66
Here is a live application on one of my own channels, it's completely random (sorted by most viewed):

67
These clueless youtube "experts" or "strategists" are parroting any piece of information too complex for them that seems true on the theory.
They don't battle-test their claims and hide behind authoritative figures, fooling inexperienced creators.
They don't battle-test their claims and hide behind authoritative figures, fooling inexperienced creators.
68
Now I want to come back to this:

69
When it comes to universal rules, I’m NOT in the data business, I’m in the TRUE vs FALSE business.
I’m not trying to look for trends or correlations, demonstrating that if something is not ALWAYS true, then it’s wrong. Period.
If it’s only true sometimes, it’s wrong PE-RIOD.
I’m not trying to look for trends or correlations, demonstrating that if something is not ALWAYS true, then it’s wrong. Period.
If it’s only true sometimes, it’s wrong PE-RIOD.
70
Yes you can find correlations,
Yes you can find patterns,
but they are called “correlations” and “patterns” for a reason:
they only work in certain contexts with certain parameters.
In other words: they are not universally true.
Yes you can find patterns,
but they are called “correlations” and “patterns” for a reason:
they only work in certain contexts with certain parameters.
In other words: they are not universally true.
71
If the youtube algorithm were perfect, it would be accurate 100% of the time.
But it is constantly being tuned and there still is a lot of room to grow even though it is really impressive right now.
But it is constantly being tuned and there still is a lot of room to grow even though it is really impressive right now.
72
My goal is to help creators understand a highly complex environment by removing as much noise as possible.
My approach is:
Don’t use data that can mislead you, when we have way better alternatives (human psychology/behavior/views).
My approach is:
Don’t use data that can mislead you, when we have way better alternatives (human psychology/behavior/views).
73
3️⃣ Conclusion:
If you're a creator be really careful who you follow.
Just because someone has a lot of followers, no matter the number, doesn't mean he knows what he's doing.
If you're a creator be really careful who you follow.
Just because someone has a lot of followers, no matter the number, doesn't mean he knows what he's doing.
74
A serious youtube expert talks about:
• Battle-tested stuff
• Audience building
• Long-term view
• Talk from experience
A clueless one:
• Obsessed with views
• No skin in the game statements ("the truth is in the middle")
• Theory only
• Data worshipper
• Battle-tested stuff
• Audience building
• Long-term view
• Talk from experience
A clueless one:
• Obsessed with views
• No skin in the game statements ("the truth is in the middle")
• Theory only
• Data worshipper
75
• "I studied <insert famous creator>"
• "why <famous creator> is a genius"
this kind of content doesn't make someone a youtube expert.
Quite the opposite in fact as creators with huge success imply a lot of randomness & luck that is impossible to replicate.
• "why <famous creator> is a genius"
this kind of content doesn't make someone a youtube expert.
Quite the opposite in fact as creators with huge success imply a lot of randomness & luck that is impossible to replicate.
76
"I studied {x} super successful creator" is the same as "I studied this lottery winner" (when it comes to understand success).
Study outliers to find a correlation AND a causation between them, not to replicate them.
Study what works at scale when it comes to replicate.
Study outliers to find a correlation AND a causation between them, not to replicate them.
Study what works at scale when it comes to replicate.
77
Data and metrics are great for hiding incompetence, you can tell the story you want with data and sound smart.
Except for views (high signal), I almost never look at any metric because they are not lindy (relevance proven through time), inaccurate and full of noise.
Except for views (high signal), I almost never look at any metric because they are not lindy (relevance proven through time), inaccurate and full of noise.
78
Yet I survived 12 years on YouTube and counting, I still upload daily on YouTube and I'm still building audiences on YouTube today.
79
Now PSA to the yt gurus willing to play status games:
Remember it's a zero sum game.
Attack me, I will be ruthless and expose your incompetence publicly.
I don't care who you are, or how many followers you have.
My fundamentals are solid, everything I share is battle tested.
Remember it's a zero sum game.
Attack me, I will be ruthless and expose your incompetence publicly.
I don't care who you are, or how many followers you have.
My fundamentals are solid, everything I share is battle tested.
80
Consultant is not my main job, I'm not on twitter to find clients, my businesses are doing fine.
This twitter account is not my life, I have nothing to lose.
This twitter account is not my life, I have nothing to lose.
81
I will keep saying the truth to creators, doesn't matter if it intersects with your incompetence and what you previously posted.
I will never quote names, I fight ideas not people but if you try to fight me, good luck to you.
I will never quote names, I fight ideas not people but if you try to fight me, good luck to you.
82
Now to conclude this thread:
AVD*CTR = 9.6% correlation
People who drowned after falling out of a fishing boats & Marriate rate in Kentucky= 87% correlation
Thanks for coming to my Ted Talk.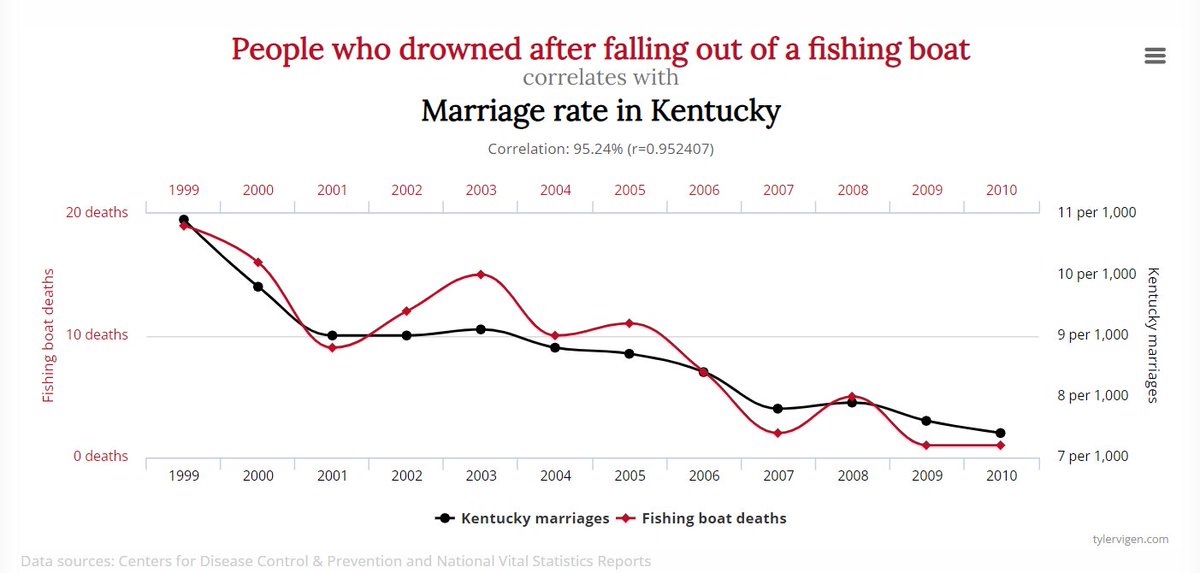
AVD*CTR = 9.6% correlation
People who drowned after falling out of a fishing boats & Marriate rate in Kentucky= 87% correlation
Thanks for coming to my Ted Talk.
83
95%* typo

