How to use Claude Motion & Claude Dashboards (from beginner to pro):

Claude gets an update; industries die.

Once something hard becomes a commodity, no one pays for it.
I wish I were exaggerating.
But more than half of the companies that hired freelancers in 2022 have stopped (Ramp report). Completely.
And when Washington University researchers studied freelancers right after ChatGPT came out, the most skilled lost more, not less.
The same is happening to data analysts & motion designers.
On October 8, Claude announced both, for $20 / month, in one post:
11 million views in 5 days.
Claude is showing us what’s next:
This newsletter is a how-to for both.
By the end, you will know:
Two things before we start:
I - How to access it.
Read this before you get excited:
On Team, both are on by default. On Enterprise, an owner must turn them on:
→ Organization settings → Artifacts.
Nothing shows up? Check one switch: Cloud code execution and file creation. On Pro & Max, it’s in Settings → Capabilities. On Team & Enterprise, an owner turns it on in Organization settings → Capabilities. Both features need it.
And it uses your plan’s usage limits. Longer animations eat more of it.
Now do the math. A 2-seat Claude Team plan costs $480 a year ($20 a seat per month, billed yearly). The average studio quote would pay for 18 years of it.
II - Claude Motion.
Step 1: Type /motion.
Type /motion and prompt it.


Step 2: Say who, where & how long.
Anthropic’s own tip: “Say who will watch it, where it will play, and roughly how long it should be.”
And attach your documents. The report. The data. Your logo. Your screenshots. Claude animates what you give it. It should never be the source of your facts. Unless you want it to hallucinate.
Copy & paste this:
/motion Turn [THIS REPORT / THESE NOTES / THIS CHART] into a [20]-second explainer.
Who will watch it: [YOUR AUDIENCE].
Where it will play: [ALL-HANDS SCREEN / LINKEDIN / A SALES CALL].
The one thing they must remember: [ONE SENTENCE].
Use my [LOGO / SCREENSHOTS / BRAND COLORS], attached.
One idea per scene. Few words on screen.
End on: [YOUR LAST LINE].
Here’s an example for a launch post:
/motion Turn the announcement below into a 20-second launch video.
Who will watch it: CEOs & COOs of mid-sized U.S. companies whose AI pilot never became a habit, scrolling Linkedin on their phone.
Where it will play: in the Linkedin feed, muted. 4:5 (1080 × 1350). Every point must read as words on screen. Keep text away from the edges.
The one thing they must remember: 10,933 hours saved at Athlete's Thread. Give it its own scene & count the hours up.
Use only what's in the announcement. No made-up numbers, quotes, clients or logos.
Use our logo & fonts, attached: FS Kim for headlines, GT America for text. Colors: cream #FAF5EE, ink #232424, red #F94E2A & light yellow #FEEC97, no others.
3 or 4 scenes. One idea per scene. Max 8 words on screen at a time.
The first frame must already show the gpc logo & "Your AI pilot stayed a pilot." It's the thumbnail.
End on: "Book a 30-minute call: gpc.consulting". Hold it 3 seconds.
Announcement: "You thought your team could adopt AI on its own. Nobody can. The pilot worked out. But it stayed a pilot. We're GPC. We train your team, make sure they adopt AI, deploy the workflows that matter, and maintain them. Athlete's Thread saved 10,933 hours, generated 90,376 assets and avoided 3 hires. Give us 30 minutes and we will map where your adoption stopped. Book a call at gpc.consulting."
Step 3: Answer 3 questions.
Claude asks you up to 3 things before it starts (it skips what your prompt already says):
Pick, hit Continue. Then wait.
Step 4: Fix it with comments.
This is my favorite part.
Click a moment on the timeline. Comment like you would on a Google Doc:

Your team can comment too. Every comment sits on the timeline, exactly where it belongs:

Step 5: Export.
Click Export → MP4.
It even comes with its own music. (It starts muted in the player: click the speaker.) No voiceover, though.
Want to go further? Open it in Adobe, Descript, HeyGen, Higgsfield, invideo, Luma AI or Runway. Canva & Captions are coming.

💡 Pro tip #1: Ask for the storyboard first. “Before you animate, give me the storyboard, scene by scene.” You fix the story in text (cheap) before Claude animates it (slow and expensive).
💡 Pro tip #2: Too fast? Too much text? It’s the most common complaint about the films. Ask for fewer words & more seconds. “One idea per scene. Max 8 words on screen.”
💡 Pro tip #3: For Tiktok or Reels, ask for vertical (1080 × 1920). Claude makes a second film, recomposed. Not a crop.
It won’t recreate another company’s logo or app screens (unless you work there), or the tune of an existing song. Obvious copyright infringement.
III - Claude Dashboards.
Step 1: Bring your data.
Two ways:
→ Connect a data tool. BigQuery, Snowflake, Databricks, Amazon Redshift, ClickHouse. Or an app you already connected, like Salesforce.
→ Or just attach a file. No data warehouse? Export your spreadsheet as a CSV & drop it in the chat. Claude takes a snapshot of it. So it won’t update by itself.
Step 2: Ask a question. Not for a chart.
This is the #1 mistake. Anthropic’s own tip: “Say what you want to know, not just what to chart.”
❌ “A signups chart.”
✅ “How do this month’s signups by channel compare with last month’s?”
Their launch example says it all. One problem, two sentences:

As I keep telling you: the simplest prompts are the best.
Goal + Context + If you need more, ask me questions.
And example of a copy & paste prompt:
Make a dashboard from [THIS FILE / MY DATA SOURCE].
I need to decide [THE DECISION YOU HAVE TO MAKE].
Put the 3 numbers that matter most at the top, each compared with last [WEEK / MONTH].
Then show me why: break them down by [CHANNEL / TEAM / PRODUCT / REGION].
Add a filter for [DATE / REGION].
Tell me every assumption you made. Ask questions before if needed.
Step 3: Click any number.
Every chart shows the query behind it & when its data was last refreshed.
Click → you see exactly what Claude counted. Kind of like how Excel works (and you see the formula behind it).

Step 4: Change it by asking.
“Add a filter for region.”
“Change this to a weekly view.”
“Add a table I can sort.”
Step 5: Share it.
Dashboards start private. Click Share (top right).

IV - Combine it.
There was a trick during Claude’s launch video: Dashboards & Motion can talk to each other.
Open any dashboard. Comment on a chart. Ask for an animation:

Here’s their full comment. Steal it:
@Claude turn this into an animation for our all-hands. The whole company is watching so keep it simple: [THE ONE POINT], and [THE ONE NUMBER].
The audience. The venue. Two facts. A chart Claude already understands.
Claude came back with a 38-second film:

Before: An analyst builds the chart. A designer animates it. Days. Often weeks.
Today: One comment.
V - How pros use it (Claude Code).
You can stop the newsletter here.
If you are still here, let’s forget “beginner” for a minute.
I don’t build these in the chat. I build them from Claude Code. (And no, I still don’t know how to code.)
Why? Claude Code lives on your computer. It reads your folders, your messy exports, your files. And it can now publish a Dashboard or a Motion film straight into your Claude account. (Claude Code = the Code tab in the Claude desktop app.)
My test. One request in Claude Code:
Pull every newsletter from my Substack archive. Build a Claude dashboard: likes, comments & restacks per issue, by topic (Claude vs ChatGPT vs the rest) and free vs paid. Then turn the main finding into a 20-second Motion film, in my brand.
It pulled my last 123 newsletters (May 2025 to October 2026), cleaned them into one file, built the dashboard, then the film. Both landed in my Claude account.


My own lesson: Claude issues get 4× the likes of ChatGPT ones. (To be fair: 23 of my 26 ChatGPT issues ran in 2025, when this newsletter was much smaller. The dashboard says so too.)
3 workflows to copy, straight into Claude Code:
Pro 1: The messy folder → a dashboard.
Read every file in [FOLDER] (CSV, Excel, exports). Clean & merge them into one table. Then build a Claude dashboard that answers: [YOUR QUESTION]. Every number must come from the data. Before you build, reconcile: every breakdown must add up to its total. Tell me what you assumed.
Pro 2: Your real product → a walkthrough film.
Motion recreates your app much better from its code than from screenshots. And Claude Code can read the code.
Open [MY APP'S FOLDER]. Make a 45-second Motion walkthrough of [FEATURE] for new customers. Recreate the screens from the real code: real labels, our colors, our fonts. Show the cursor clicking. End on [YOUR CALL TO ACTION].
Pro 3: Dashboard → film, in one go.
Take the dashboard you just built. Turn its main finding into a 20-second Motion film for LinkedIn, vertical. Our brand colors. One number on screen at a time.
I know, it’s not rocket science. But don’t bet against how this technology evolves. Master it today, and grow with it, instead of fighting it. This is how to keep an edge.
Where to start.
You can’t master this in one day.
Instead, book 30 minutes this week & open this newsletter:
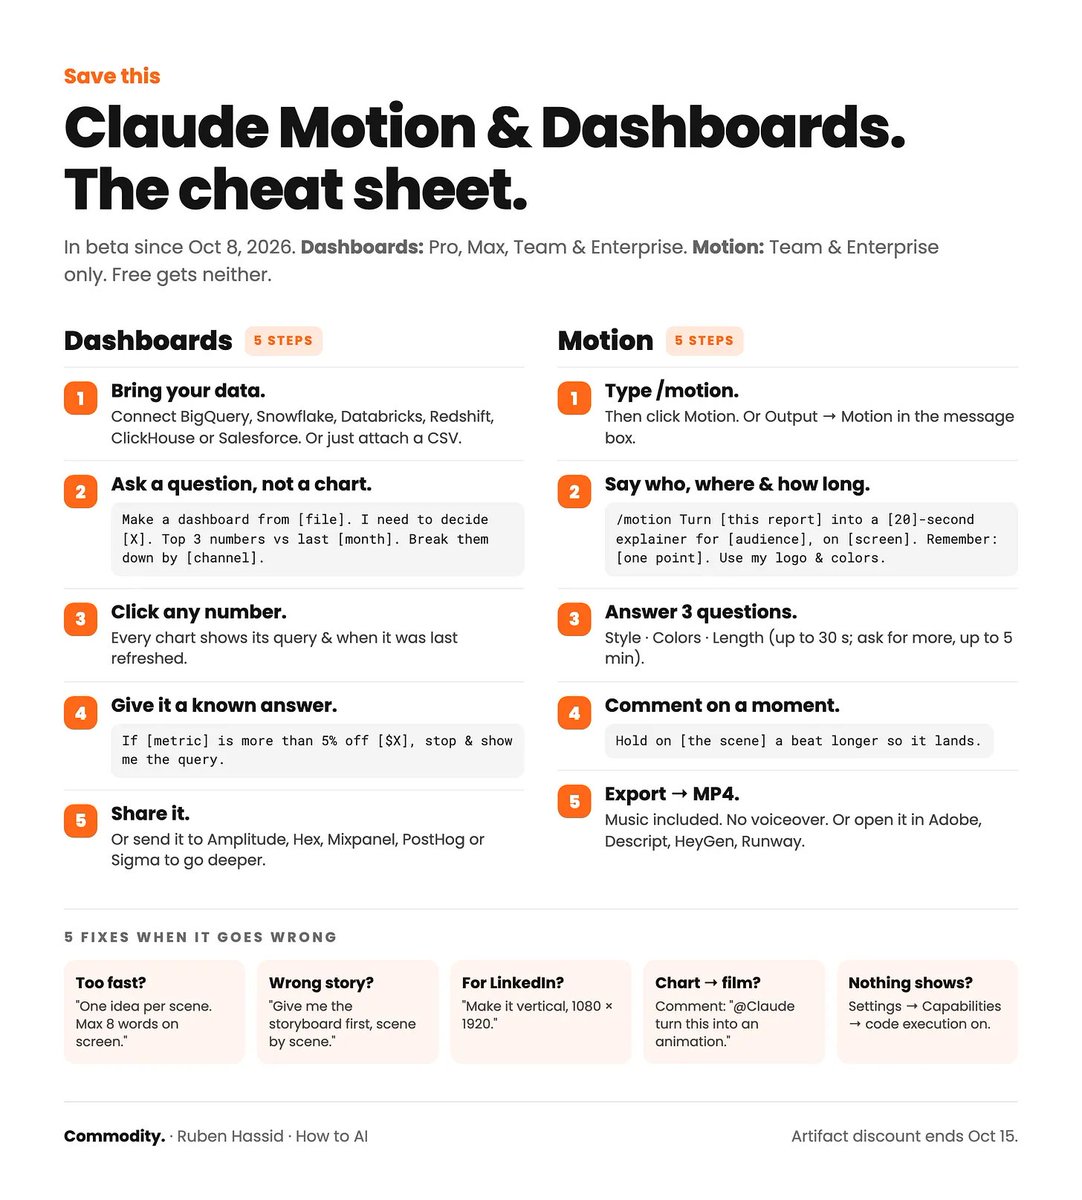
I made a quick cheat sheet:
Look, you pay Claude $100 a month. $1,200 a year.
But you use a fraction of it. Not because Claude is hard. Because nobody showed you how. There is no manual or instructions. And the tool changes every week.
I could tell you Claude is very hard. It’s not.
I could charge $200 per class. I won’t.
You need 46 minutes:
→ 23 minutes to go from zero to 80%. My Monday workshop, “AI 101”. We go through the entire UI of Claude, live. Every tab. Every button. Every setting from this guide.
→ 23 minutes to go from 80% to 95%. Our “AI 201” class. Claude Code, connected to GitHub, Vercel and your other apps.
Both are live, every single week. Both are recorded.
Both are in my paid subscription: $200 a year. $17 a month.
Less than a fifth of what you pay Claude. To get all $5,725 out of it.
Upgrade today. Save your seat for next week’s live session: how-to-ai.guide
I am not paid by Claude to write this. I don’t pick sides. I’m sharing, twice a week, how my work is changing (very fast) with AI. ‘How to AI’ went from 56,000 to 971,000 readers in a year. And we intend to do EVEN LESS in 2027.
Yes, less.
You don’t need more noise. You don’t need more news. You don’t need endless streams of “we are all going to die” or “we will be replaced”. We focus on the practical side of AI here. How to do things. How to AI.
Humanly yours, Ruben.
