1/6 Are Banks Having a Liquidity Problem? tl:dr, Liquidity in the...

Jim Bianco@biancoresearch
47 views
Oct 20, 2025
~7 min read
Advertisement
1
1/6
Are Banks Having a Liquidity Problem?
tl:dr, Liquidity in the plumbing of the financial system is getting scarce. It is not a crisis now, but it has been moving in this direction for weeks, and it is now at a worrisome point.
When the financial plumbing gets stressed, it is when bad loans (aka "cockroaches") get noticed.
(long thread, tried to write it so "normies" can follow.)
---
Wall Street is famous for diagnosing symptoms, not causes. I believe they are doing this again with the banking issues of the last few days., I do not think this is a "cockroach" problem (bad credit/loans) waiting to get disclosed publicly.
It is a liquidity problem that makes the "cockroaches" matter.
Banks (all 4,000+) hand out a trillion in loans. So, they will always have "cockroaches." So, it is not an issue of whether cockroaches exist; they always do. Instead, it is the environment in which such disclosures are made. Does the market care or not?
Now it cares. Why?
---
@NickTimiraos said below:
How to define "temporary" and "modest." Repo rates in the last two days have moved up to the top of the fed-funds range and around 10 bps above IORB, but it's only been two days.
---
I would argue it has not "only" been two days; worsening liquidity in the funding market has been unfolding for weeks. It just got noticed in the last two days.
This chart shows Secured Overnight Financing Rate, or SOFR (orange), and Interest on Reserves, or IOR (blue). The bottom panel shows the spread between these two, along with some metrics (dashed line = average, shaded area = standard deviation range).
See the arrow; this spread (3-day average, so it is less noisy) has been tightening for weeks. This spread moved to positive territory in early September and has remained there for weeks. The last time it was positive for this long was in March 2020 (not shown).


Are Banks Having a Liquidity Problem?
tl:dr, Liquidity in the plumbing of the financial system is getting scarce. It is not a crisis now, but it has been moving in this direction for weeks, and it is now at a worrisome point.
When the financial plumbing gets stressed, it is when bad loans (aka "cockroaches") get noticed.
(long thread, tried to write it so "normies" can follow.)
---
Wall Street is famous for diagnosing symptoms, not causes. I believe they are doing this again with the banking issues of the last few days., I do not think this is a "cockroach" problem (bad credit/loans) waiting to get disclosed publicly.
It is a liquidity problem that makes the "cockroaches" matter.
Banks (all 4,000+) hand out a trillion in loans. So, they will always have "cockroaches." So, it is not an issue of whether cockroaches exist; they always do. Instead, it is the environment in which such disclosures are made. Does the market care or not?
Now it cares. Why?
---
@NickTimiraos said below:
How to define "temporary" and "modest." Repo rates in the last two days have moved up to the top of the fed-funds range and around 10 bps above IORB, but it's only been two days.
---
I would argue it has not "only" been two days; worsening liquidity in the funding market has been unfolding for weeks. It just got noticed in the last two days.
This chart shows Secured Overnight Financing Rate, or SOFR (orange), and Interest on Reserves, or IOR (blue). The bottom panel shows the spread between these two, along with some metrics (dashed line = average, shaded area = standard deviation range).
See the arrow; this spread (3-day average, so it is less noisy) has been tightening for weeks. This spread moved to positive territory in early September and has remained there for weeks. The last time it was positive for this long was in March 2020 (not shown).
Nick Timiraos@NickTimiraos
Follow up question from me: How to define "temporary" and "modest." Repo rates in the last two days have moved up to the top of the fed-funds range and around 10 bps above IORB, but it's only been two days. Before that, repo rates were running slightly below IORB.
Again, here is Logan in late August: "In the U.S., repo rates have averaged about 8 basis points below interest on reserves in recent months. That tells me we have more room to reduce reserves. We could see some temporary pressure around the tax date and quarter-end in September. I was encouraged to see market participants using the SRF over the June quarter-end, and I anticipate they will similarly use our ceiling tools if necessary in September. That will allow us to continue gradually bringing reserves to a more efficient level with market rates close to, but perhaps slightly below, interest on reserves on average over time."
Again, here is Logan in late August: "In the U.S., repo rates have averaged about 8 basis points below interest on reserves in recent months. That tells me we have more room to reduce reserves. We could see some temporary pressure around the tax date and quarter-end in September. I was encouraged to see market participants using the SRF over the June quarter-end, and I anticipate they will similarly use our ceiling tools if necessary in September. That will allow us to continue gradually bringing reserves to a more efficient level with market rates close to, but perhaps slightly below, interest on reserves on average over time."
2
2/6
A positive spread is typical around month- and quarter-end "window dressing," when financial institutions need to report their positions and want to show conservative cash positions. Now it has been weeks, and it is in the middle of the month.
This chart shows that liquidity has been worsening for weeks. It was two days ago that it finally got noticed.
But note that Jay Powell noticed it, because in his speech to the NABE Conference three days ago:
Some signs have begun to emerge that liquidity conditions are gradually tightening, including a general firming of repo rates along with more noticeable but temporary pressures on selected dates.
SOFR replaced Libor (London InterBank Offer Rate) two years ago; it is the rate charged in the funding markets (that is, financial institutions that need cash and will borrow to get iInterbank Offer Rate) two years ago; it is the rate charged in the funding markets (that is, financial institutions that need cash and will borrow to get it) for overnight loans collateralized by Treasury Bills) on overnight loans collateralized by Treasury Bill ("Secured"). So these loans carry no credit risk. They are compared to the IOR rate, which is the interest rate the Federal Reserve pays banks on their reserve balances. This means that the spread between SOFR and IOR is purely driven by supply and demand. SOFR comprises three components.
* General Collateral repo Loans
* Tri-party repo (biggest part)
* Fixed Income Clearing Corporation (FICC) cleared bilateral repo
As the bottom panel shows, the SOFR market is now $3 trillion of overnight loans a day. It has doubled in the last two years.
The SOFR market has never been bigger (strong demand), and spreads are moving higher (insufficient supply).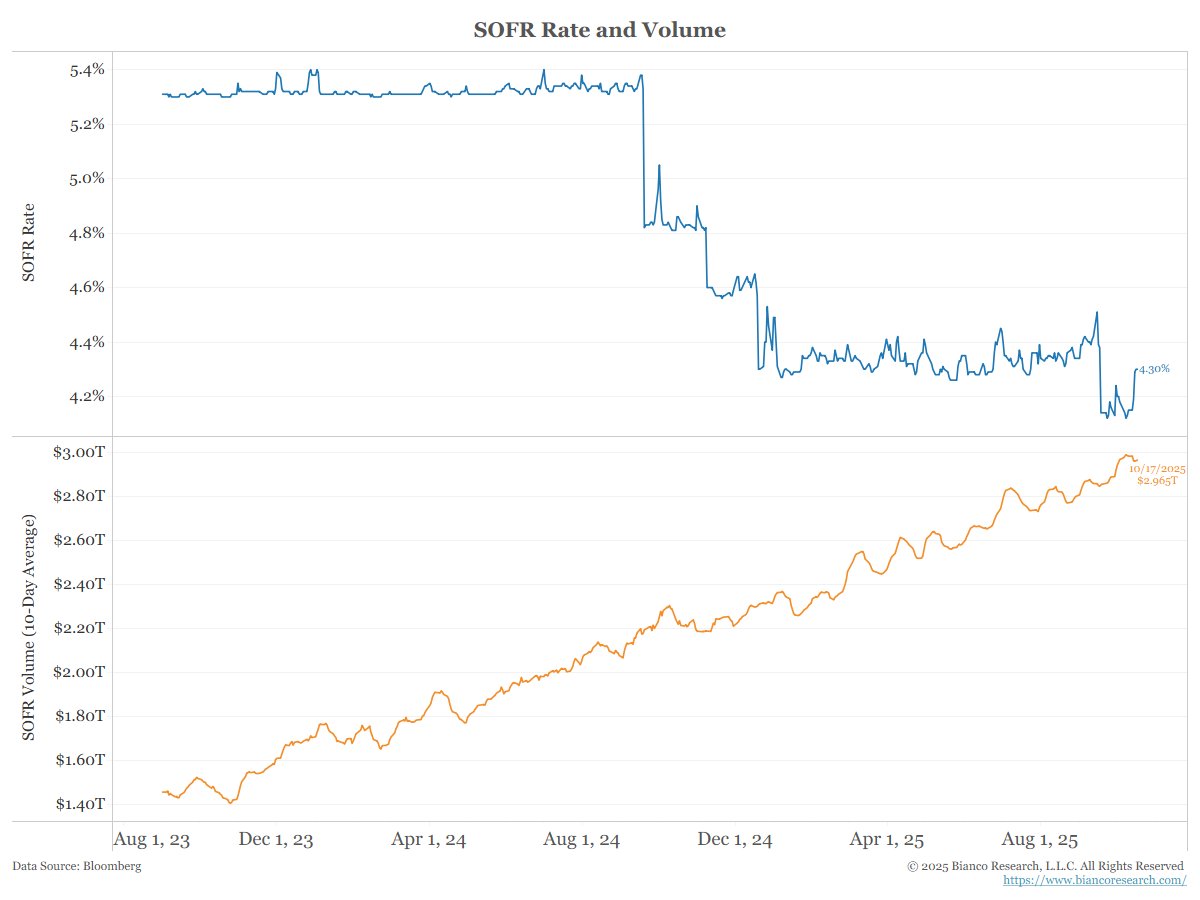
A positive spread is typical around month- and quarter-end "window dressing," when financial institutions need to report their positions and want to show conservative cash positions. Now it has been weeks, and it is in the middle of the month.
This chart shows that liquidity has been worsening for weeks. It was two days ago that it finally got noticed.
But note that Jay Powell noticed it, because in his speech to the NABE Conference three days ago:
Some signs have begun to emerge that liquidity conditions are gradually tightening, including a general firming of repo rates along with more noticeable but temporary pressures on selected dates.
SOFR replaced Libor (London InterBank Offer Rate) two years ago; it is the rate charged in the funding markets (that is, financial institutions that need cash and will borrow to get iInterbank Offer Rate) two years ago; it is the rate charged in the funding markets (that is, financial institutions that need cash and will borrow to get it) for overnight loans collateralized by Treasury Bills) on overnight loans collateralized by Treasury Bill ("Secured"). So these loans carry no credit risk. They are compared to the IOR rate, which is the interest rate the Federal Reserve pays banks on their reserve balances. This means that the spread between SOFR and IOR is purely driven by supply and demand. SOFR comprises three components.
* General Collateral repo Loans
* Tri-party repo (biggest part)
* Fixed Income Clearing Corporation (FICC) cleared bilateral repo
As the bottom panel shows, the SOFR market is now $3 trillion of overnight loans a day. It has doubled in the last two years.
The SOFR market has never been bigger (strong demand), and spreads are moving higher (insufficient supply).
3
3/6
In a normal SOFR market, when the balance between supply/demand is maintained, SOFR loans should trade at a slight discount to IOR rates (see the average and standard deviation range in the bottom panel of the spread chart in the first post). This is because IOR should act as a ceiling on money rates. Banks will not lend out below the IOR rate. Why should they when parking money (reserves) at the Fed offers a better rate?
In a normal market, non-bank (broker/dealers, money market funds, and Government-Sponsored Enterprises, or GSEs, etc.) with money to lend, who cannot park it at the Fed to get IOR rates, will offer it at slightly lower than the IOR rate to anyone that needs cash (to settle trades, needs to put up margin on derivatives, or money for other transactions). They will offer a better deal than IOR, so they do not have to compete with banks for interest on their cash.
Typically, eight basis points below IOR will do it (as the bottom panel shows in the first post), which is the same spread Dallas Fed President Lorie Logan noted in Timiroas' tweet above. Note that before the Dallas Fed, Logan ran the NY Fed Open Market Desk.)
In other words, a negative spread indicates that funding markets are "liquid" and functioning normally. Conversely, an uptrend in the SOFR/IOR spread, which tips to a positive spread, indicates that the supply of cash (aka liquidity) is falling behind the demand for money. So the price (rate) is rising relative to the IOR benchmark.
Restated, liquidity in the plumbing of the financial system is getting scarce. It is not a crisis now, but it has been moving in this direction for weeks, and it is now at a worrisome point.
Remember, financial institutions are highly leveraged; these seemingly little moves can have a significant impact on the P&L and capital ratios.
Why Now?
Why is this happening now? And why should we believe the uptrend in SOFR/IOR will not stop its two-month uptrend?
The answer to the first question is Quantitative Tightening (QT). This is the Fed pulling out liquidity since 2022 by reducing its balance sheet.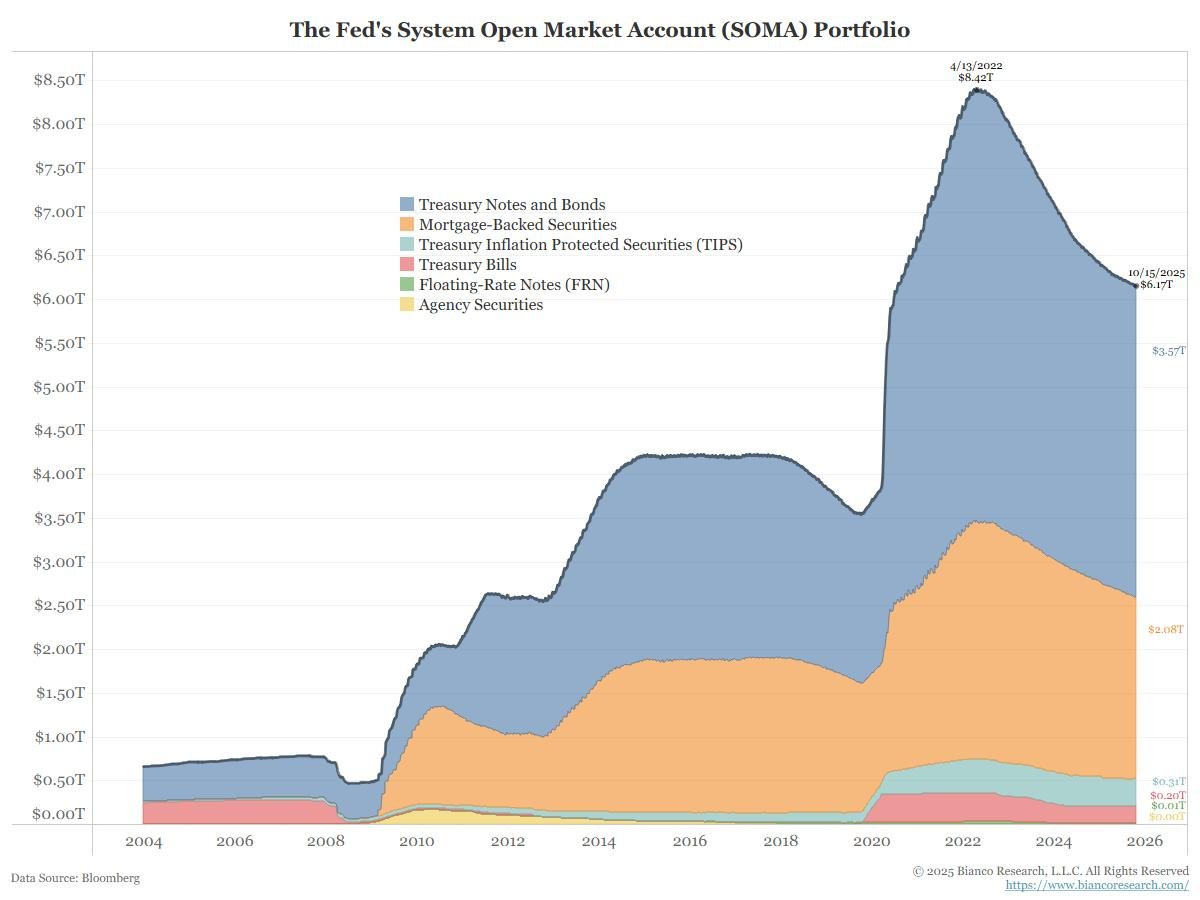
In a normal SOFR market, when the balance between supply/demand is maintained, SOFR loans should trade at a slight discount to IOR rates (see the average and standard deviation range in the bottom panel of the spread chart in the first post). This is because IOR should act as a ceiling on money rates. Banks will not lend out below the IOR rate. Why should they when parking money (reserves) at the Fed offers a better rate?
In a normal market, non-bank (broker/dealers, money market funds, and Government-Sponsored Enterprises, or GSEs, etc.) with money to lend, who cannot park it at the Fed to get IOR rates, will offer it at slightly lower than the IOR rate to anyone that needs cash (to settle trades, needs to put up margin on derivatives, or money for other transactions). They will offer a better deal than IOR, so they do not have to compete with banks for interest on their cash.
Typically, eight basis points below IOR will do it (as the bottom panel shows in the first post), which is the same spread Dallas Fed President Lorie Logan noted in Timiroas' tweet above. Note that before the Dallas Fed, Logan ran the NY Fed Open Market Desk.)
In other words, a negative spread indicates that funding markets are "liquid" and functioning normally. Conversely, an uptrend in the SOFR/IOR spread, which tips to a positive spread, indicates that the supply of cash (aka liquidity) is falling behind the demand for money. So the price (rate) is rising relative to the IOR benchmark.
Restated, liquidity in the plumbing of the financial system is getting scarce. It is not a crisis now, but it has been moving in this direction for weeks, and it is now at a worrisome point.
Remember, financial institutions are highly leveraged; these seemingly little moves can have a significant impact on the P&L and capital ratios.
Why Now?
Why is this happening now? And why should we believe the uptrend in SOFR/IOR will not stop its two-month uptrend?
The answer to the first question is Quantitative Tightening (QT). This is the Fed pulling out liquidity since 2022 by reducing its balance sheet.
4
4/6
Cash being parked in the New York Fed Reverse Repo Facility ( RRP) sink almost every day is now nearing zero. And, as the arrow below shows, it has really started diving toward zero several weeks ago.
The RRP is about ten years old. This facility allowed market participants to park cash at the New York Federal Reserve in exchange for competitive interest rates. That rate is currently set 25 basis points below the top end of the Federal Reserve’s target rate. Today, the target range is 4.00% to 4.25%, so the RRP rate is 4.00%.
The purpose of this facility is to drain excess funds from the financial system (that is, remove liquidity). When money is parked at the Fed, it cannot be re-lent, a process known as rehypothecation, thereby reducing liquidity in the financial system.
When RRP is declining, these funds are reintroduced into the financial system, thereby adding liquidity. When the facility’s usage hits zero, as it essentially has, then this “liquidity pump” has run dry.
Cash being parked in the New York Fed Reverse Repo Facility ( RRP) sink almost every day is now nearing zero. And, as the arrow below shows, it has really started diving toward zero several weeks ago.
The RRP is about ten years old. This facility allowed market participants to park cash at the New York Federal Reserve in exchange for competitive interest rates. That rate is currently set 25 basis points below the top end of the Federal Reserve’s target rate. Today, the target range is 4.00% to 4.25%, so the RRP rate is 4.00%.
The purpose of this facility is to drain excess funds from the financial system (that is, remove liquidity). When money is parked at the Fed, it cannot be re-lent, a process known as rehypothecation, thereby reducing liquidity in the financial system.
When RRP is declining, these funds are reintroduced into the financial system, thereby adding liquidity. When the facility’s usage hits zero, as it essentially has, then this “liquidity pump” has run dry.
5
5/6
Will the SOFR/IOR Spread Peak Now?
The simple answer is yes, if the drain of cash stops now. But it is not clear how this happens.
Since RRP is at zero, it can no longer "pump" liquidity. So, the Fed has to stop QT? I suspect they will do exactly this at the October 29 FOMC meeting, announcing QTs will stop at year's end. (so two more months of QT). They may also reduce the amount of QT (currently at $40 billion/month).
Will It Be Enough?
There is an old saying that the Fed keeps hiking until something breaks. When the Fed starts hiking rates, they really do not know when to stop. They often keep going until they go too far. The most recent example of this was the wave of bank failures triggered by soaring interest rates. Silicon Valley Bank imploded in the spring of 2023.
The 2025 corollary is that the Fed continues QT (Quantitative Tightening) until something breaks. In other words, the Fed reduces its balance sheet too far and/or too fast.
Is QE The Fix?
Right now, many are screaming that the fix is for the Fed to “print” or Quantitative Easing (QE), thus adding liquidity. This was the answer to all such problems before 2022.
The problem now is an unacceptably high inflation rate (see the dotted line below). Core CPI inflation is still stuck above 3% five years after the COVID lockdowns and, in my opinion, is accelerating.
In such an environment, “printing” (QE) could cause markets to fear inflation, trigger a sell-off (if not a collapse) in the bond market, and worsen the situation.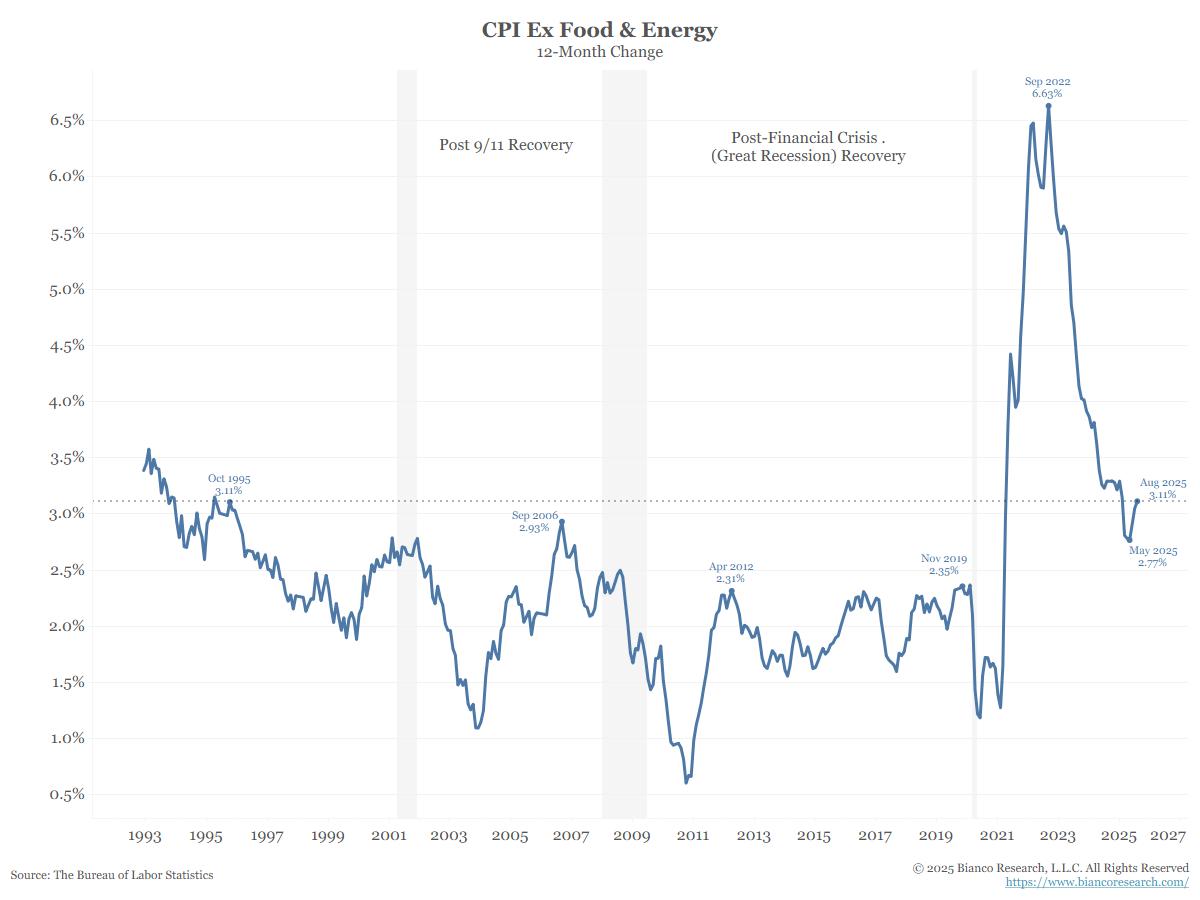
Will the SOFR/IOR Spread Peak Now?
The simple answer is yes, if the drain of cash stops now. But it is not clear how this happens.
Since RRP is at zero, it can no longer "pump" liquidity. So, the Fed has to stop QT? I suspect they will do exactly this at the October 29 FOMC meeting, announcing QTs will stop at year's end. (so two more months of QT). They may also reduce the amount of QT (currently at $40 billion/month).
Will It Be Enough?
There is an old saying that the Fed keeps hiking until something breaks. When the Fed starts hiking rates, they really do not know when to stop. They often keep going until they go too far. The most recent example of this was the wave of bank failures triggered by soaring interest rates. Silicon Valley Bank imploded in the spring of 2023.
The 2025 corollary is that the Fed continues QT (Quantitative Tightening) until something breaks. In other words, the Fed reduces its balance sheet too far and/or too fast.
Is QE The Fix?
Right now, many are screaming that the fix is for the Fed to “print” or Quantitative Easing (QE), thus adding liquidity. This was the answer to all such problems before 2022.
The problem now is an unacceptably high inflation rate (see the dotted line below). Core CPI inflation is still stuck above 3% five years after the COVID lockdowns and, in my opinion, is accelerating.
In such an environment, “printing” (QE) could cause markets to fear inflation, trigger a sell-off (if not a collapse) in the bond market, and worsen the situation.
6
6/6
The signal from the funding market and bank stocks was that they are worried the Fed drained too much liquidity from the system (QT), and it is not clear whether they appreciate it, the risk of another round of QE, or how to fix it.
The signal from the funding market and bank stocks was that they are worried the Fed drained too much liquidity from the system (QT), and it is not clear whether they appreciate it, the risk of another round of QE, or how to fix it.
