$SPY My trading strategy mega thread! 🧵 The goal of this thread is...

Casey@Team2Trading
437 views
May 18, 2025
~6 min read
Advertisement
1
$SPY My trading strategy mega thread! 🧵
The goal of this thread is to help you identify & execute your own high quality trades.
$100 days turn into $1,000 days quickly when you start to follow a repeatable system!
And this is my system 👇

The goal of this thread is to help you identify & execute your own high quality trades.
$100 days turn into $1,000 days quickly when you start to follow a repeatable system!
And this is my system 👇
2
I start by marking these 4 levels everyday... ✍️
~Previous Day High
~Previous Day Low
~Pre Market High
~Pre Market Low
*Previous Day High / Low = Highest & Lowest price of yesterday's trading session.
*Pre Market High / Low = Highest & Lowest price from 4am to market open.
Here's a visual example of where to find these 4 levels on your chart 👇
~Previous Day High
~Previous Day Low
~Pre Market High
~Pre Market Low
*Previous Day High / Low = Highest & Lowest price of yesterday's trading session.
*Pre Market High / Low = Highest & Lowest price from 4am to market open.
Here's a visual example of where to find these 4 levels on your chart 👇
3
Now I use the Previous Day High & Low levels to make 2 support & resistance zones.
I use the 15 minute chart...
Previous Day High to the following candle body = My PDH resistance zone.
Previous Day Low to the following candle body = My PDL support zone.
Visual example of how I make the zones 👇
I use the 15 minute chart...
Previous Day High to the following candle body = My PDH resistance zone.
Previous Day Low to the following candle body = My PDL support zone.
Visual example of how I make the zones 👇
4
I am now using those Previous Day High & Low zones as my main form of directional bias for the day.
This gives me 4 scenarios to watch ⬇️
1️⃣ Break the PDH = Focus on calls 📈
2️⃣ Reject the PDH = Focus on puts 📉
3️⃣ Bounce at PDL = Focus on calls 📈
4️⃣ Break the PDL = Focus on puts 📉
These are the 4 most common scenarios you will see play out on a day to day basis. I try my best to follow this road map 👇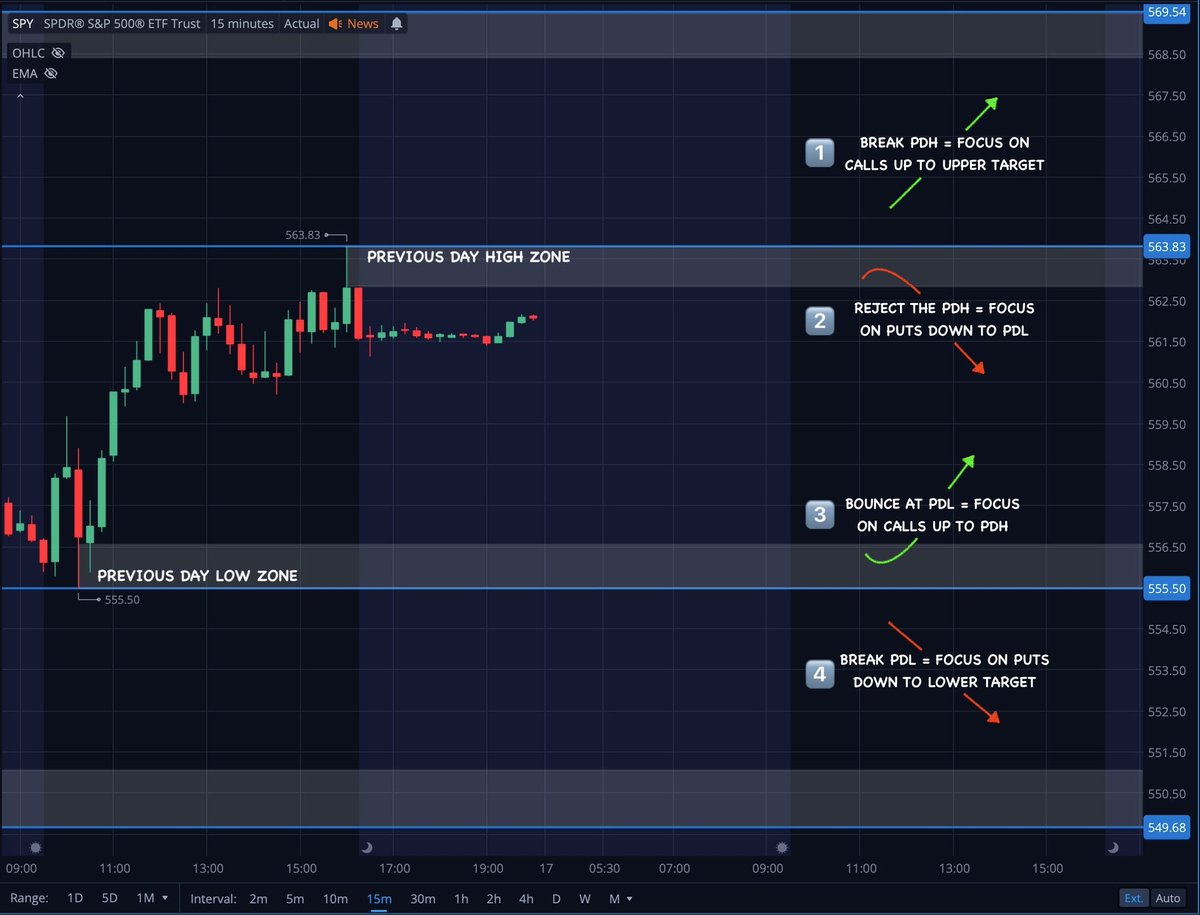
This gives me 4 scenarios to watch ⬇️
1️⃣ Break the PDH = Focus on calls 📈
2️⃣ Reject the PDH = Focus on puts 📉
3️⃣ Bounce at PDL = Focus on calls 📈
4️⃣ Break the PDL = Focus on puts 📉
These are the 4 most common scenarios you will see play out on a day to day basis. I try my best to follow this road map 👇
5
Here's a quick visual of how important these previous day high & Low zones are to watch.
Nearly every day these areas of support & resistance will deliver a strong reaction 👇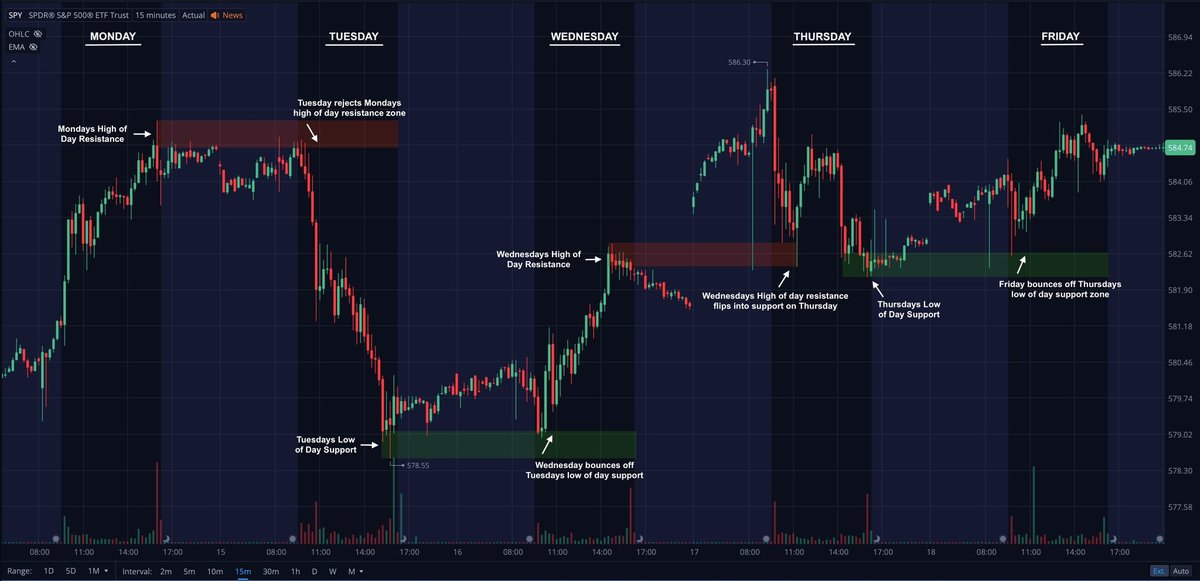
Nearly every day these areas of support & resistance will deliver a strong reaction 👇
6
The Pre Market High & Low are my secondary levels.
They are often strong support & resistance that give me another range to watch. They can be used for entries, targets, and best of all... avoiding chop.
I try to avoid trading when price is between the pre market high & low. That area is known to be choppy so be aware of this range 👇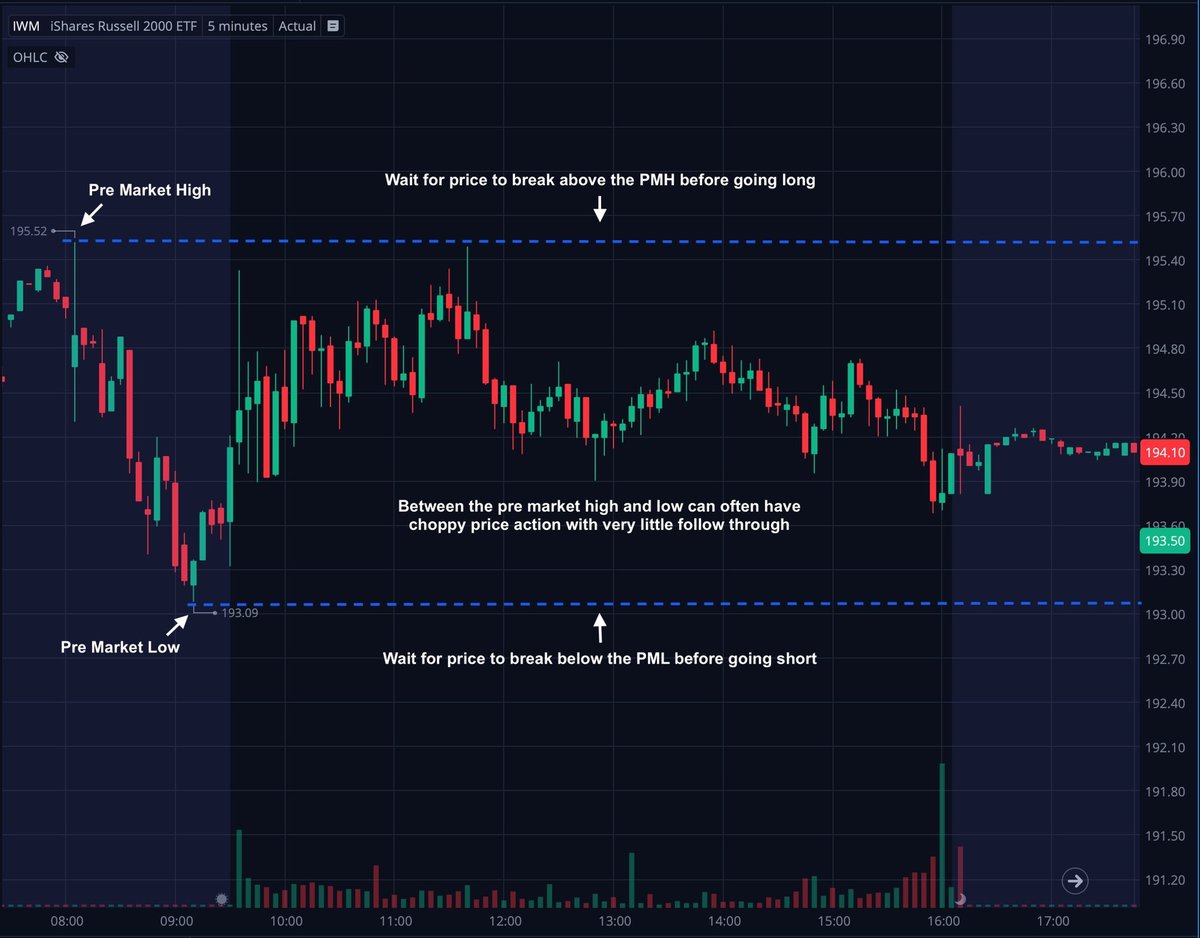
They are often strong support & resistance that give me another range to watch. They can be used for entries, targets, and best of all... avoiding chop.
I try to avoid trading when price is between the pre market high & low. That area is known to be choppy so be aware of this range 👇
7
Here's an example from this week using the levels & zones to guide me on direction.
Price bouncing at the Previous Day Low zone sets up scenario 3 (focus on calls).
Breaking the PMH level is further confirmation and also an entry point.
Next we break the Previous Day High zone setting up scenario 1 (Keep the focus on calls).
Multiple confirmations & multiple opportunities to catch a piece of this trend up. All by marking those 4 simple levels before open 👇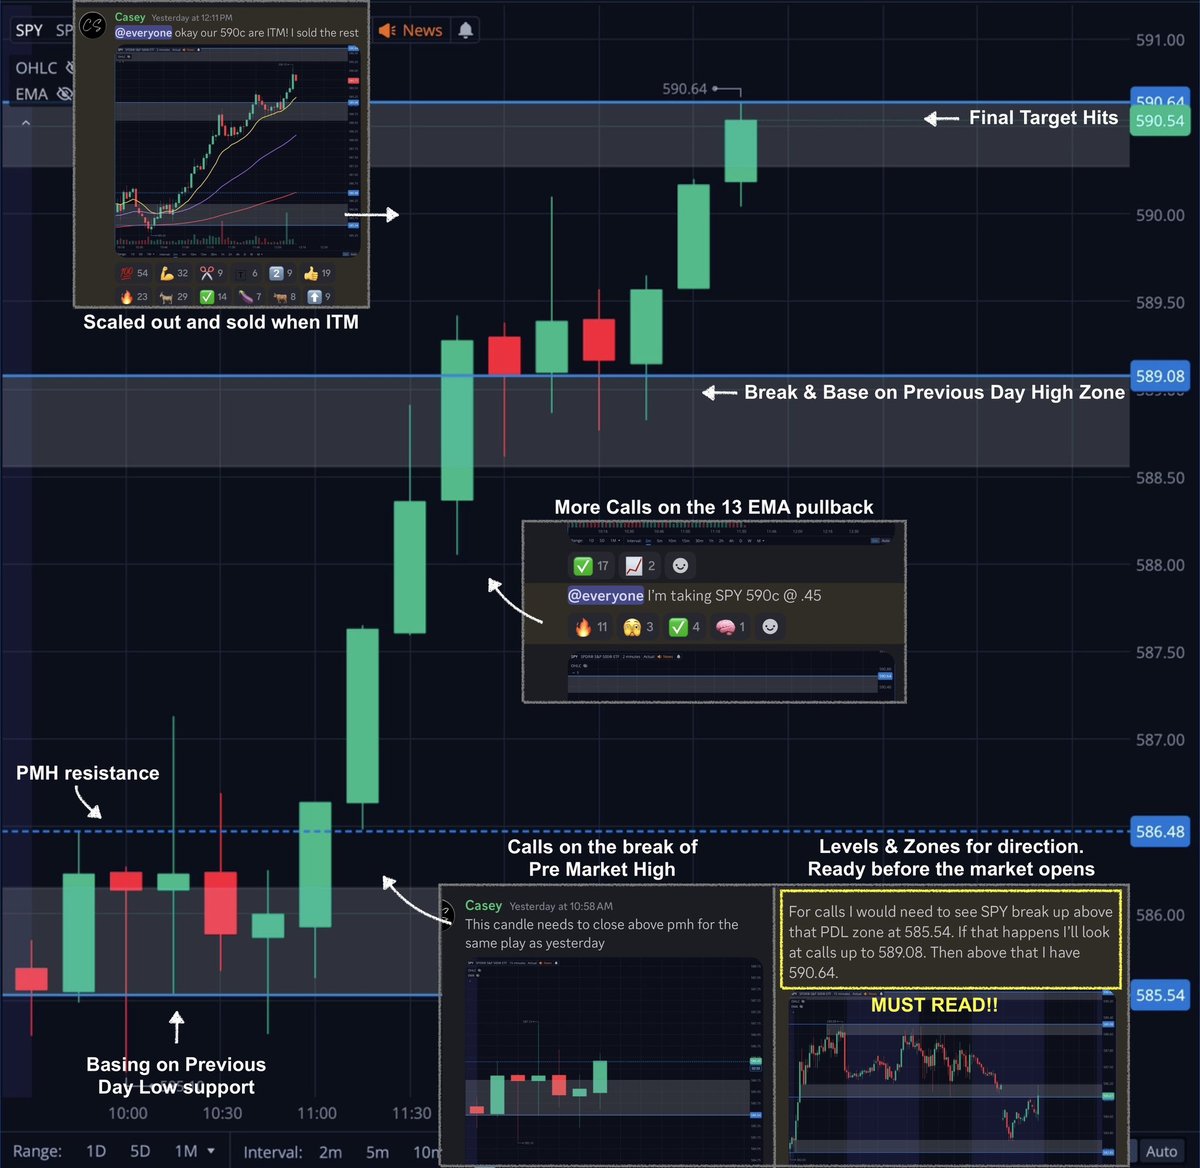
Price bouncing at the Previous Day Low zone sets up scenario 3 (focus on calls).
Breaking the PMH level is further confirmation and also an entry point.
Next we break the Previous Day High zone setting up scenario 1 (Keep the focus on calls).
Multiple confirmations & multiple opportunities to catch a piece of this trend up. All by marking those 4 simple levels before open 👇
8
Same trade setup here using a simple Pre Market Range breaks as both my direction bias and entry 👇

9
Now that you know how to mark your levels & zones, Let's move on to the next major part of my system...
EMA trends!
You catch more big moves by joining the trends, not fading them. And EMA's help me do that.
Let's take a look at how to identity bullish vs bearish EMA trends. As well as some tips for avoiding chop.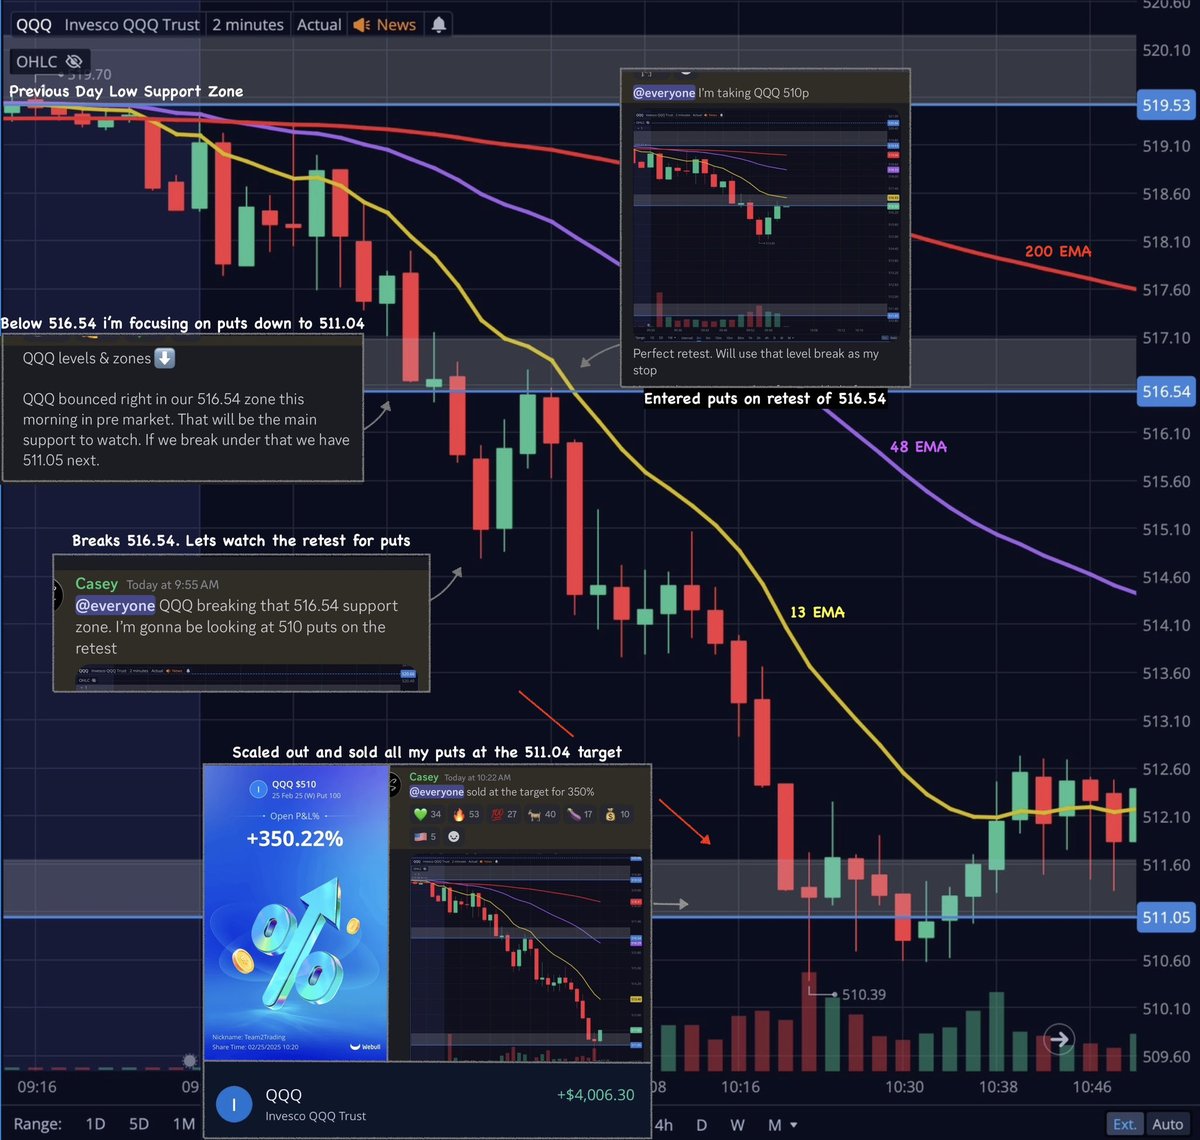

EMA trends!
You catch more big moves by joining the trends, not fading them. And EMA's help me do that.
Let's take a look at how to identity bullish vs bearish EMA trends. As well as some tips for avoiding chop.
10
There are plenty of EMA's to choose from. Its not really about which work best, its about getting familiar with how price moves around the ones you choose to use.
I've studied them for years. These are the ones I like...
13 EMA 🟡
48 EMA 🟣
200 EMA 🔴
These are powerful and respected on nearly every timeframe. My favorite is the 2 minute chart (for day trading).
They help me identify trends, find entries / risk levels, as well as avoid choppy areas.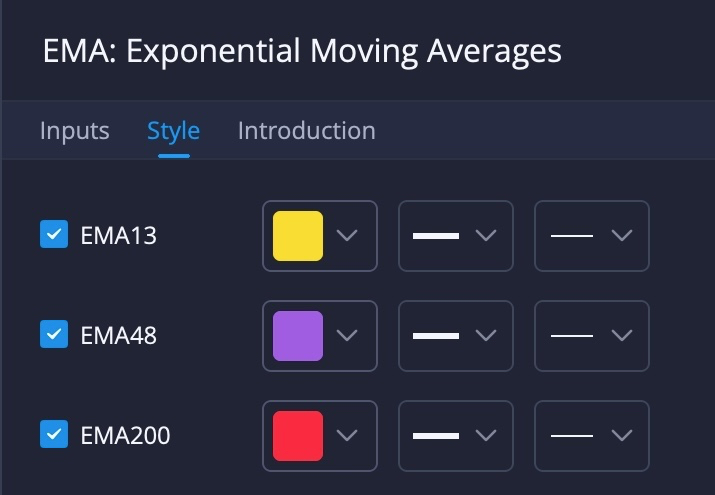
I've studied them for years. These are the ones I like...
13 EMA 🟡
48 EMA 🟣
200 EMA 🔴
These are powerful and respected on nearly every timeframe. My favorite is the 2 minute chart (for day trading).
They help me identify trends, find entries / risk levels, as well as avoid choppy areas.
11
Bullish EMA trend 📈
Here's a quick cheat sheet to remember...
13 EMA on top 🟡
48 EMA in middle 🟣
200 EMA on bottom 🔴
That is the EMA placement you will see in a bullish trend. You want to keep the focus on calls / upside in this situation 👇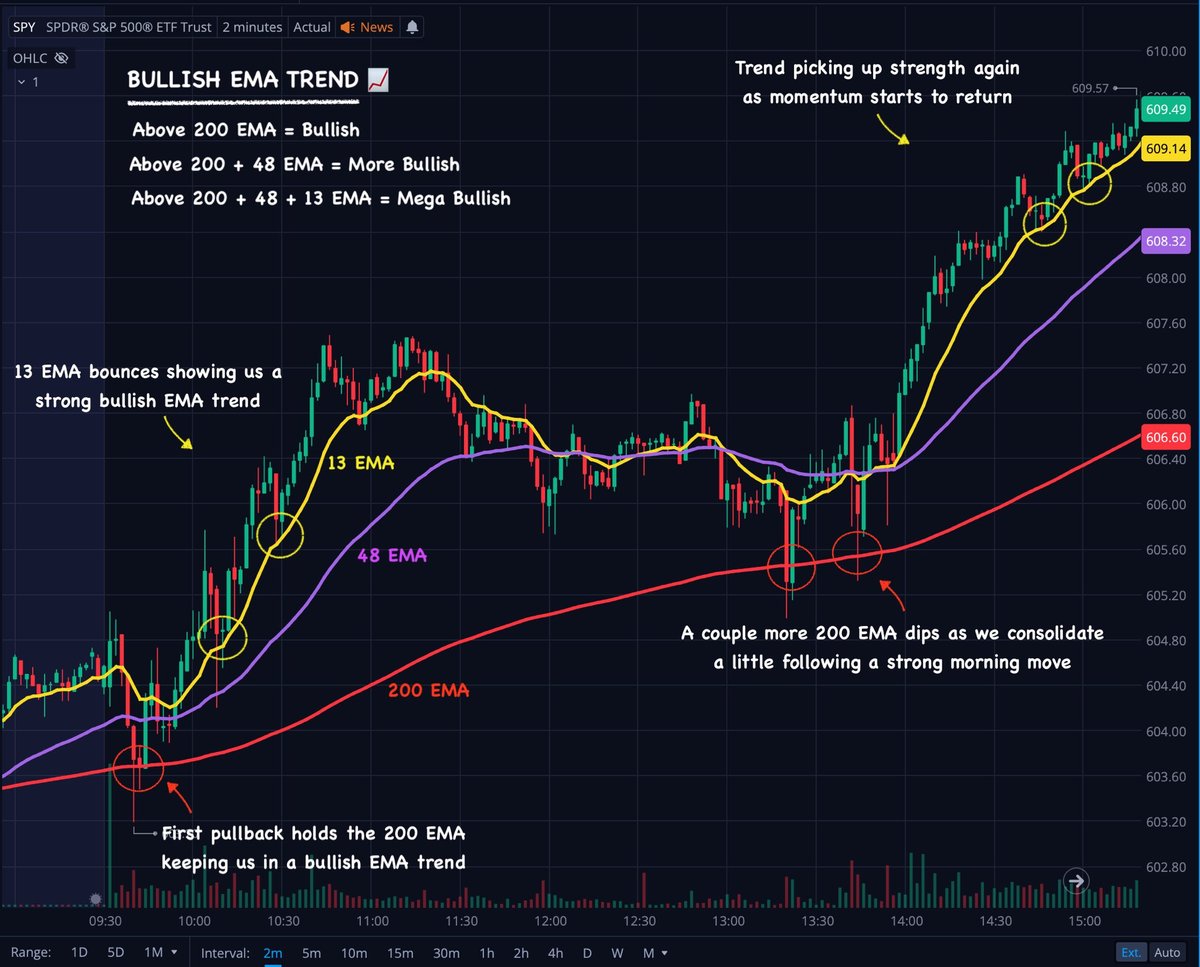
Here's a quick cheat sheet to remember...
13 EMA on top 🟡
48 EMA in middle 🟣
200 EMA on bottom 🔴
That is the EMA placement you will see in a bullish trend. You want to keep the focus on calls / upside in this situation 👇
12
Bearish EMA trend 📉
Simply reverse the cheat sheet from above...
200 EMA on top 🔴
48 EMA in middle 🟣
13 EMA on bottom 🟡
That is the EMA placement you will see in a bearish trend. You want to keep the focus on puts / downside in this situation 👇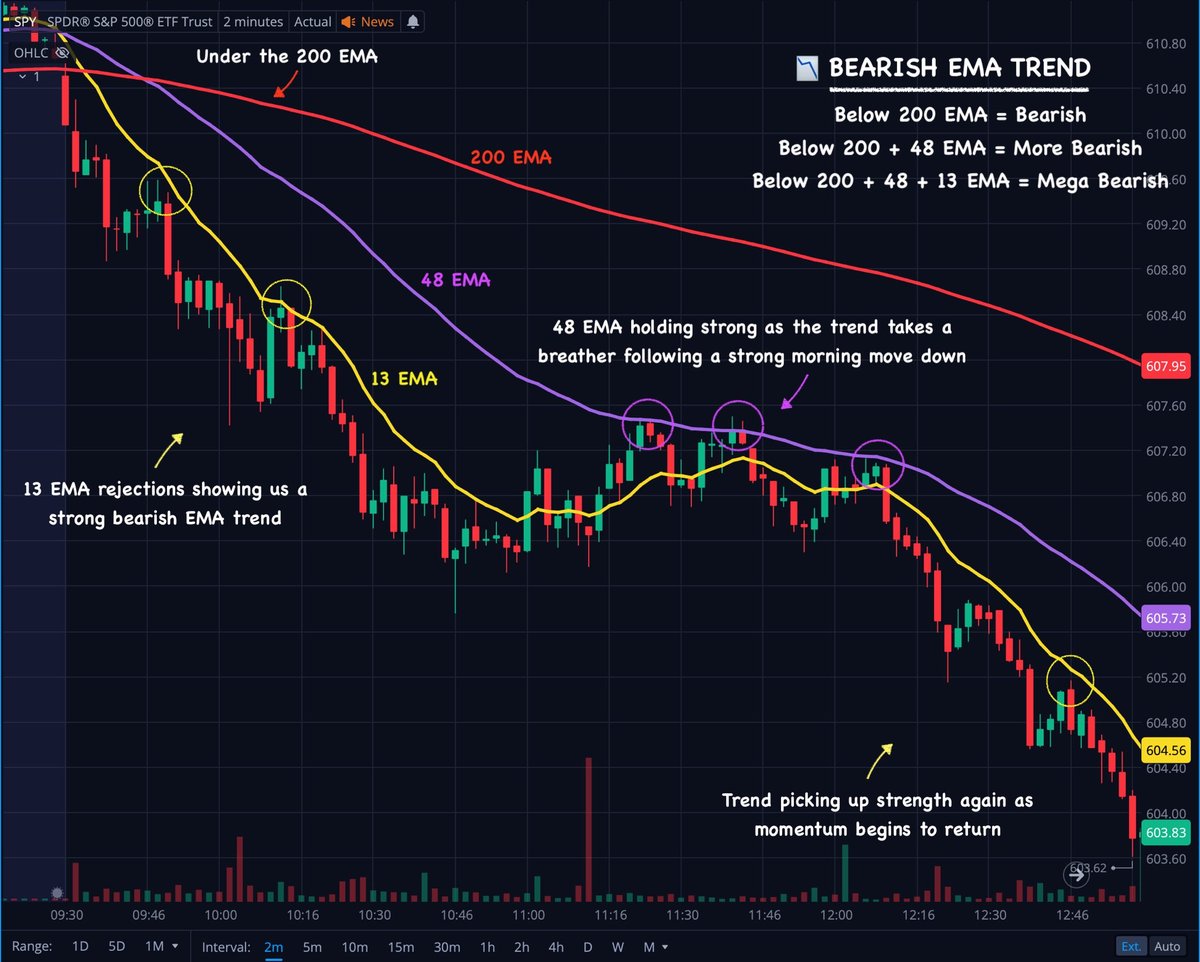
Simply reverse the cheat sheet from above...
200 EMA on top 🔴
48 EMA in middle 🟣
13 EMA on bottom 🟡
That is the EMA placement you will see in a bearish trend. You want to keep the focus on puts / downside in this situation 👇
13
I try to avoid trading the areas where there is no momentum shown in the EMA's.
Those are typically the areas before one of my levels has broke.
EMA's get respected when price is trending with one sided momentum. Trends only occur when price is breaking out of a range.
Range = Consolidation = Chop
Range break = Momentum = Trend
Those are typically the areas before one of my levels has broke.
EMA's get respected when price is trending with one sided momentum. Trends only occur when price is breaking out of a range.
Range = Consolidation = Chop
Range break = Momentum = Trend
14
Here's an example of choppy price action switching into trending price action.
IMO there was no better way to read this chart than using my levels & zones combined with my EMA trends.
Avoiding the chop and catching the trend is the name of the game 👇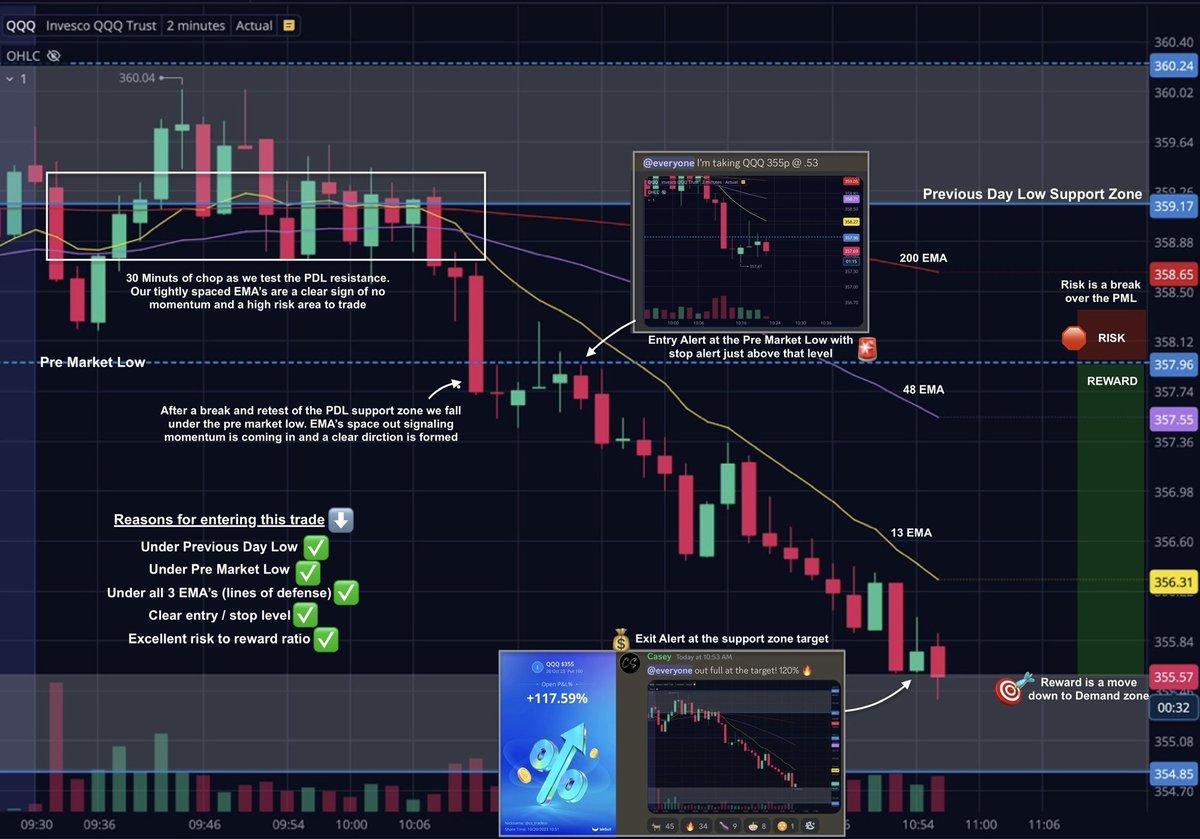
IMO there was no better way to read this chart than using my levels & zones combined with my EMA trends.
Avoiding the chop and catching the trend is the name of the game 👇
15
Another example of avoiding the chop and catching the trend.
Once you understand the simple principles behind levels & EMA trends you know exactly why I took this trade where I did 👇
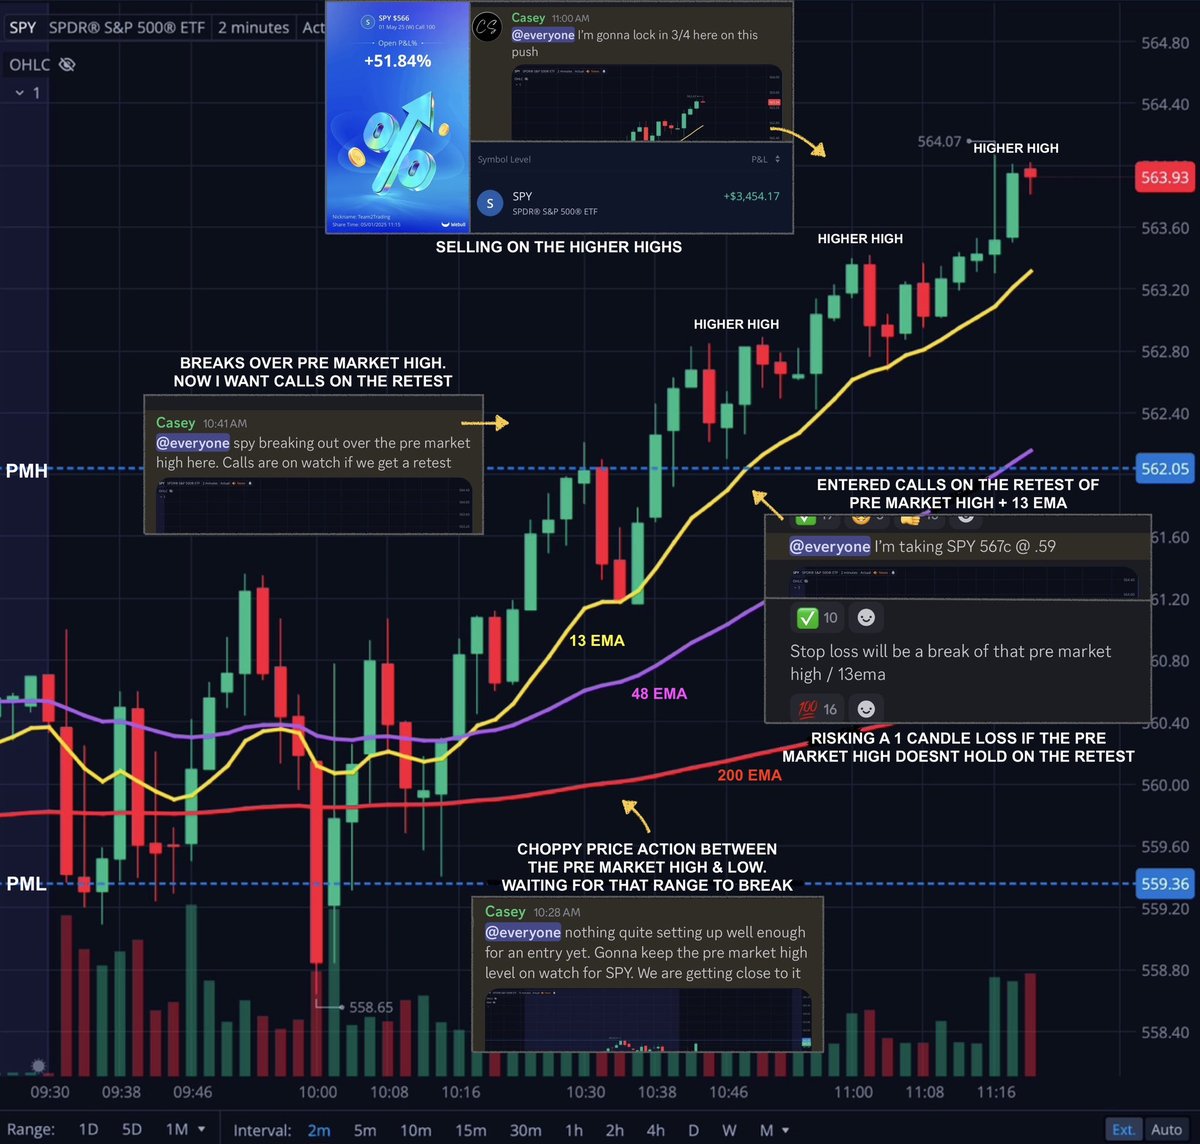
Once you understand the simple principles behind levels & EMA trends you know exactly why I took this trade where I did 👇
16
So I have my levels & zones combined with my EMA trends. Together they are a powerful combination that keeps me on the right side of the move "most of the time."
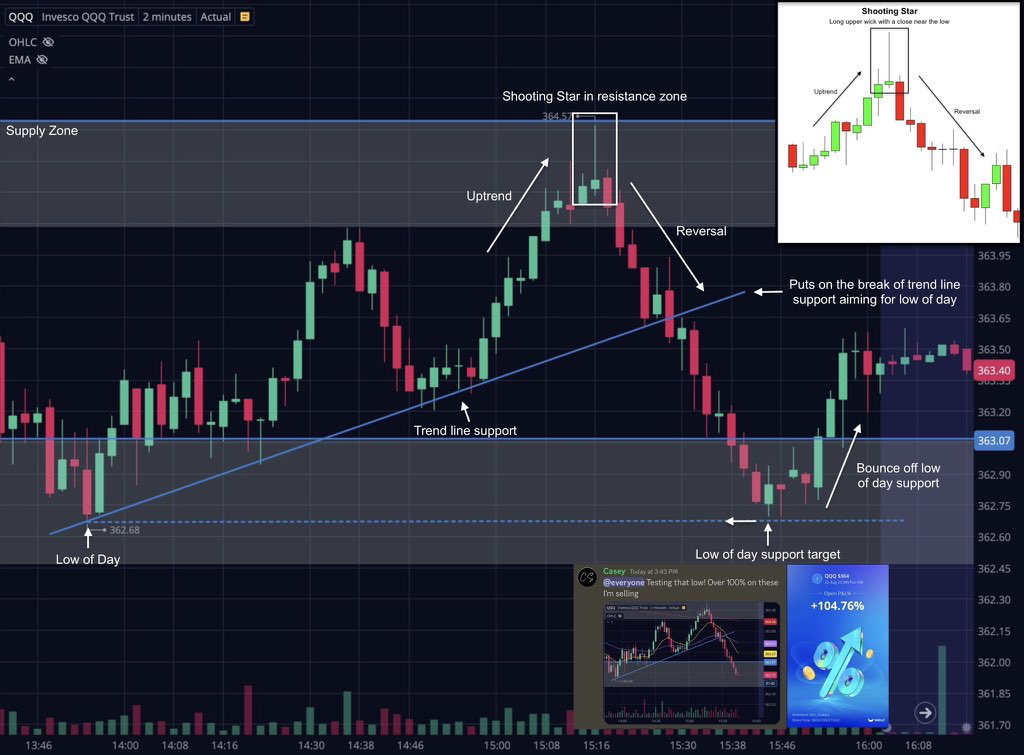
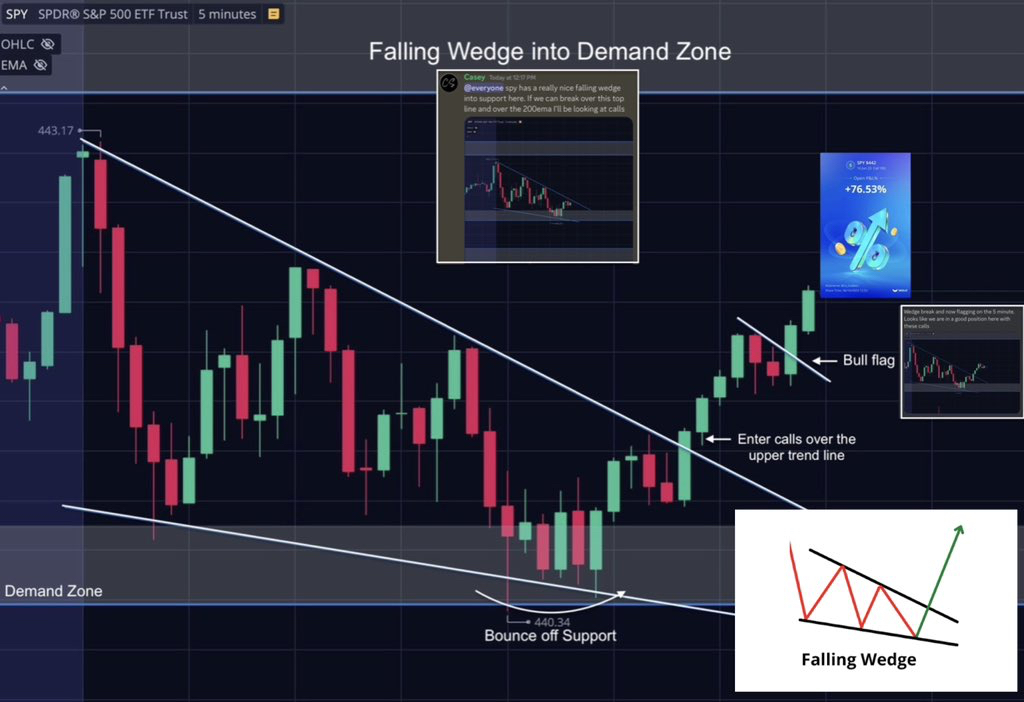
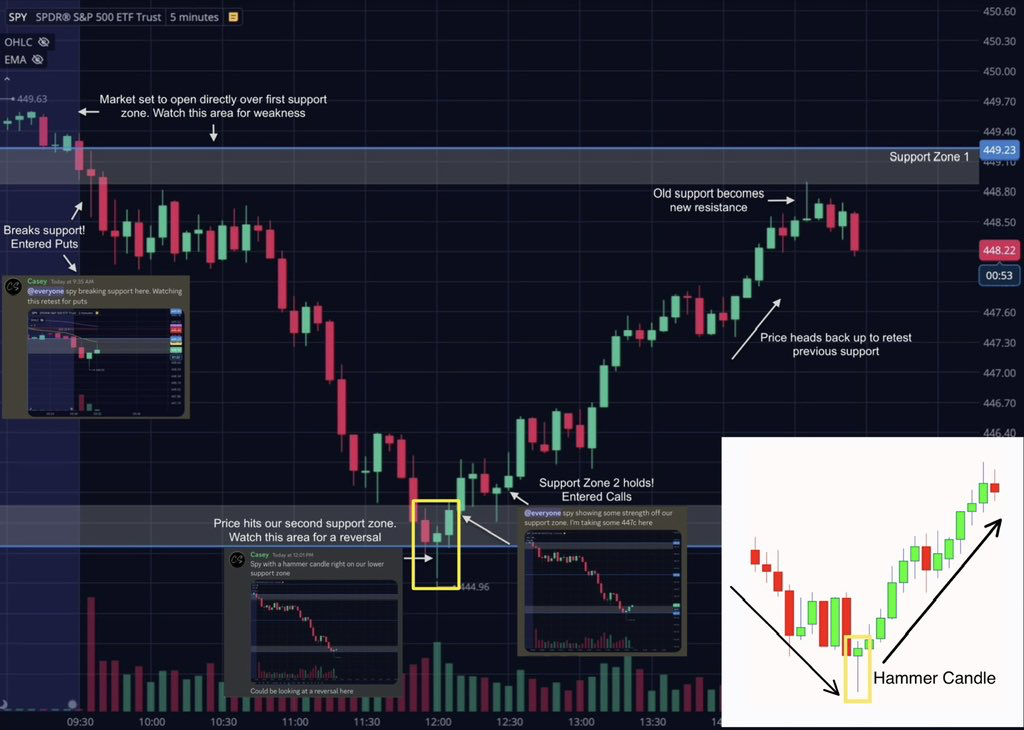
This brings us to chart patterns!
Learning basic chart patterns will provide a nice bit of added confirmation to any trading system.
I focus on the simple & reliable ones that are effective and easy to spot in real time 👇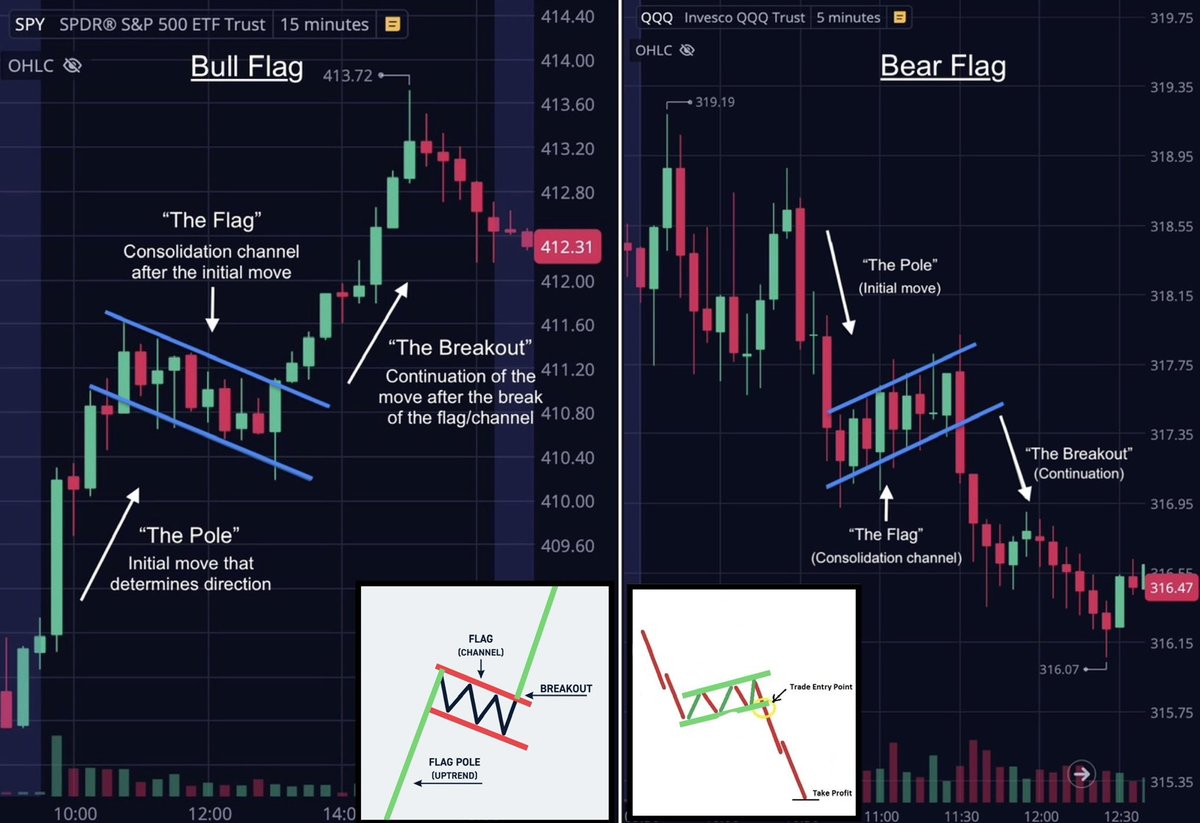
This brings us to chart patterns!
Learning basic chart patterns will provide a nice bit of added confirmation to any trading system.
I focus on the simple & reliable ones that are effective and easy to spot in real time 👇
17
The techniques above give me everything i need to find high quality trades just like this one!
Break & Retest of PDH ✅
Bullish EMA trend ✅
Bull Flagging ✅
Multiple confirmations 👇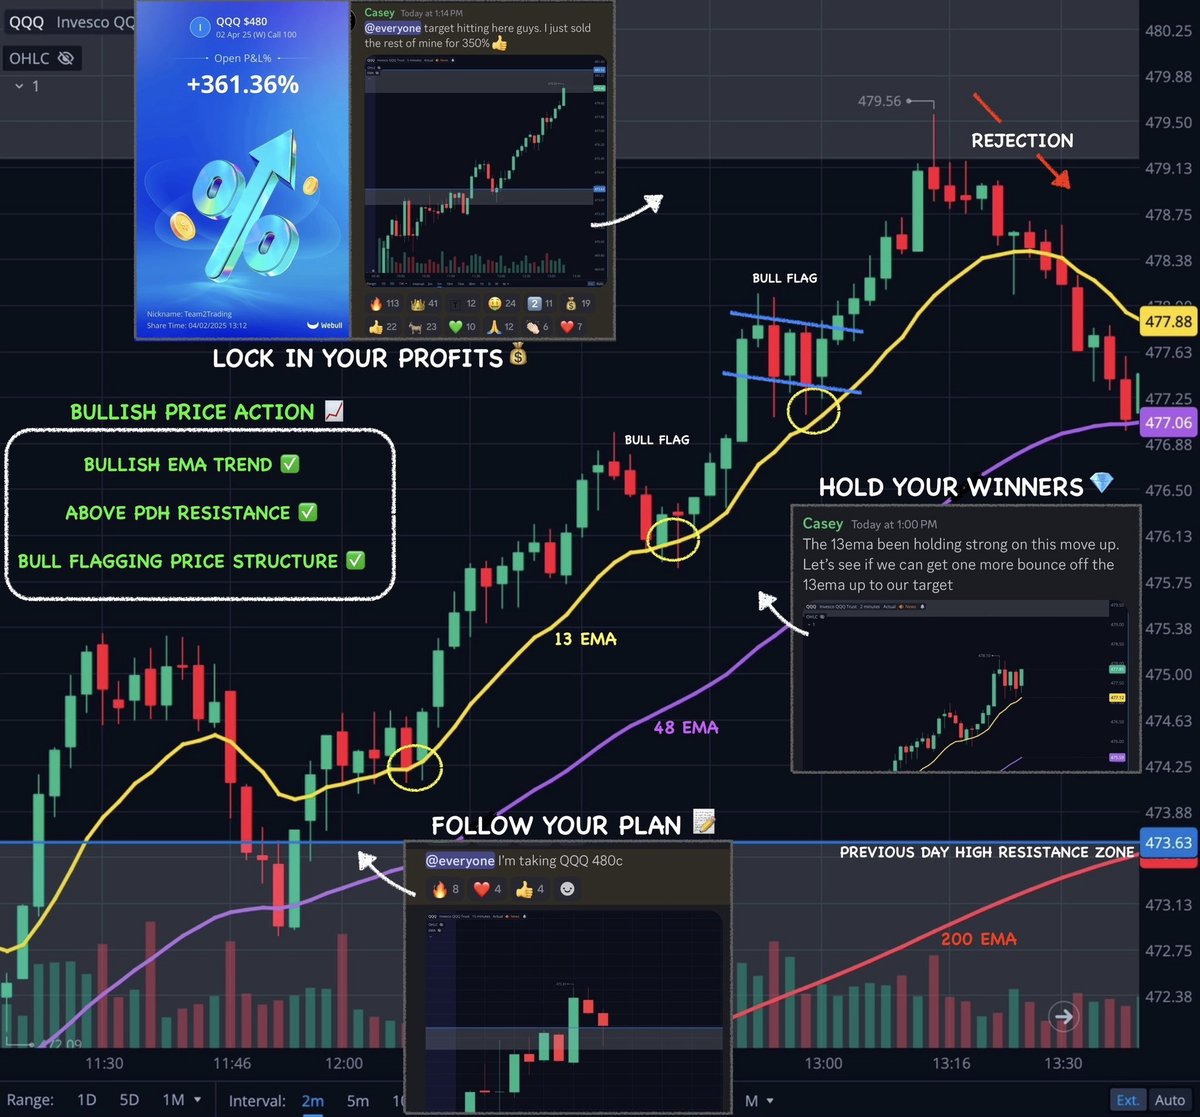
Break & Retest of PDH ✅
Bullish EMA trend ✅
Bull Flagging ✅
Multiple confirmations 👇
18
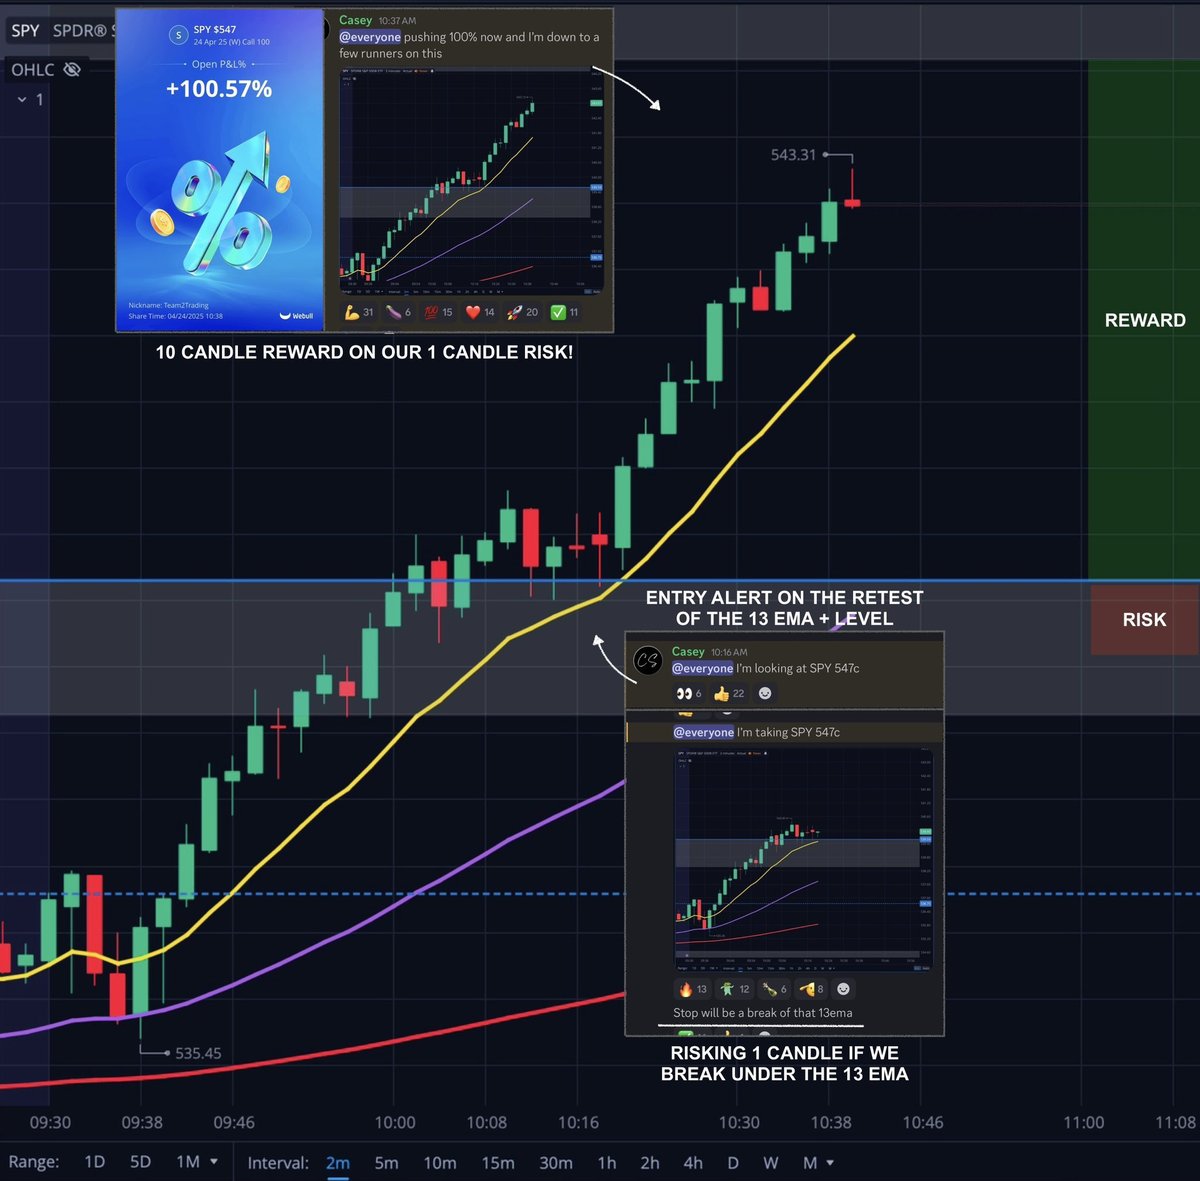
Once I have identified the trend I am typically looking for a pullback entry to a level or EMA.
My favorite entry is a 13 EMA pullback and I stop out if the 13 EMA does not hold.
Example of some entry points into a trend 👇
My favorite entry is a 13 EMA pullback and I stop out if the 13 EMA does not hold.
Example of some entry points into a trend 👇
19
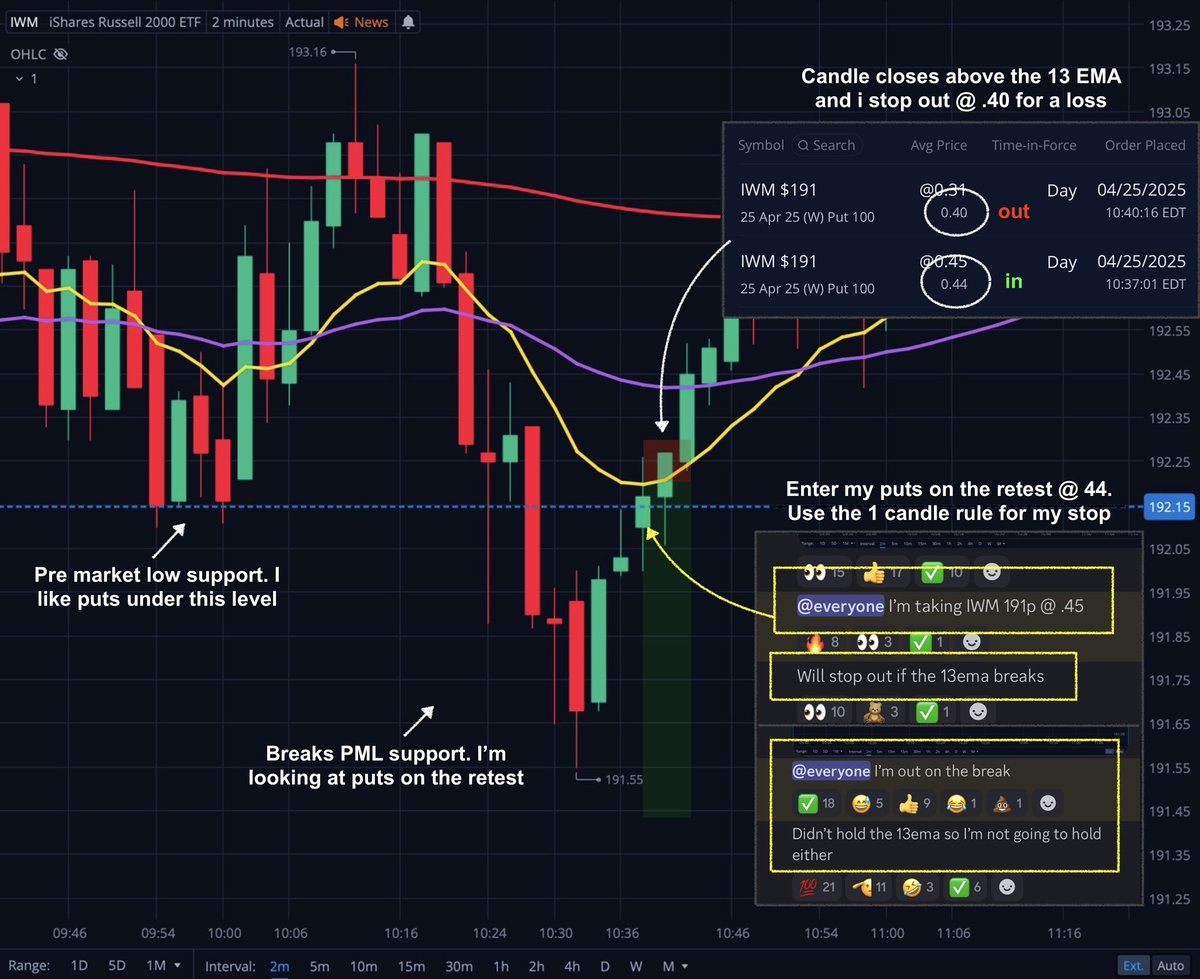
I call this the "Risk 1 , win multiple" technique.
When you use a level or EMA pullback as your risk, you are capping your loss to 1 candle if it doesn't hold.
However... If the EMA does hold, you are going to win multiple candles. So your reward is almost always going to be greater than your risk 👇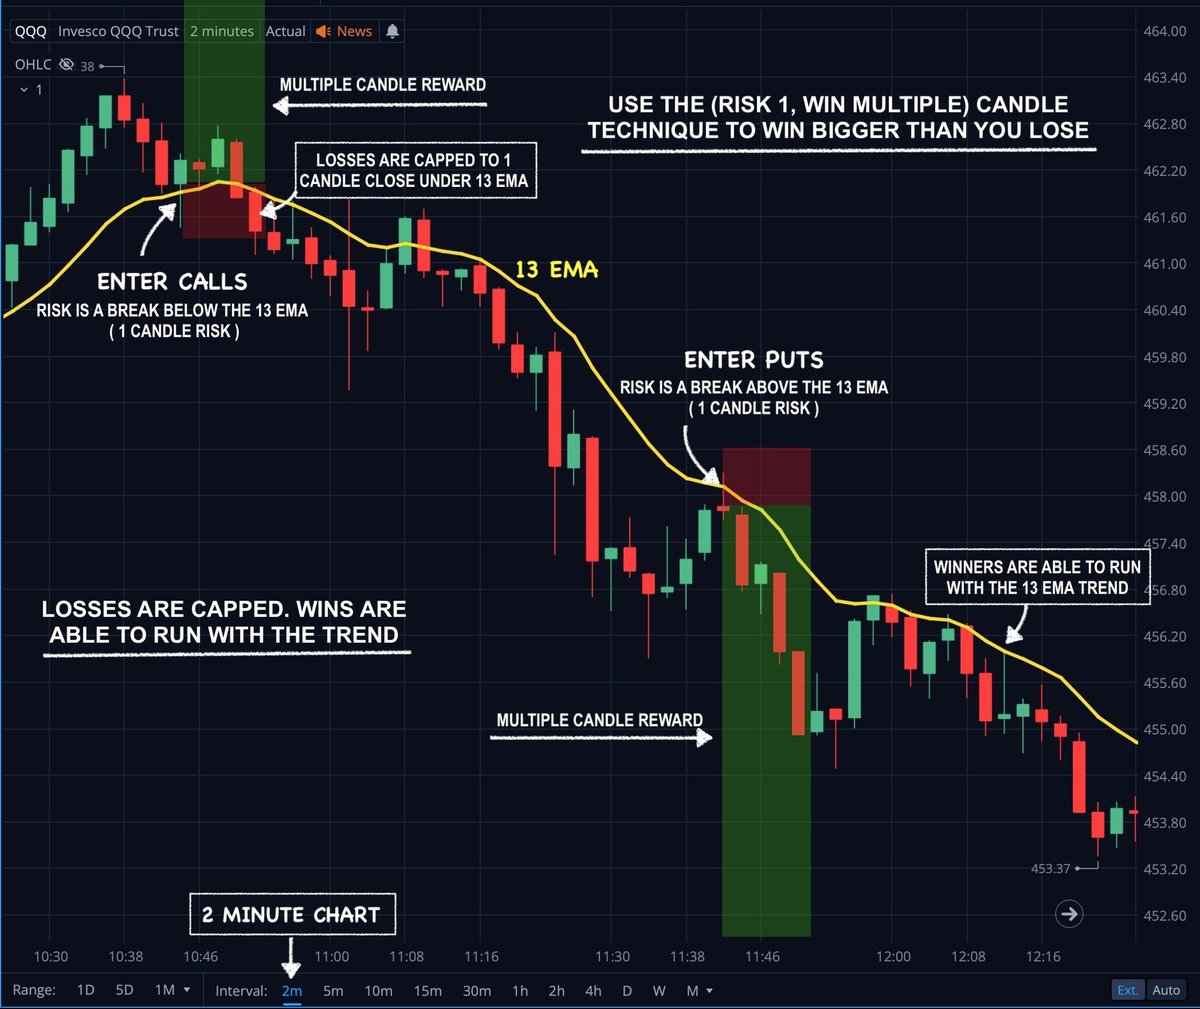
When you use a level or EMA pullback as your risk, you are capping your loss to 1 candle if it doesn't hold.
However... If the EMA does hold, you are going to win multiple candles. So your reward is almost always going to be greater than your risk 👇
20
Risk 1 candle to win multiple 👇
21
Checklist for an A+ upside move to occur 📝
Above Previous Day High ✅
Bullish EMA trend ✅
Bull Flagging ✅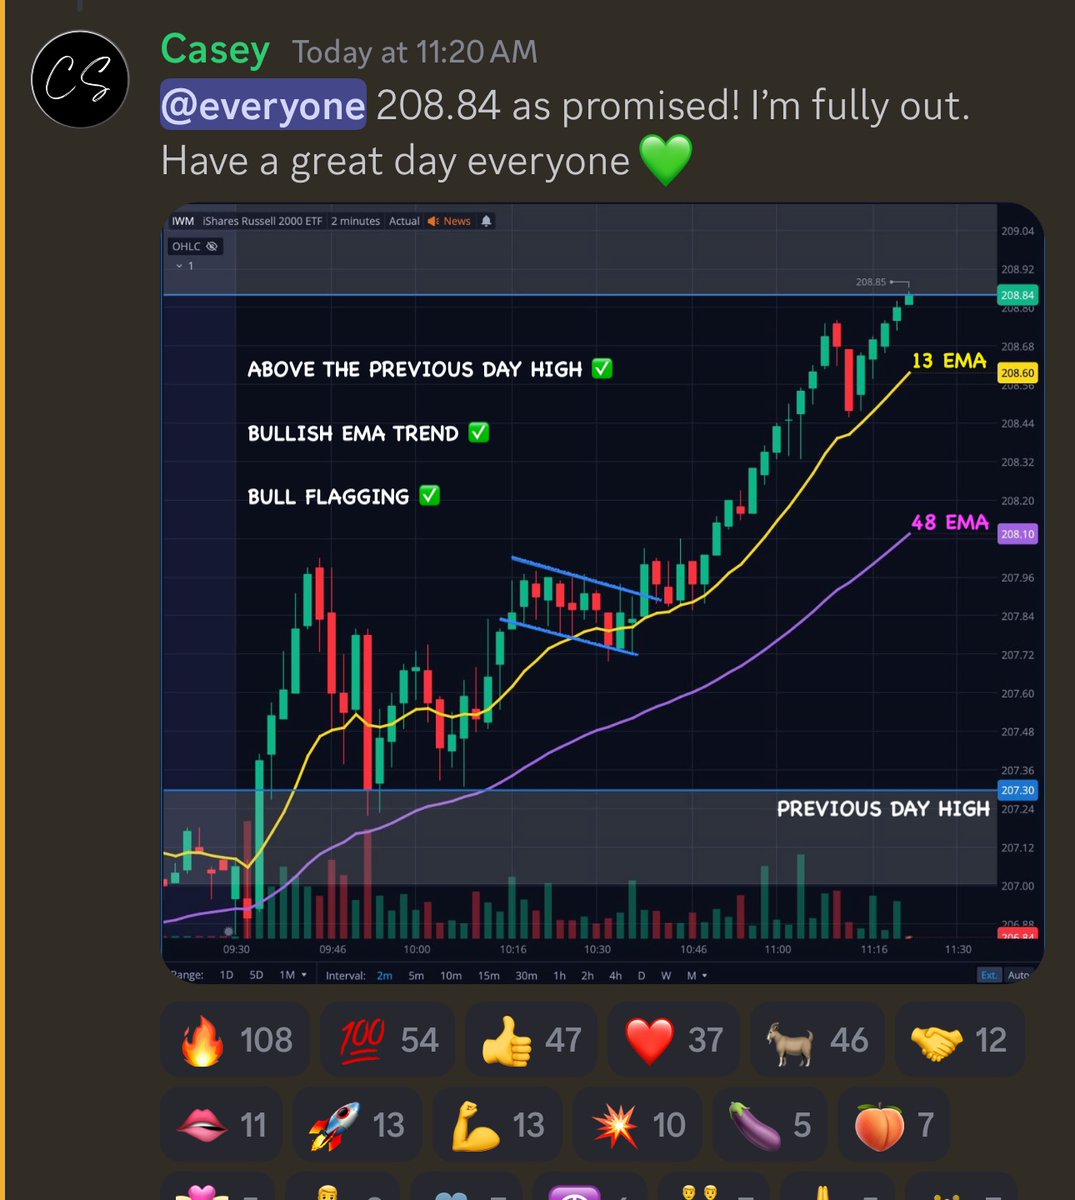
Above Previous Day High ✅
Bullish EMA trend ✅
Bull Flagging ✅
22
Checklist for an A+ downside move to occur 📝
Below Previous Day Low ✅
Bearish EMA trend ✅
Bear Flagging ✅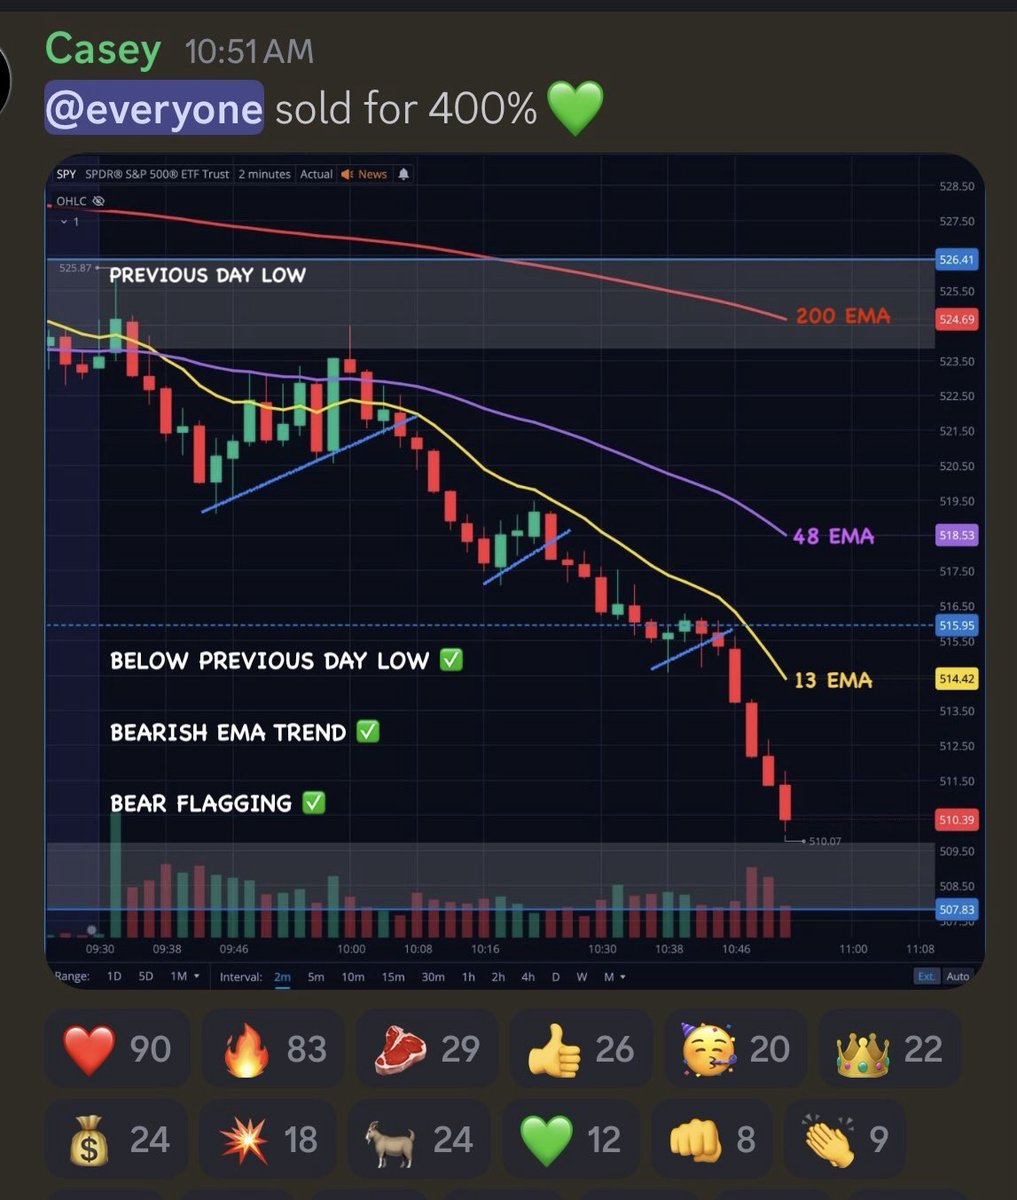
Below Previous Day Low ✅
Bearish EMA trend ✅
Bear Flagging ✅
23
I've been trading this exact same system for close to a decade now! And sharing it on twitter openly for 5+ years.
It's nearly impossible to cover all the ins & outs of a strategy in a single thread, so make sure to follow along for daily breakdowns & educational content.
Thanks for reading guys! Hopefully you learned something new today 💚
It's nearly impossible to cover all the ins & outs of a strategy in a single thread, so make sure to follow along for daily breakdowns & educational content.
Thanks for reading guys! Hopefully you learned something new today 💚


