$SPY I trade options for a living... Consistent $5k - $10K weeks...

Casey@Team2Trading
228 views
Mar 12, 2025
~4 min read
Advertisement
1
$SPY I trade options for a living...
Consistent $5k - $10K weeks and I feel I'm not even scratching the surface of my potential yet!
This is my strategy thread 🧵
Consistent $5k - $10K weeks and I feel I'm not even scratching the surface of my potential yet!
This is my strategy thread 🧵
2
Let's start by going over my objective each day...
I'm looking to identify the trend by watching key areas of support & resistance, then catch a piece of that trend as price travels from one level to the next.
Identify the trend ✅
Enter the trend ✅
Manage risk ✅
Take profit ✅
There are many ways to accomplish this, I'm simply going to show you mine 👇
I'm looking to identify the trend by watching key areas of support & resistance, then catch a piece of that trend as price travels from one level to the next.
Identify the trend ✅
Enter the trend ✅
Manage risk ✅
Take profit ✅
There are many ways to accomplish this, I'm simply going to show you mine 👇
3
The first thing I do is make a small zone using the Previous Day High & Previous Day Low levels...
These 2 zones will determine the directional bias for my trades that day.
Here's my quick cheat sheet 👇
Break above PDH = Bullish
Reject at PDH = Bearish
Bounce at PDL = Bullish
Break under PDL = Bearish
This gives me 4 scenarios to watch for. Now... we will circle back to this chart later because I always like to combine this with a second form of confirmation.
So lets keep it rolling to that ⬇️
These 2 zones will determine the directional bias for my trades that day.
Here's my quick cheat sheet 👇
Break above PDH = Bullish
Reject at PDH = Bearish
Bounce at PDL = Bullish
Break under PDL = Bearish
This gives me 4 scenarios to watch for. Now... we will circle back to this chart later because I always like to combine this with a second form of confirmation.
So lets keep it rolling to that ⬇️
4
The second major part to my strategy is making sure I am following and trading with the EMA trends!
I've studied EMA trends for a long time and my favorite combo is...
( 13 / 48 / 200 EMA on the 2 minute chart)
Here's my cheat sheet for these EMA trends 👇
Above 200 EMA = Bullish
Above 200 + 48 EMA = More Bullish
Above 200 + 48 + 13 EMA = Mega Bullish
Below 200 EMA = Bearish
Below 200 + 48 EMA = More Bearish
Below 200 + 48 + 13 EMA = Mega Bearish
Lets breaks this down with an example of each to get more familiar with them 👍
I've studied EMA trends for a long time and my favorite combo is...
( 13 / 48 / 200 EMA on the 2 minute chart)
Here's my cheat sheet for these EMA trends 👇
Above 200 EMA = Bullish
Above 200 + 48 EMA = More Bullish
Above 200 + 48 + 13 EMA = Mega Bullish
Below 200 EMA = Bearish
Below 200 + 48 EMA = More Bearish
Below 200 + 48 + 13 EMA = Mega Bearish
Lets breaks this down with an example of each to get more familiar with them 👍
5
Bullish EMA trend 📈
Remember the cheat sheet from above...
200 EMA on bottom 🔴
48 EMA in middle 🟣
13 EMA on top 🟡
This is signaling that all the momentum is to the upside so we want to focus on trading with the trend.
The strongest directional moves will always occur when price is over or under all 3 of these EMA's 👇
Remember the cheat sheet from above...
200 EMA on bottom 🔴
48 EMA in middle 🟣
13 EMA on top 🟡
This is signaling that all the momentum is to the upside so we want to focus on trading with the trend.
The strongest directional moves will always occur when price is over or under all 3 of these EMA's 👇
6
Bearish EMA trends 📉
200 EMA on top 🔴
48 EMA in middle 🟣
13 EMA on bottom 🟡
Think of these as your lines of defense! They are support & resistance levels that price has to get through in order to reverse.
So the trend is strongest when under or over all 3👇
200 EMA on top 🔴
48 EMA in middle 🟣
13 EMA on bottom 🟡
Think of these as your lines of defense! They are support & resistance levels that price has to get through in order to reverse.
So the trend is strongest when under or over all 3👇
7
Now let's circle back to our Previous Day High & Low zones from the example above and see which of those 4 scenarios from the cheat sheet played out...
As you can see, we broke the PDL support so my main focus was trading puts today! (Yes, the main example in this thread is from today)
So now that I have my Bearish bias from the zones, Lets look at the exact entry and trade 👇
As you can see, we broke the PDL support so my main focus was trading puts today! (Yes, the main example in this thread is from today)
So now that I have my Bearish bias from the zones, Lets look at the exact entry and trade 👇
8
Here's the trade recap using our zones + EMA strategy.
Broke the PDL support ✅
In a Bearish EMA trend ✅
Flagging into the 13 EMA ✅
This is what I consider a high confidence A+ setup to the downside!
Support & Resistance aligning with the EMA trend to create a smooth move down with plenty of momentum.
Broke the PDL support ✅
In a Bearish EMA trend ✅
Flagging into the 13 EMA ✅
This is what I consider a high confidence A+ setup to the downside!
Support & Resistance aligning with the EMA trend to create a smooth move down with plenty of momentum.
9
Let's quickly go over why letting the EMA's and zones align is so important!
Going long only off a zone bounce can get rejected by the EMA resistance ❌
Going short only off the EMA rejection can get a support bounce at the zone ❌
Waiting for price to get below the zone + the EMA's or vice versa usually leads to much smoother and high probability trade ✅
Going long only off a zone bounce can get rejected by the EMA resistance ❌
Going short only off the EMA rejection can get a support bounce at the zone ❌
Waiting for price to get below the zone + the EMA's or vice versa usually leads to much smoother and high probability trade ✅
10
Going to leave you with a few more trade recaps to study. Notice how I'm always trading the same setups over & over.
These setups are consistent. So by waiting patiently for them I am able to achieve consistent results week after week 👇
These setups are consistent. So by waiting patiently for them I am able to achieve consistent results week after week 👇
11
$IWM
Breaks under the Previous Day Low Support while in a Bearish EMA trend 📉
Breaks under the Previous Day Low Support while in a Bearish EMA trend 📉
12
$QQQ
Opens under the Previous Day Low Support and gets a strong Bearish EMA trend started.
I wait for price to break & retest my first target + 13 EM and take some puts down to the second target ✅
Opens under the Previous Day Low Support and gets a strong Bearish EMA trend started.
I wait for price to break & retest my first target + 13 EM and take some puts down to the second target ✅
13
$QQQ
Perfect retest of the Previous Day High. Also has the 200 EMA support aligned.
Starts a strong Bullish EMA trend and I grab some calls on a dip.
It's the same technical setup for both longs or shorts.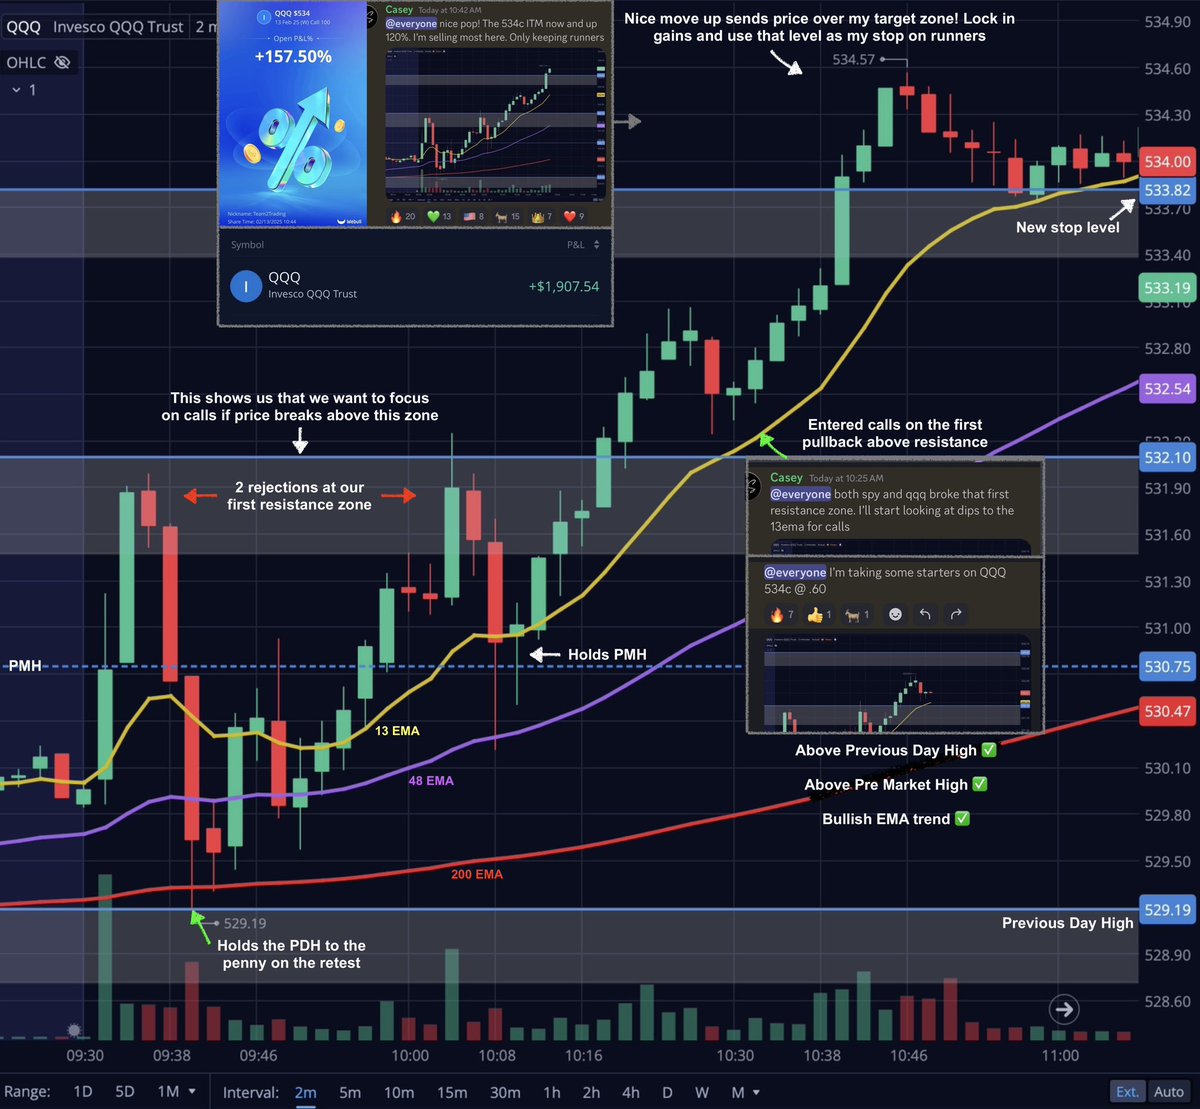
Perfect retest of the Previous Day High. Also has the 200 EMA support aligned.
Starts a strong Bullish EMA trend and I grab some calls on a dip.
It's the same technical setup for both longs or shorts.
14
If you want more examples check out my feed! I try to post at least 1 trade recap every day. As well as other little pieces of my trading strategy here and there.
Trading is hard! It took me 3+ years to find any type of consistency with it.
However, I do believe that threads like this one could have drastically speed up that process and shortened my learning curve!
So now that i'm doing well I like to take the time and create what I searched so hard for when I was struggling!
Thanks for reading... If it helps even 1 person in their trading journey it was well worth the time it took to make this thread 💚
Trading is hard! It took me 3+ years to find any type of consistency with it.
However, I do believe that threads like this one could have drastically speed up that process and shortened my learning curve!
So now that i'm doing well I like to take the time and create what I searched so hard for when I was struggling!
Thanks for reading... If it helps even 1 person in their trading journey it was well worth the time it took to make this thread 💚


