How to make $1000 a day trading $SPY & $QQQ 🧵 This is the mega...

Casey@Team2Trading
109 views
Dec 20, 2025
~5 min read
Advertisement
1
How to make $1000 a day trading $SPY & $QQQ 🧵
This is the mega thread you will be the only one you need...
I follow this exact strategy everyday to find trades like these week after week! 👇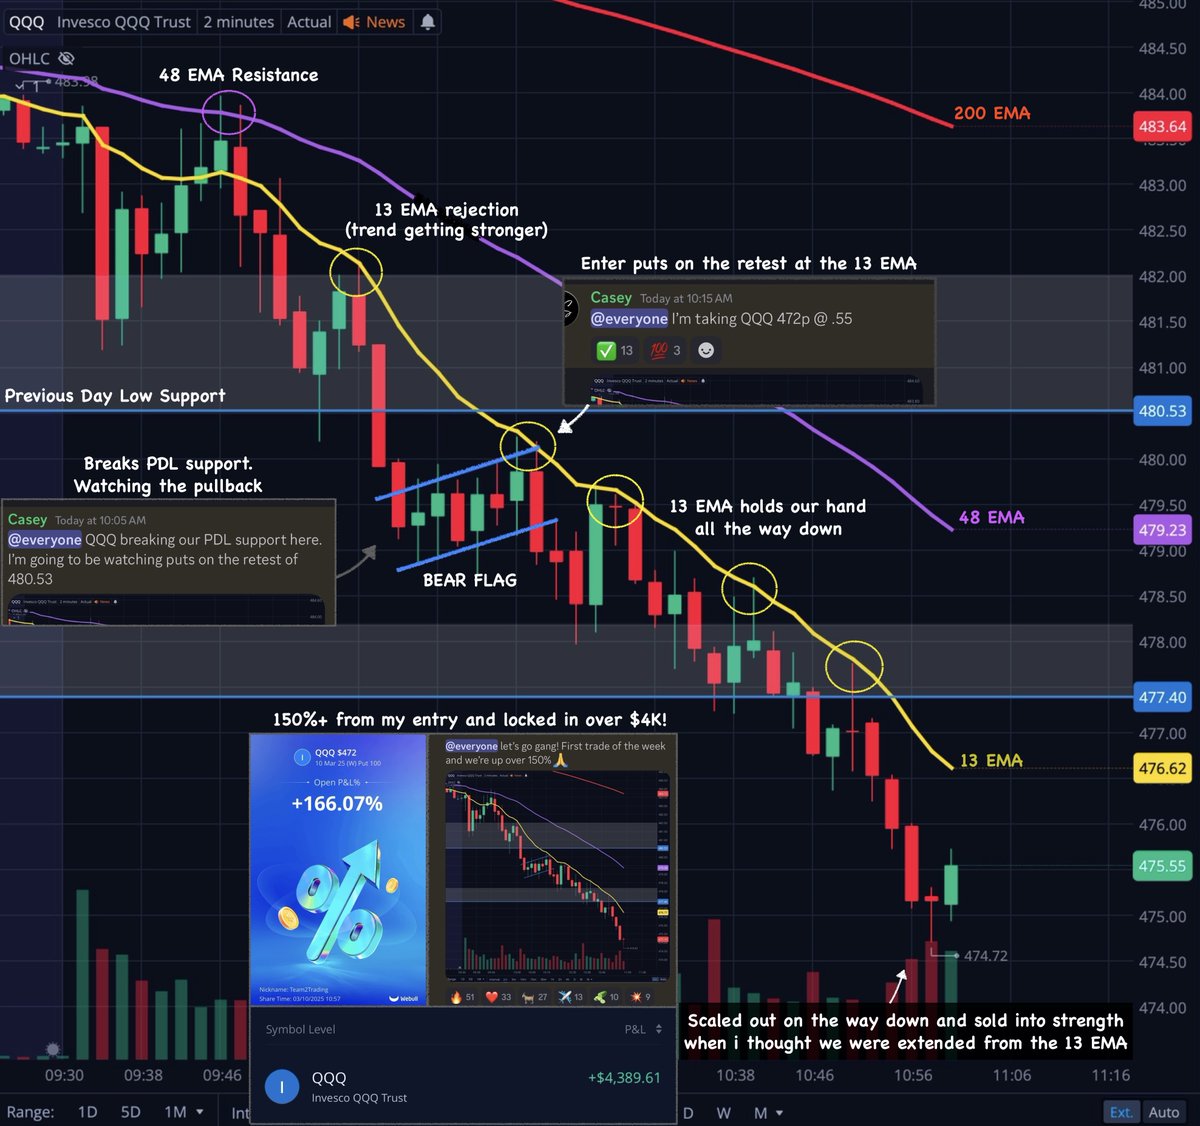
This is the mega thread you will be the only one you need...
I follow this exact strategy everyday to find trades like these week after week! 👇
2
#1 = The Previous Day High & Low zones!
Let's start with how to draw them, it's very simple...
(15 minute chart)
Previous Day High Zone = High of day wick to the following candle body ✅
Previous Day Low Zone = Low of day wick to the following candle body ✅
Visual example 👇
Let's start with how to draw them, it's very simple...
(15 minute chart)
Previous Day High Zone = High of day wick to the following candle body ✅
Previous Day Low Zone = Low of day wick to the following candle body ✅
Visual example 👇
3
How to utilize these zones...
These are the main areas of support & resistance I watch the following day.
This gives me 4 scenarios to watch for ⬇️
1️⃣ Break PDH = Focus on calls 📈
2️⃣ Reject PDH = Focus on puts 📉
3️⃣ Bounce PDL = Focus on calls 📈
4️⃣ Break PDL = Focus on puts 📉
*Note, I prefer to size down for scenarios 2 & 3 (Range Day) and size up for scenarios 1 & 4 (Expansion Day)
Visual example 👇
4
#2 = Follow the EMA trends!
Trading with the EMA trends makes it much easier to be on the right side of the move...
Here's the EMA's I use ⬇️
(2 minute chart)
13 EMA 🟡
48 EMA 🟣
200 EMA 🔴
Let's take a look at how to utilize these 👇
Trading with the EMA trends makes it much easier to be on the right side of the move...
Here's the EMA's I use ⬇️
(2 minute chart)
13 EMA 🟡
48 EMA 🟣
200 EMA 🔴
Let's take a look at how to utilize these 👇
5
Bullish EMA trend 📈
13 EMA on top 🟡
48 EMA in middle 🟣
200 EMA on bottom 🔴
Think of it like this ⬇️
Above 200 EMA = Bullish
Above 200 + 48 EMA = More Bullish
Above 200 + 48 + 13 EMA = Mega Bullish
Visual example 👇
13 EMA on top 🟡
48 EMA in middle 🟣
200 EMA on bottom 🔴
Think of it like this ⬇️
Above 200 EMA = Bullish
Above 200 + 48 EMA = More Bullish
Above 200 + 48 + 13 EMA = Mega Bullish
Visual example 👇
6
Bearish EMA trend 📉
200 EMA on top 🔴
48 EMA in middle 🟣
13 EMA on bottom 🟡
Reverse the thought process from above ⬇️
Under 200 EMA = Bearish
Under 200 + 48 EMA = More Bearish
Under 200 + 48 + 13 EMA = Mega Bearish
Visual example 👇
200 EMA on top 🔴
48 EMA in middle 🟣
13 EMA on bottom 🟡
Reverse the thought process from above ⬇️
Under 200 EMA = Bearish
Under 200 + 48 EMA = More Bearish
Under 200 + 48 + 13 EMA = Mega Bearish
Visual example 👇
7
#3 = Trade the flags!
Bull / Bear Flags are one of the most reliable chart patterns out there. I add them to my system for added confirmation.
The main focus is...
Bull Flags above the Previous Day High 📈
Bear Flags below the Previous Day Low 📉
So basically I am focusing on flags that align with the EMA trends and the 4 scenarios provided above.
Visual example 👇
8
You could trade any of these 3 techniques by themselves and probably find some decent success...
But letting 2 or 3 them come together into 1 trade gives you multiple confirmations and increases your win rate substantially!
Let's look at some examples of this 👇
But letting 2 or 3 them come together into 1 trade gives you multiple confirmations and increases your win rate substantially!
Let's look at some examples of this 👇
9
Let's start with a multiple confirmation trade to the downside on $QQQ 📉
Breaks Previous Day Low Support ✅
Strong Bearish EMA trend ✅
Bear Flagging into EMA ✅
This is what I am looking for in a high confidence trade to the downside 👇
Breaks Previous Day Low Support ✅
Strong Bearish EMA trend ✅
Bear Flagging into EMA ✅
This is what I am looking for in a high confidence trade to the downside 👇
10
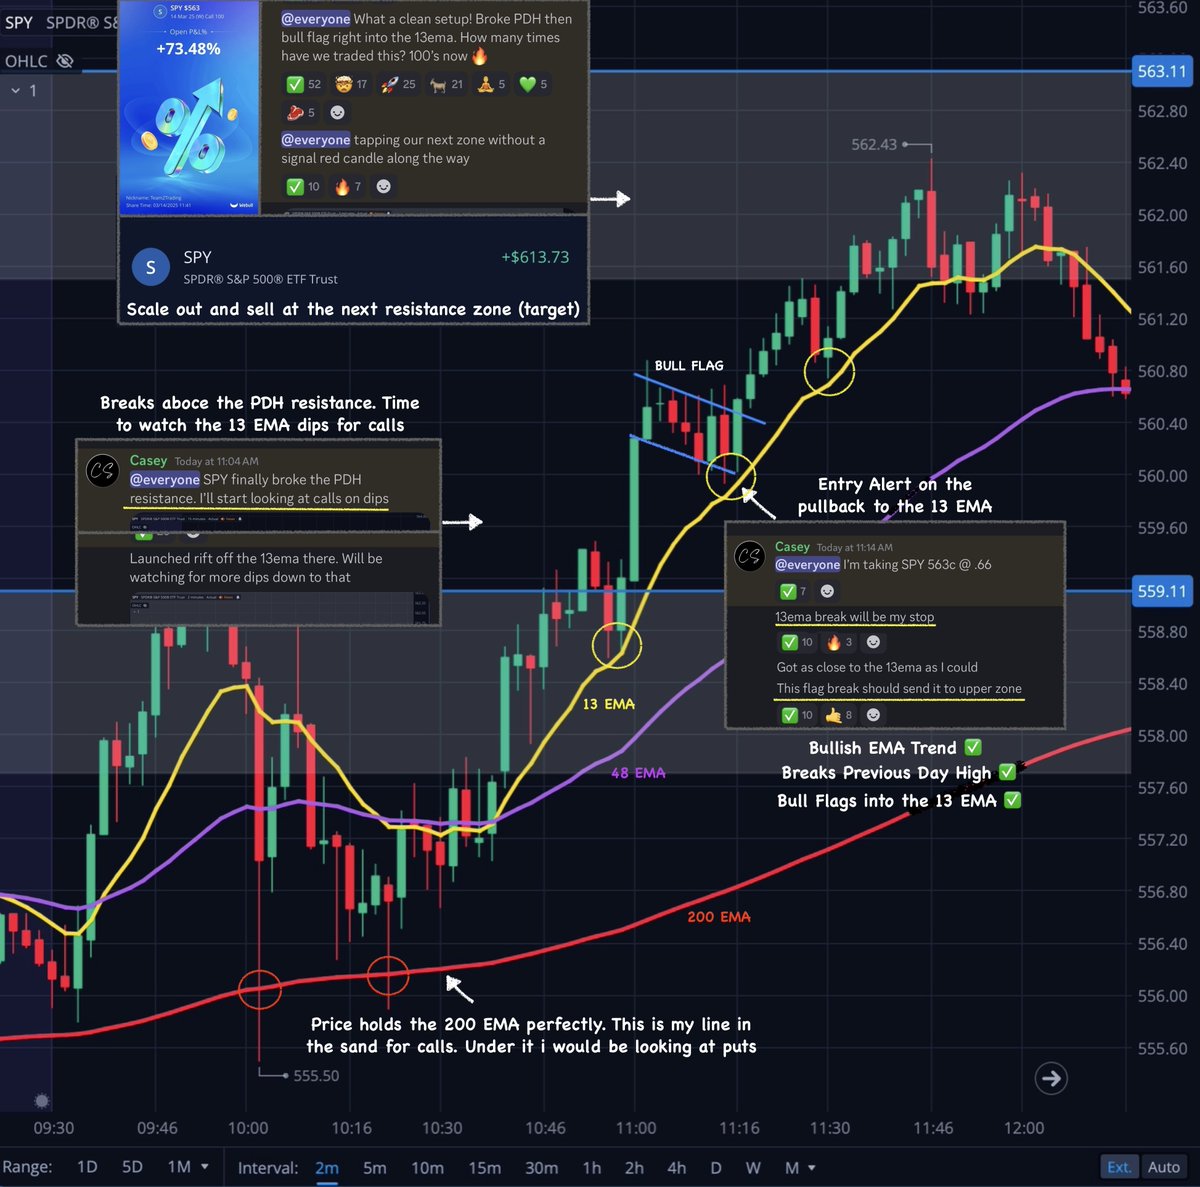
Now lets take a look at a multiple confirmation trade to the upside on $SPY 📈
Breaks Previous Day High Resistance ✅
Strong Bullish EMA trend ✅
Bull Flagging into EMA ✅
This is what I am looking for in a high confidence trade to the upside 👇
Breaks Previous Day High Resistance ✅
Strong Bullish EMA trend ✅
Bull Flagging into EMA ✅
This is what I am looking for in a high confidence trade to the upside 👇
11
Another trade to the upside here on $QQQ 📈
This would be scenario 3 from our example above with added confirmations ⬇️
Bounces off Previous Day Low ✅
Strong Bullish EMA trend ✅
Bull Flagging into EMA ✅
Everything working together to give you a high probability trade 👇
This would be scenario 3 from our example above with added confirmations ⬇️
Bounces off Previous Day Low ✅
Strong Bullish EMA trend ✅
Bull Flagging into EMA ✅
Everything working together to give you a high probability trade 👇
12
One last trade example to complete all 4 scenarios mentioned above...
Multiple confirmation trade to the downside on $SPY
Rejects Previous Day High ✅
Bearish EMA trend ✅
Bear Flagging into EMA ✅
All 3 confirmations coming together to create 1 high probably trade that you are confident to take 👇
Multiple confirmation trade to the downside on $SPY
Rejects Previous Day High ✅
Bearish EMA trend ✅
Bear Flagging into EMA ✅
All 3 confirmations coming together to create 1 high probably trade that you are confident to take 👇
13
Bonus tip...
Avoid trading areas on the chart where these EMA's get tight and bunched up ❌
There is usually no momentum in those areas creating choppy price action that causes many unnecessary losses!
Visual example of the difference 👇
Avoid trading areas on the chart where these EMA's get tight and bunched up ❌
There is usually no momentum in those areas creating choppy price action that causes many unnecessary losses!
Visual example of the difference 👇
14
Bonus tip...
Mark the Pre Market High & Low (4am - 9:30am EST) everyday before open.
These are great additional levels to watch for possible entry points into trades.
(Try to avoid trading inside of that Pre Market High & Low range) That is often an area where price tends to be choppy!
* I do make certain exceptions to this rule if I really like the setup. But newer traders should avoid it completely.
Visual example of choppy price action 👇
15
Ending notes...
The goal is to only risk your hard earned money on high quality setups that are both repeatable and easy for you to identify!
The set of rules I just went over gives me exactly what I need to do that if I just stay patient & follow my system.
Start small and aim for consistency!
Before you can start hitting those $1,000 days you need to show yourself you can hit consistent $100 days.
16
Thank you for taking the time to read this thread!
Hopefully you leave with a little more knowledge than you came in with. And maybe even a new A+ setup or two you can keep an eye on next week 💚
My current March results posted below 👇
Hopefully you leave with a little more knowledge than you came in with. And maybe even a new A+ setup or two you can keep an eye on next week 💚
My current March results posted below 👇
17
March stats so far...
18 total trade alerts 🚨
14 profitable wins ✅
4 unprofitable losses ❌
Win rate = 78% 🎯
$SPY +210% ✅
$SPY +200% ✅
$QQQ +190% ✅
$QQQ +160% ✅
$QQQ +150% ✅
$SPY +110% ✅
$IWM +100% ✅
$IWM +100% ✅
$SPY +75% ✅
$SPY +60% ✅
$SPY +40% ✅
$SPY +35% ✅
4 losses that ranged between -20% & -40% depending on how quickly I exit upon my stop level breaking ❌


