Using Previous Day Values for Bias: a thread 🧵

Luckshury@Luckshuryy
43 views
Apr 23, 2025
~2 min read
Advertisement
1
Using Previous Day Values for Bias:
a thread 🧵
a thread 🧵
2
Previous day sweeps:
monitor above & below previous day for excess in:
- volume
- liquidations
- trapped traders in general
recognising a sweep above/below the previous day can help you get on the right side of a newly forming engulfing candle.
monitor above & below previous day for excess in:
- volume
- liquidations
- trapped traders in general
recognising a sweep above/below the previous day can help you get on the right side of a newly forming engulfing candle.
3
Price vs. previous day:
where is current price in relation to previous day, is it above or below previous days highs/lows.
If it is above previous day for example, then monitor the strength of that trend above previous day's high.
When monitoring the trend check for:
- strength in relative volume (for continuation)
- aggressive OI increase, as if price reverses away from these positions could fuel for a large reversal back into pd values.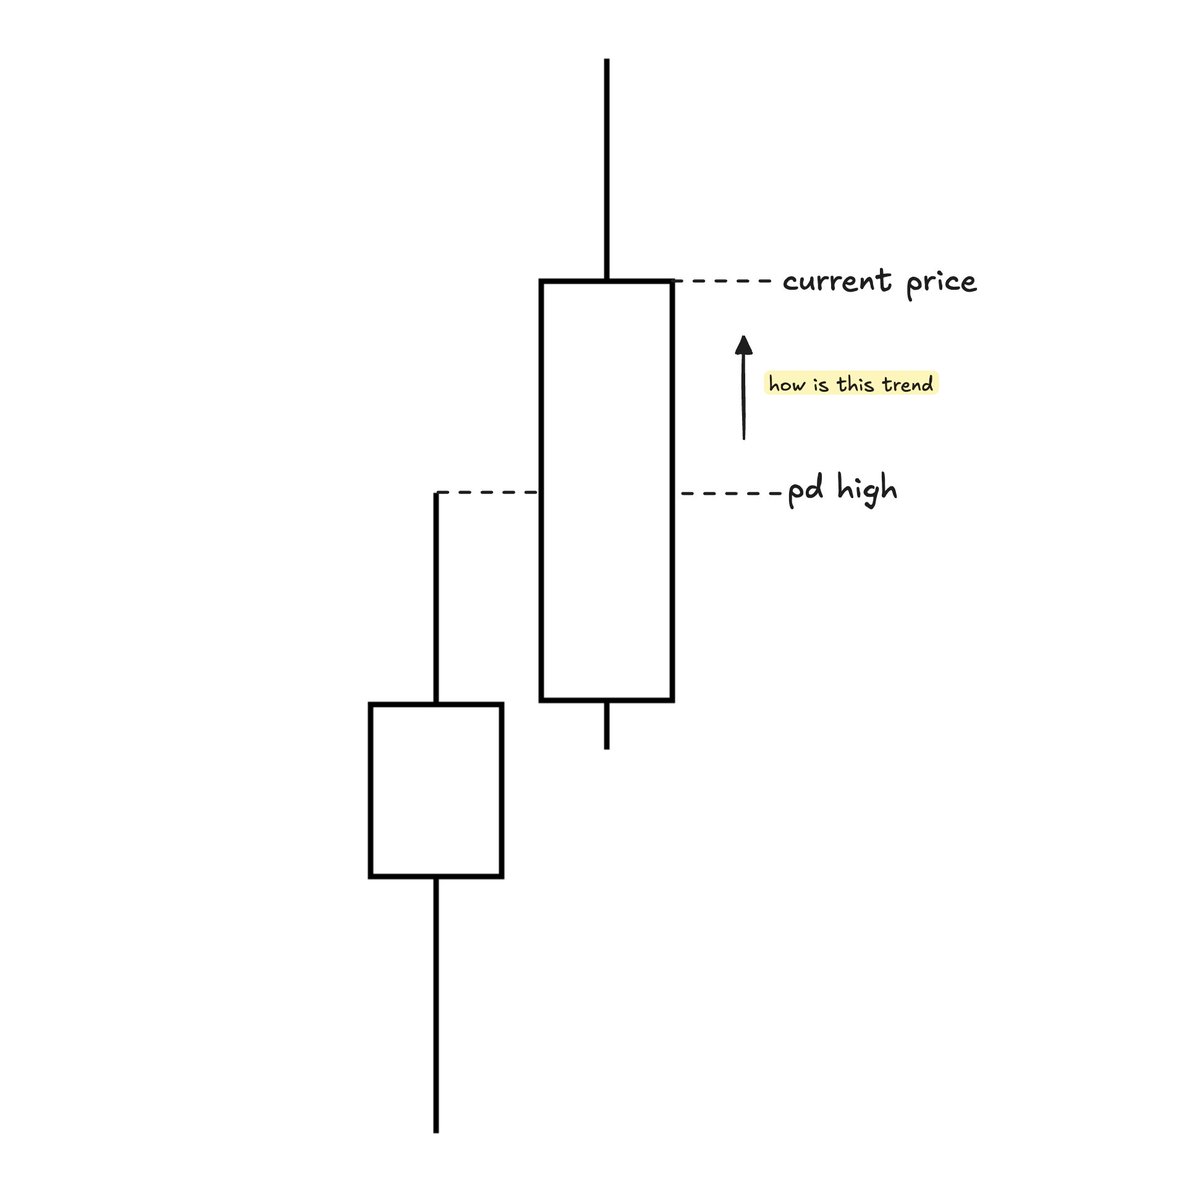
where is current price in relation to previous day, is it above or below previous days highs/lows.
If it is above previous day for example, then monitor the strength of that trend above previous day's high.
When monitoring the trend check for:
- strength in relative volume (for continuation)
- aggressive OI increase, as if price reverses away from these positions could fuel for a large reversal back into pd values.
4
Wick fills:
Does previous day have a large wick either to the downside or the upside.
If yes, I look for that large wick to see at least a partial fill. Note, this can date back a few days, not just the previous day.
These large wick fills can act as magnets to price, allowing me to look for trades in the direction of the wick fill.
[works especially well when the market is aggressively trending]
example ↓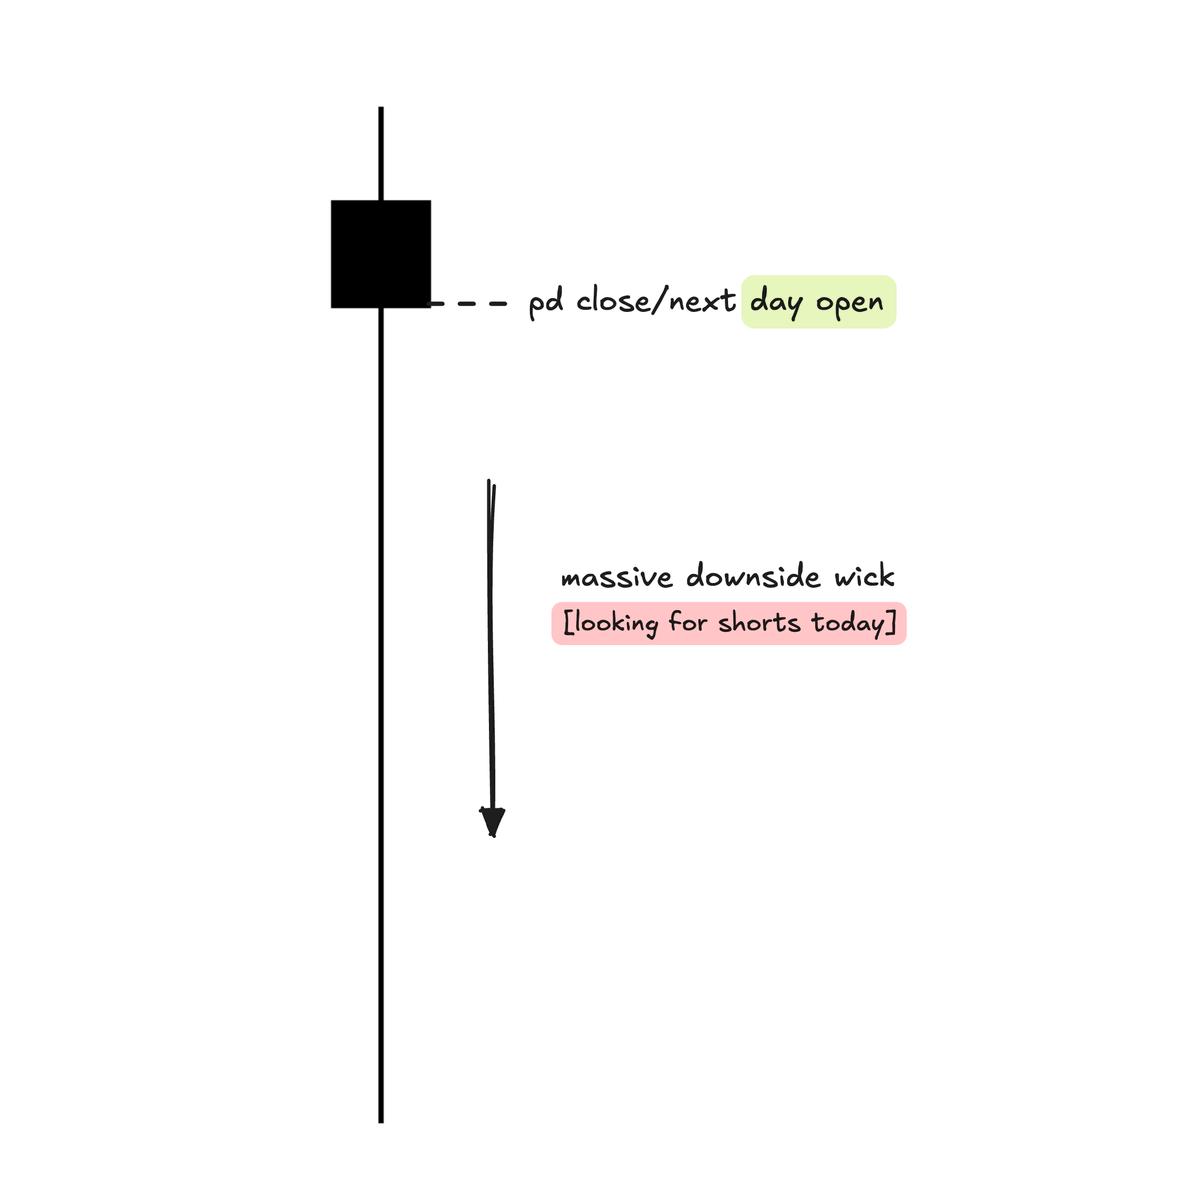
Does previous day have a large wick either to the downside or the upside.
If yes, I look for that large wick to see at least a partial fill. Note, this can date back a few days, not just the previous day.
These large wick fills can act as magnets to price, allowing me to look for trades in the direction of the wick fill.
[works especially well when the market is aggressively trending]
example ↓
5
Clean pivots:
Zoom in on previous day's highs/lows to identify any weak pivots that can be revisited.
A weak pivot can be identified as a poor high/low on that day.
These are more common during weekend price action, particularly on Saturdays.
example ↓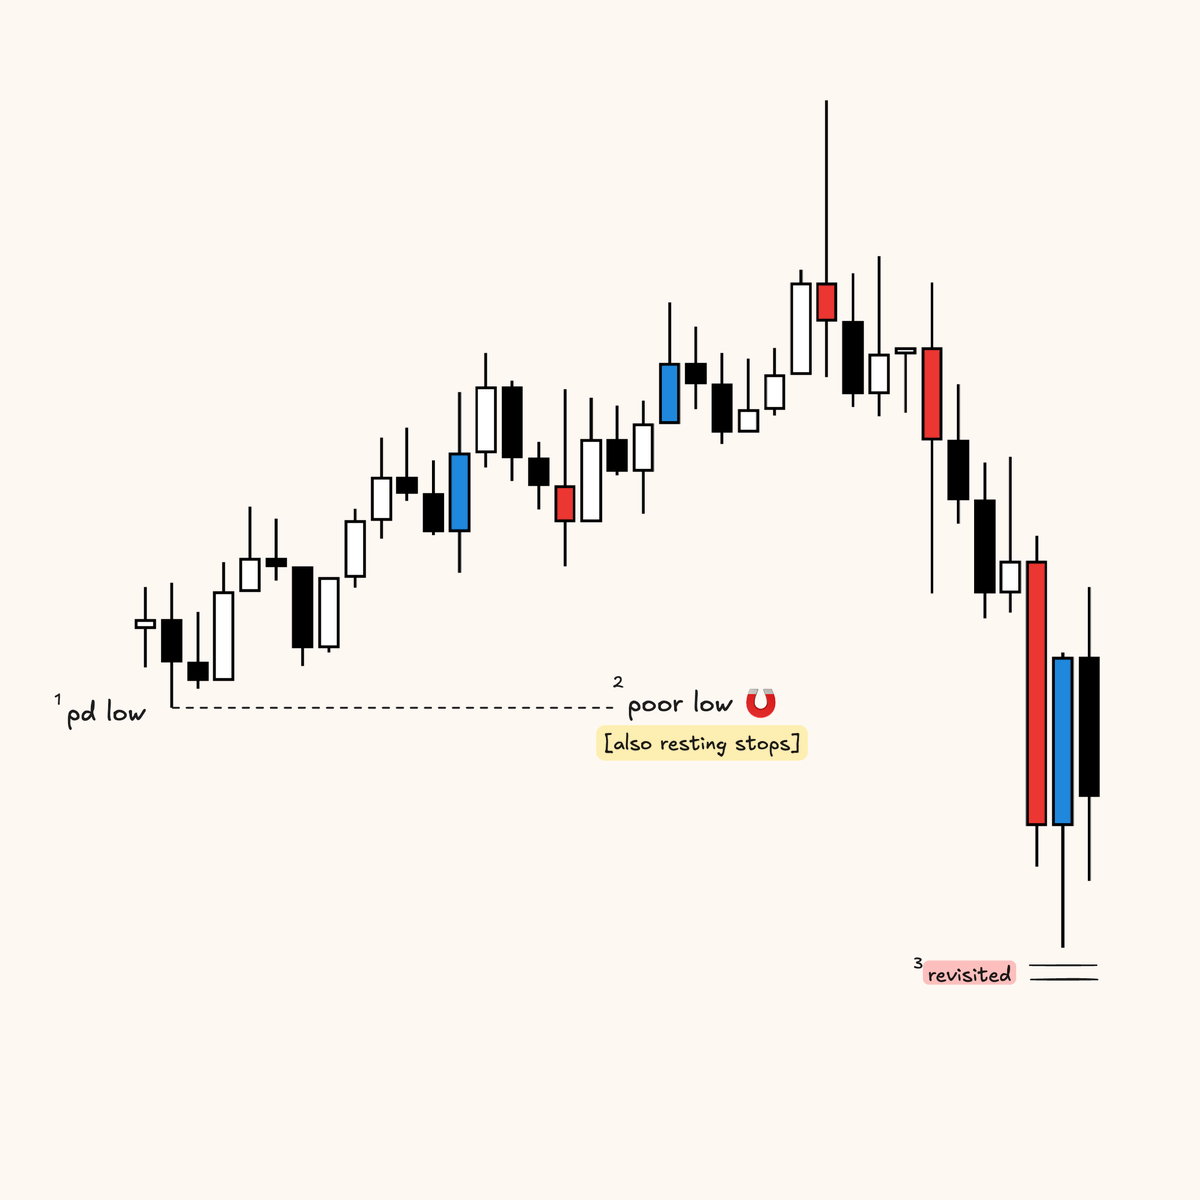
Zoom in on previous day's highs/lows to identify any weak pivots that can be revisited.
A weak pivot can be identified as a poor high/low on that day.
These are more common during weekend price action, particularly on Saturdays.
example ↓
6
Tools:
I use this key levels indicator by Leviathan to automatically mark out tonnes of previous day/week/month levels.


I use this key levels indicator by Leviathan to automatically mark out tonnes of previous day/week/month levels.
Leviathan@leviathancrypto
Key Levels indicator is published!
You can generate 100+ different levels:
• HTF levels
• POC/VAH/VAL levels
• VWAP levels
• SMA/EMA levels
• Market session levels
• Day of week levels
It's free. Link below.
You can generate 100+ different levels:
• HTF levels
• POC/VAH/VAL levels
• VWAP levels
• SMA/EMA levels
• Market session levels
• Day of week levels
It's free. Link below.
7
Currently building @EntropiaTrading where we will be bringing a stats based edge to your trading - follow to keep up to date with details.
Free resources - check my pinned post:
- Youtube
- Newsletter
- Free Exocharts
likes/reposts on the original post are appreciated.
Free resources - check my pinned post:
- Youtube
- Newsletter
- Free Exocharts
likes/reposts on the original post are appreciated.