Volume Profile [updated] - a clear guide a thread 🧵

Luckshury@Luckshuryy
81 views
Aug 16, 2026
~3 min read
Advertisement
1
Volume Profile [updated] - a clear guide
a thread 🧵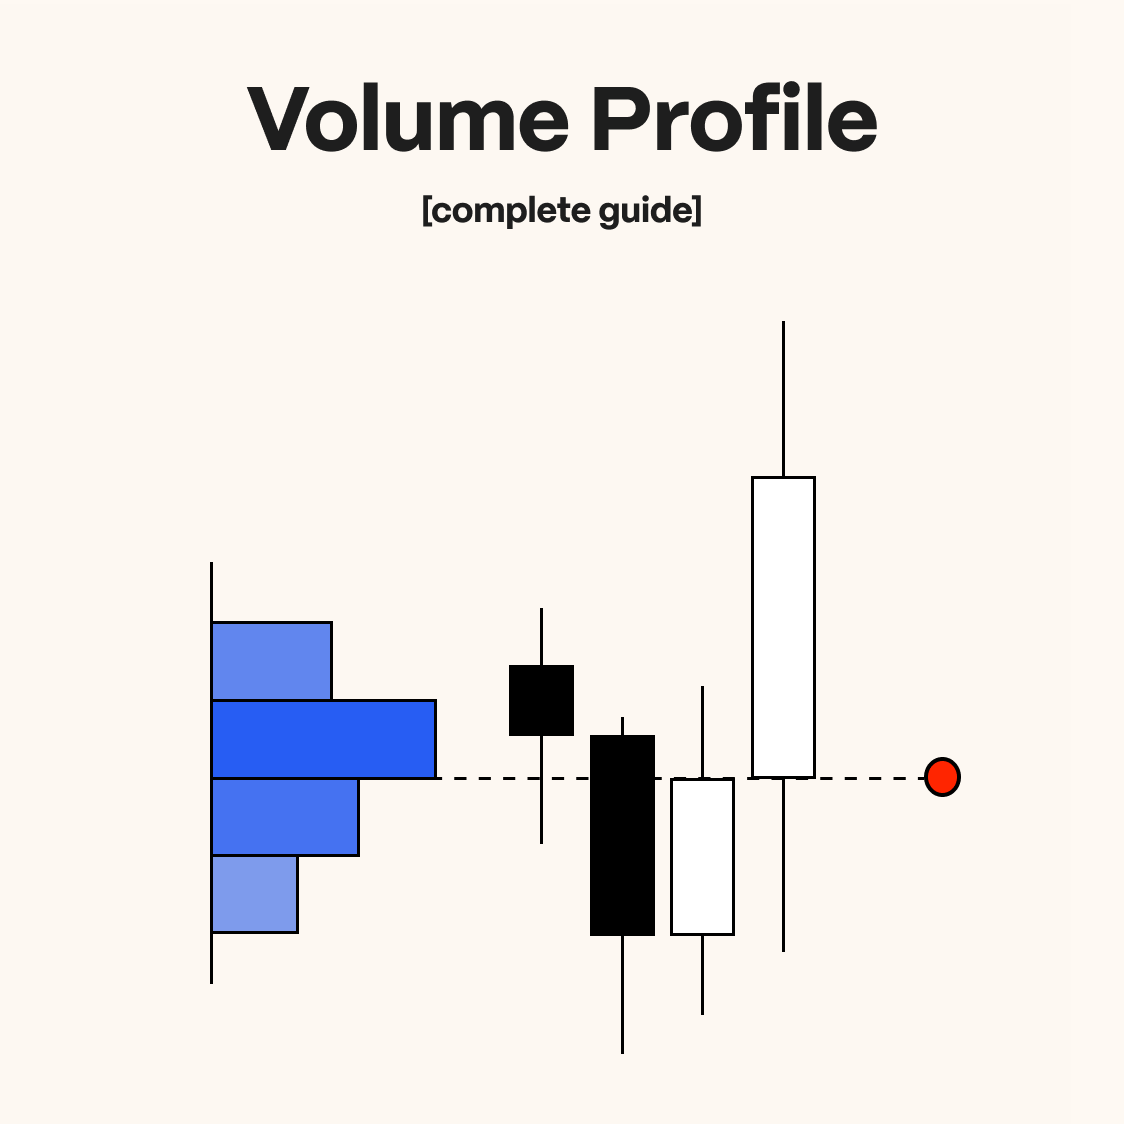
a thread 🧵
2
1. Volume Profile Explained
Most volume tools will identify WHEN volume is coming in, whereas a profile will show at which price level volume has been transacted.
This is key as you can use that volume to determine where potential positions will defend/protect a level.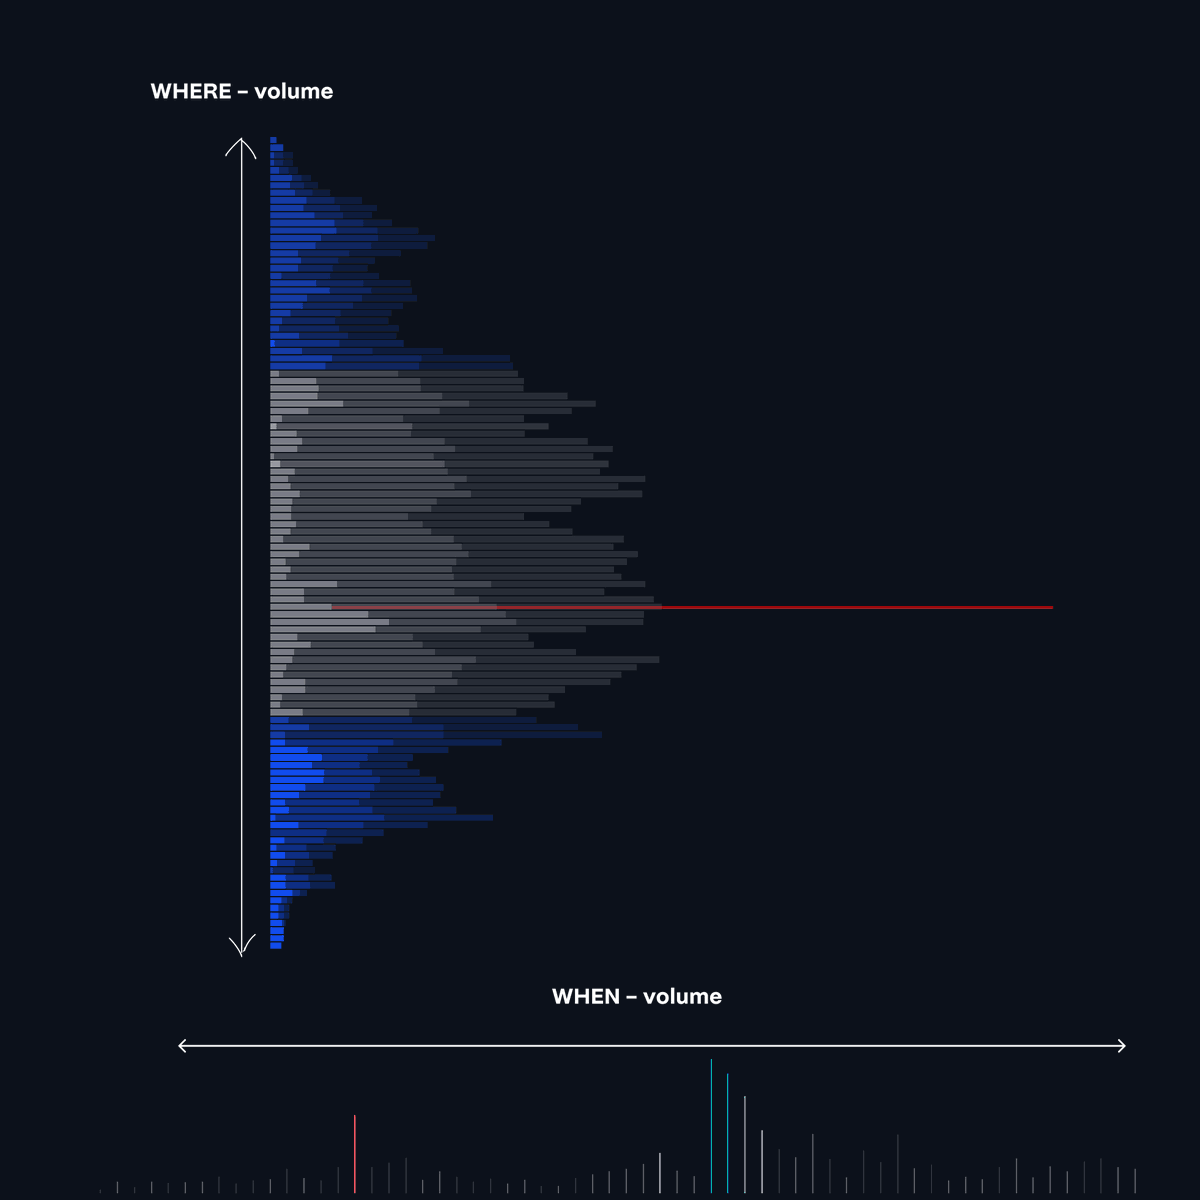
Most volume tools will identify WHEN volume is coming in, whereas a profile will show at which price level volume has been transacted.
This is key as you can use that volume to determine where potential positions will defend/protect a level.
3
2. Positioning
Volume profiles will show volume transacted and NOT whether that volume is assigned to newly opened or closed positions.
Regardless, regions of high volume would have had previous interest, thus there is likely to be both new positions & closed positions.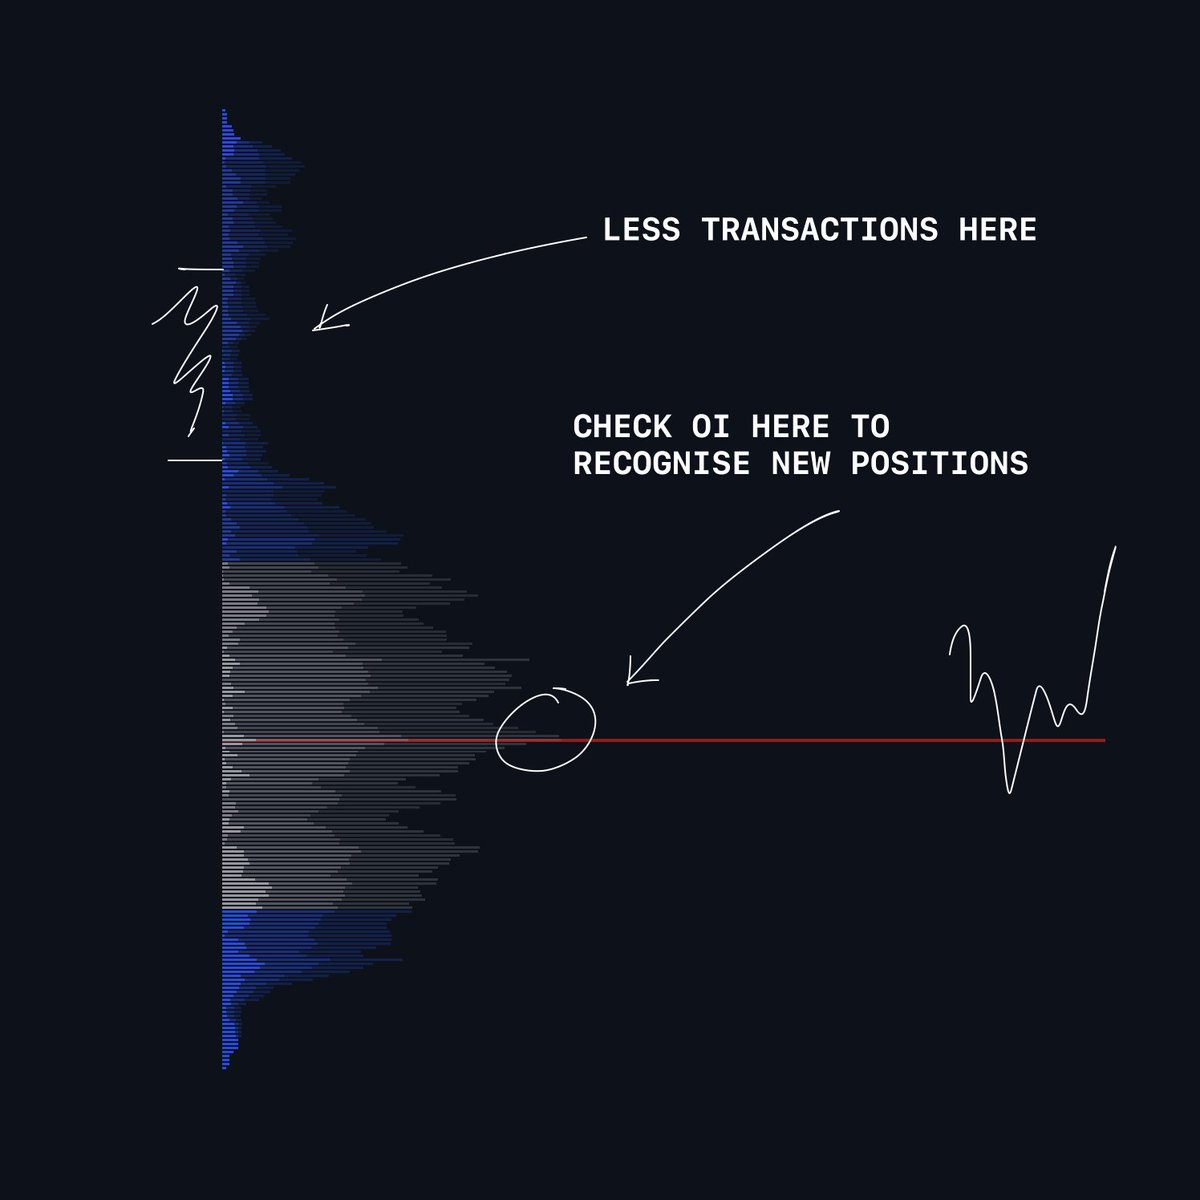
Volume profiles will show volume transacted and NOT whether that volume is assigned to newly opened or closed positions.
Regardless, regions of high volume would have had previous interest, thus there is likely to be both new positions & closed positions.
4
3. Placement
You tend to see fixed volume profiles, usually on the daily, weekly, monthly timeframes; those are just some.
You can also pull through the TV fixed range tool:
Via your own judgment of where a range or trend may be to identify those specific market participants.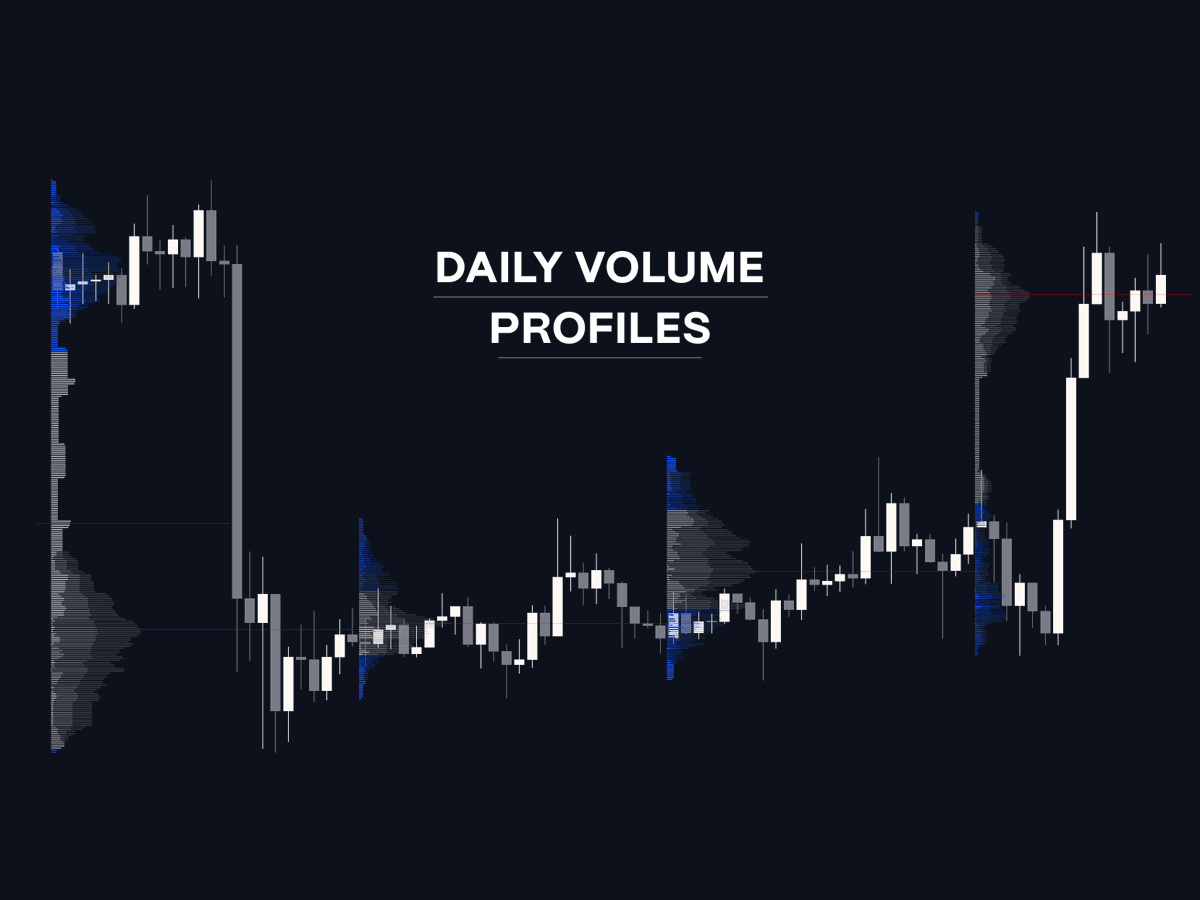
You tend to see fixed volume profiles, usually on the daily, weekly, monthly timeframes; those are just some.
You can also pull through the TV fixed range tool:
Via your own judgment of where a range or trend may be to identify those specific market participants.
5
4. Where to place
Ranges - Use volume profile tool after impulse for range formation. Start pull from first down candle if price is rising; vice versa.
Trends - Pull from start of trending move to find key POIs in case of price retracement.
Ranges - Use volume profile tool after impulse for range formation. Start pull from first down candle if price is rising; vice versa.
Trends - Pull from start of trending move to find key POIs in case of price retracement.
6
5. Basic components
POC - point of control; the point in which the most volume has occurred within that profile.
VA - value area; VAH/VAL (value area high/low) where a significant % of volume is concentrated (% chosen by user).
I use 68% for my VA.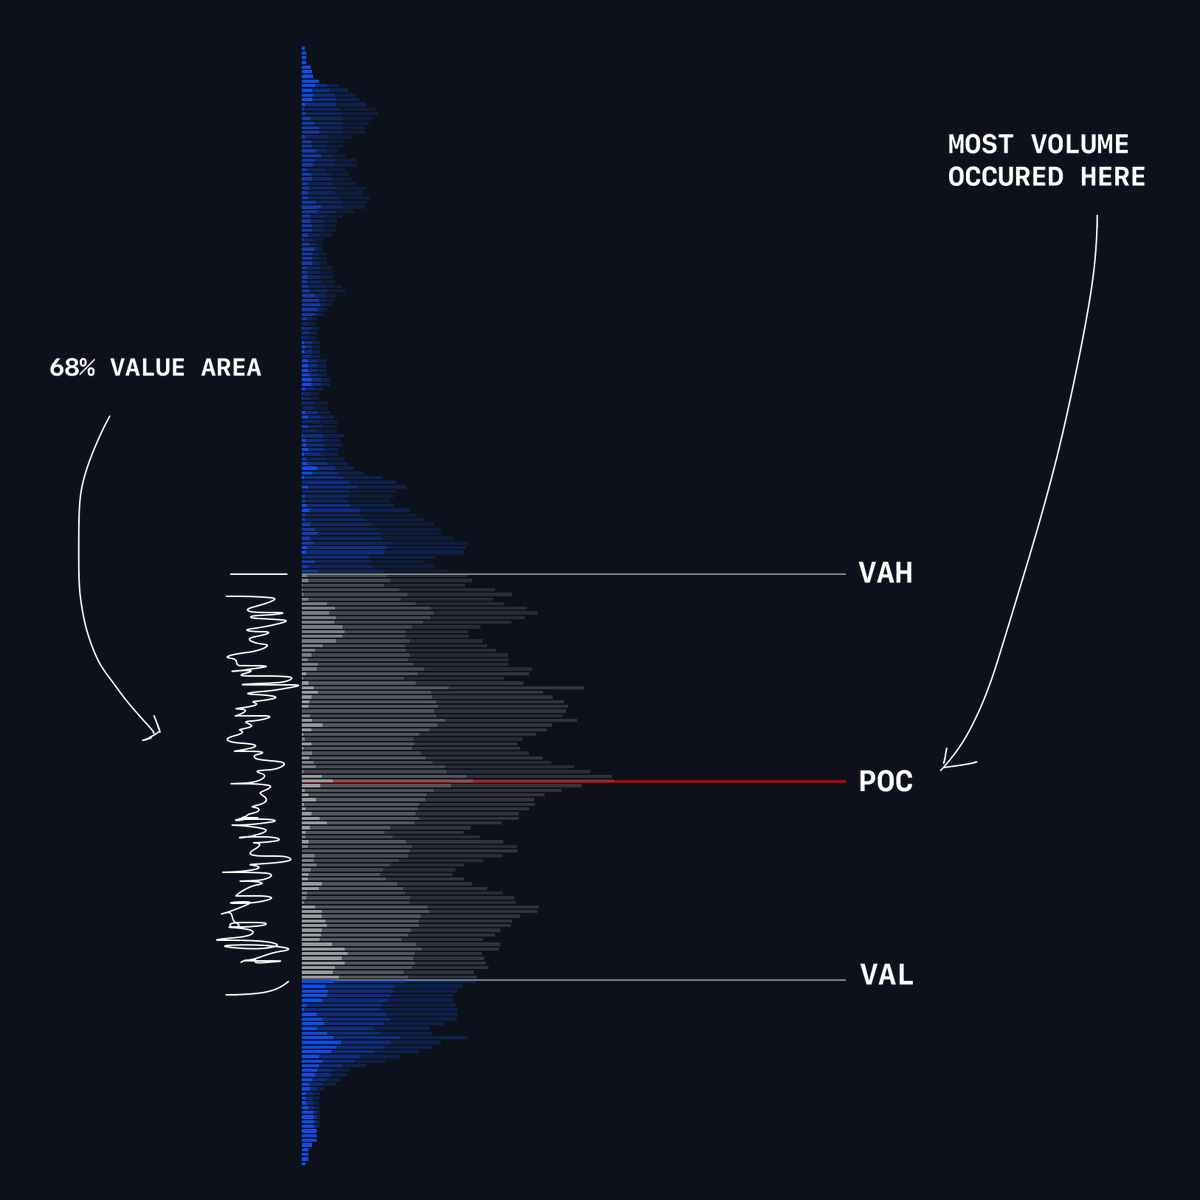
POC - point of control; the point in which the most volume has occurred within that profile.
VA - value area; VAH/VAL (value area high/low) where a significant % of volume is concentrated (% chosen by user).
I use 68% for my VA.
7
6. High volume nodes
These places have high volume but are not the highest like the POC is.
The POC is the highest point of volume in the profile, but other high points can be useful references too.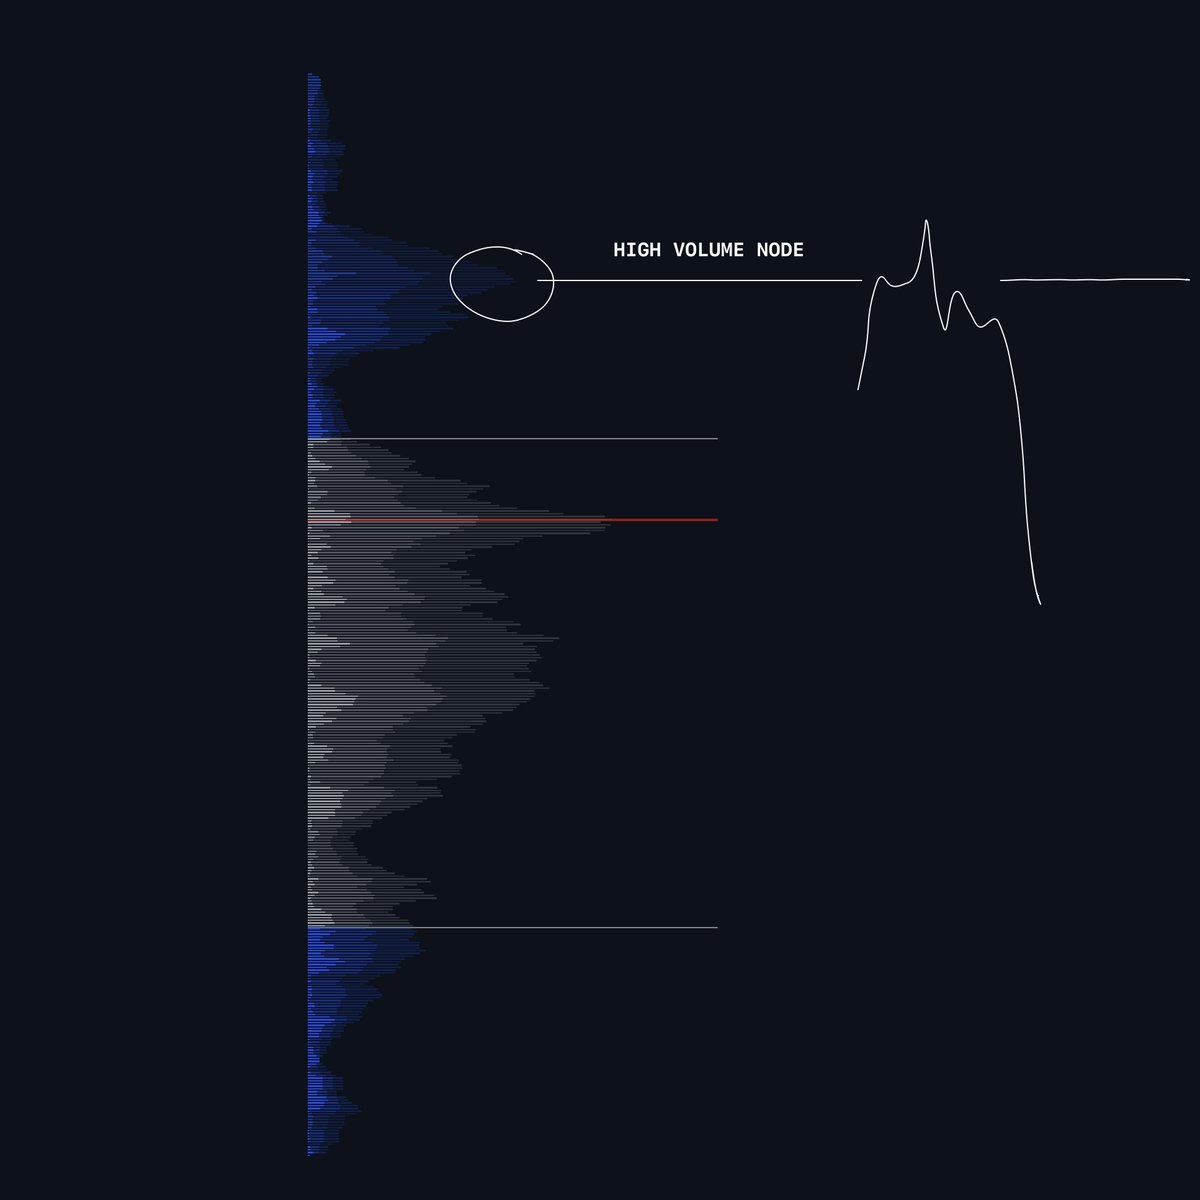
These places have high volume but are not the highest like the POC is.
The POC is the highest point of volume in the profile, but other high points can be useful references too.
8
7. Gaps in the Volume Profile
Gaps in the Volume Profile occur where there is low to no volume. The amount of low volume is determined on a case-by-case basis.
Below is an example ↓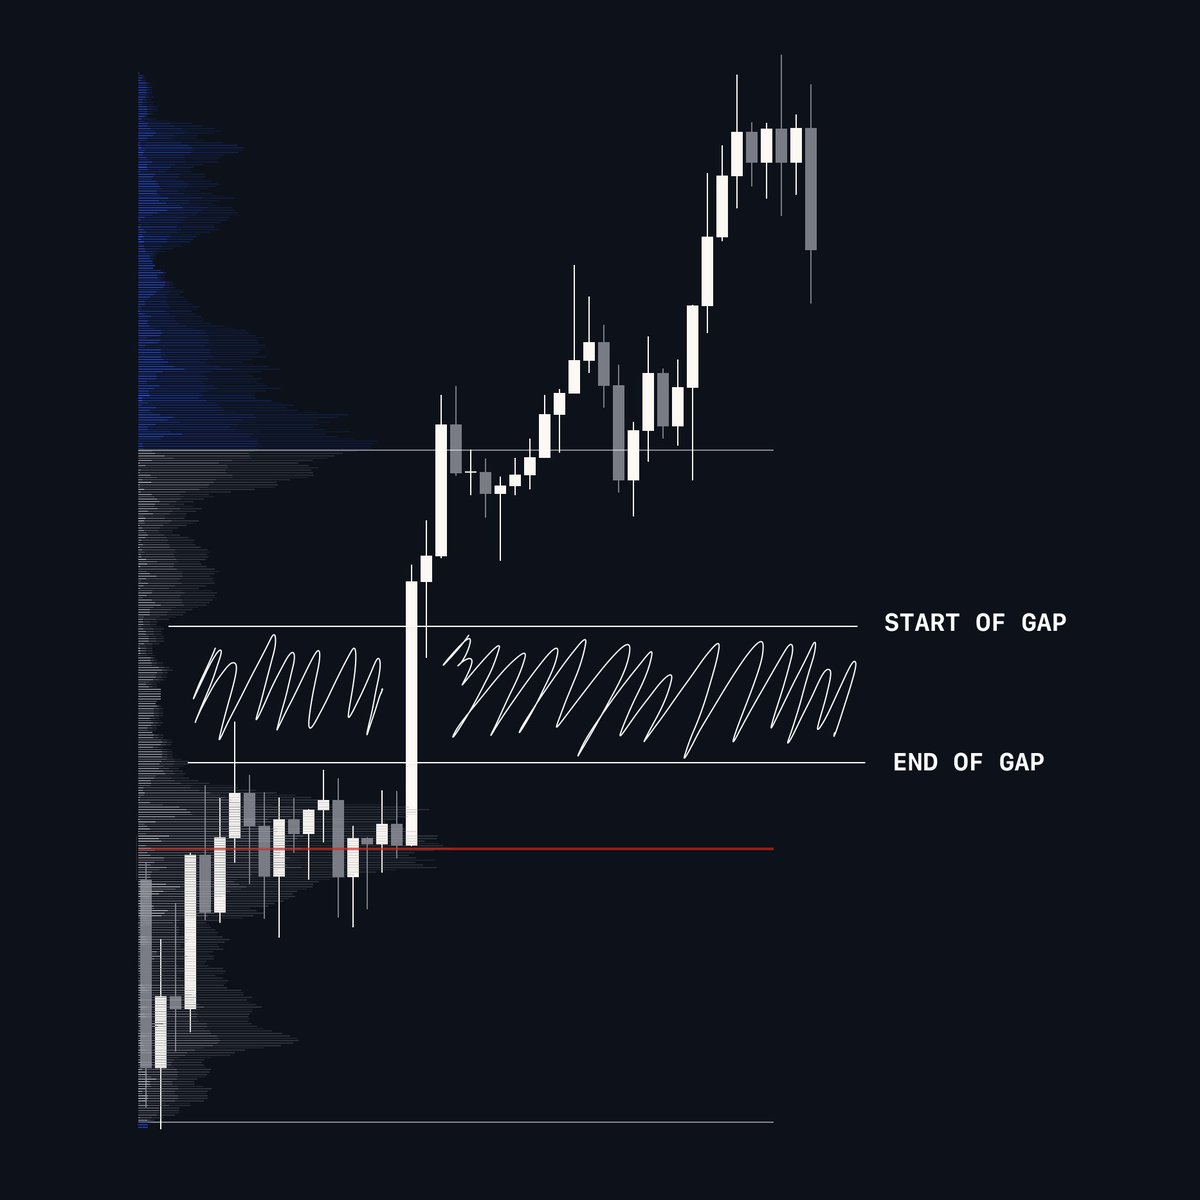
Gaps in the Volume Profile occur where there is low to no volume. The amount of low volume is determined on a case-by-case basis.
Below is an example ↓
9
Gaps [2]
These gaps have contextual use cases and provide levels of interest.
2 components that provide POI:
- start of a gap
- end of a gap
Contextual use case:
Should price gain acceptance into the gap, it could experience a quick run through the low-volume zone.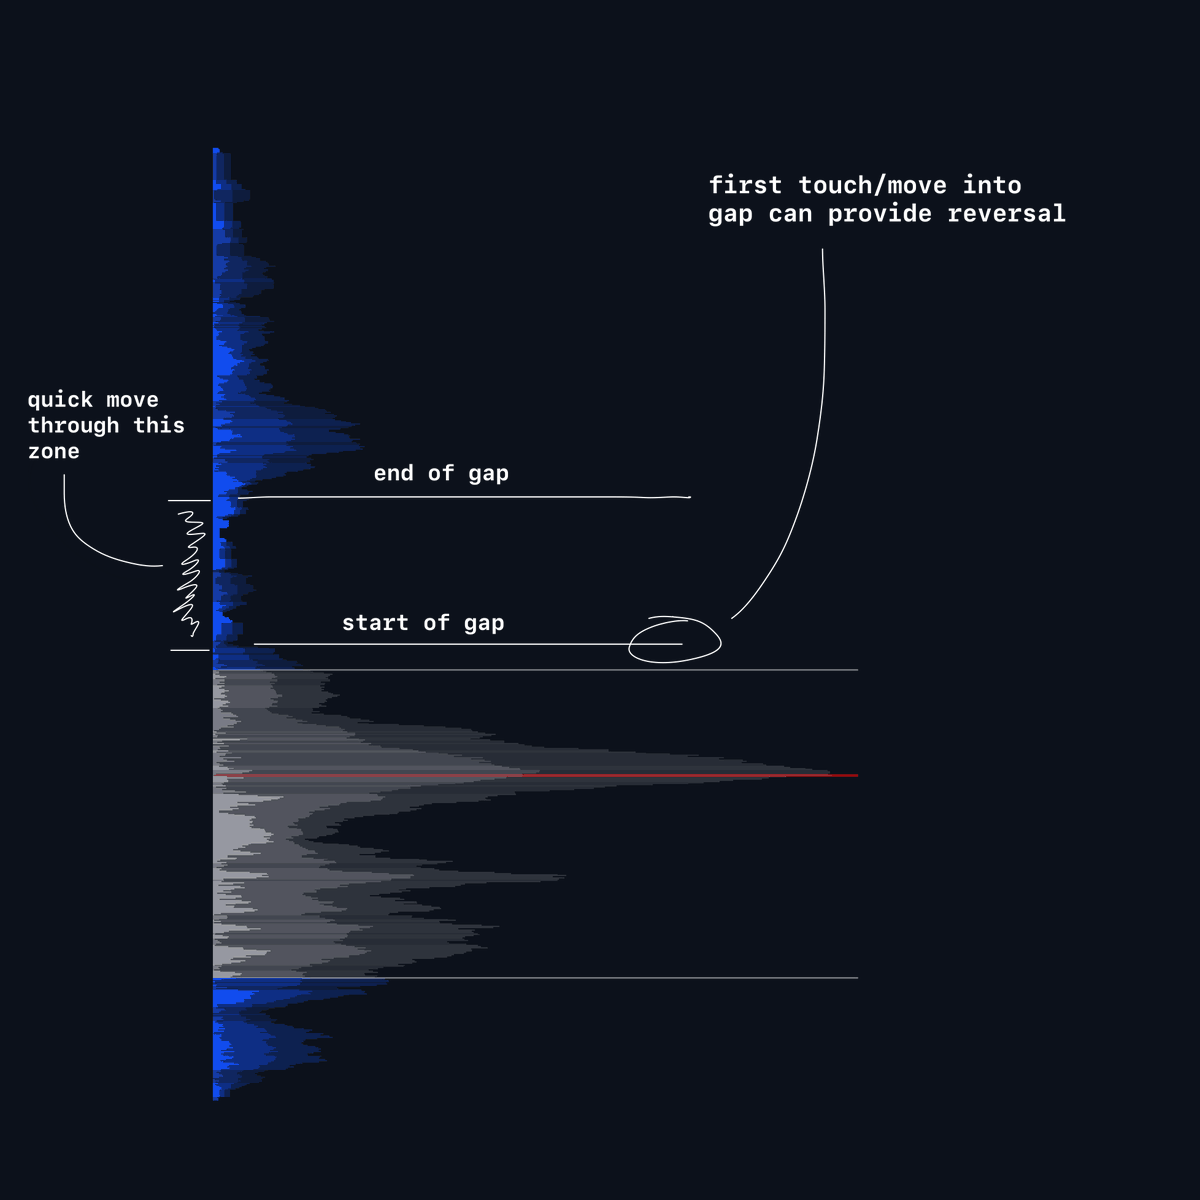
These gaps have contextual use cases and provide levels of interest.
2 components that provide POI:
- start of a gap
- end of a gap
Contextual use case:
Should price gain acceptance into the gap, it could experience a quick run through the low-volume zone.
10
8. Trend weakness/continuation
Analysing volume profile in trends helps identify weaknesses when high volume nodes or POCs are lost or reclaimed.
Also can be used as support/resistance levels for trend continuations.
Analysing volume profile in trends helps identify weaknesses when high volume nodes or POCs are lost or reclaimed.
Also can be used as support/resistance levels for trend continuations.
11
9. Naked POCs
POCs and HVNs serve as the best potential s/r levels, particularly when tested within 1-2 days of being left untapped.
Why?
These POCs/HVNs are likely to be defended due to significant transactions and potential open positions that remain from these levels.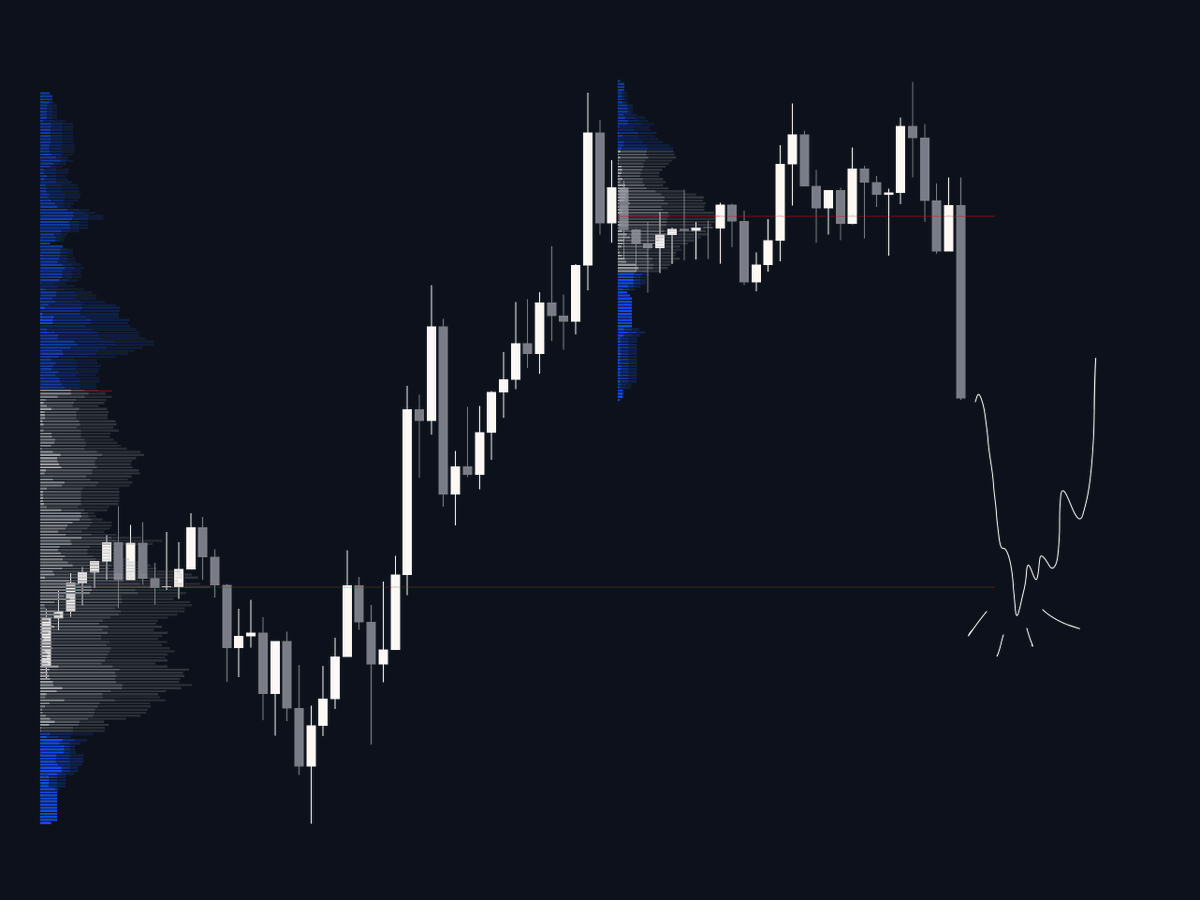
POCs and HVNs serve as the best potential s/r levels, particularly when tested within 1-2 days of being left untapped.
Why?
These POCs/HVNs are likely to be defended due to significant transactions and potential open positions that remain from these levels.
12
Naked POCs [2]
Also on lower time frames also can be powerful especially when price runs into multiple clusters at once.
Using the 30m chart to look for naked POCs within those candles is extremely useful, the best ones are where you have multiple POCs before a gap.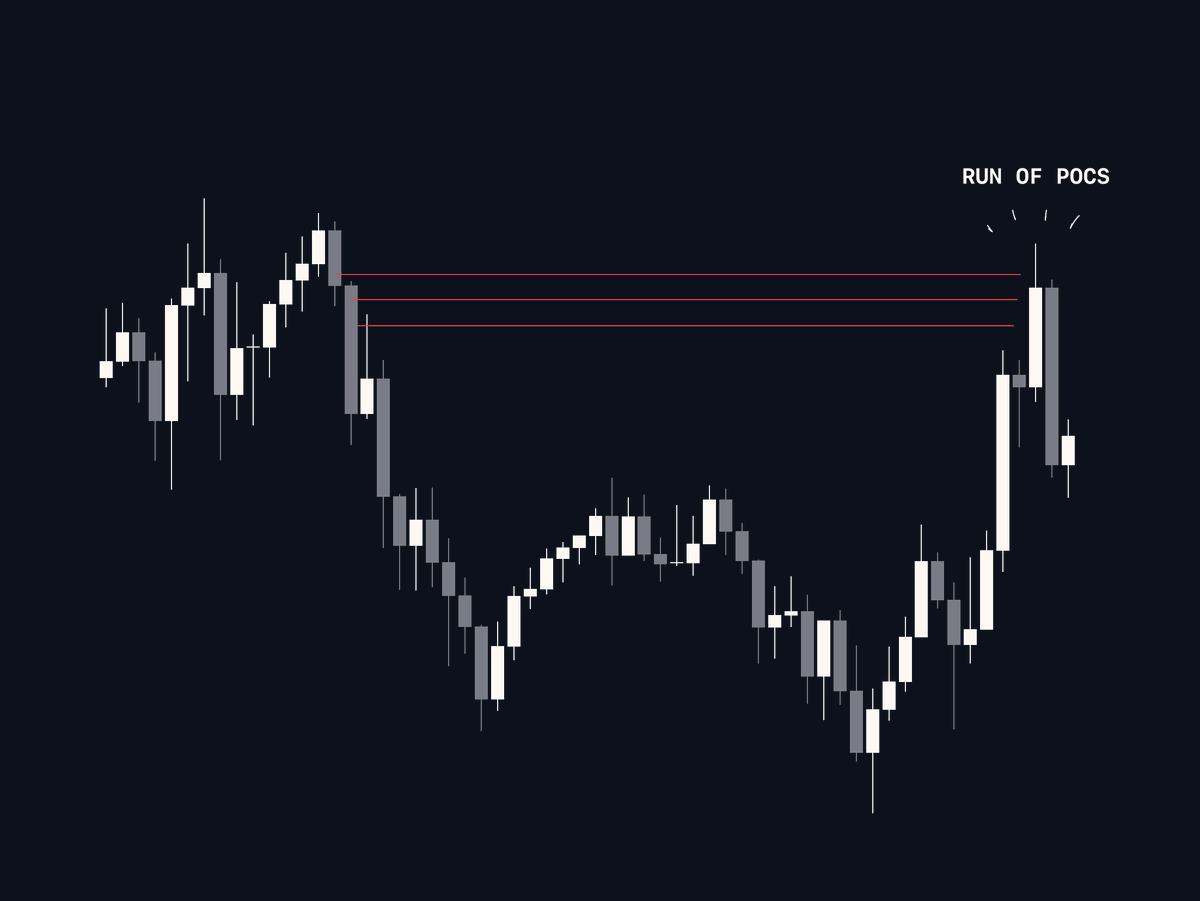
Also on lower time frames also can be powerful especially when price runs into multiple clusters at once.
Using the 30m chart to look for naked POCs within those candles is extremely useful, the best ones are where you have multiple POCs before a gap.
13
Tools
TV has a build in - session volume profile (for daily & custom sessions)
@leviathancrypto has some great tools for analysing ranges and volume profiles in general such as: range analysis tool & open interest profile.
Below are my settings for session volume profile ↓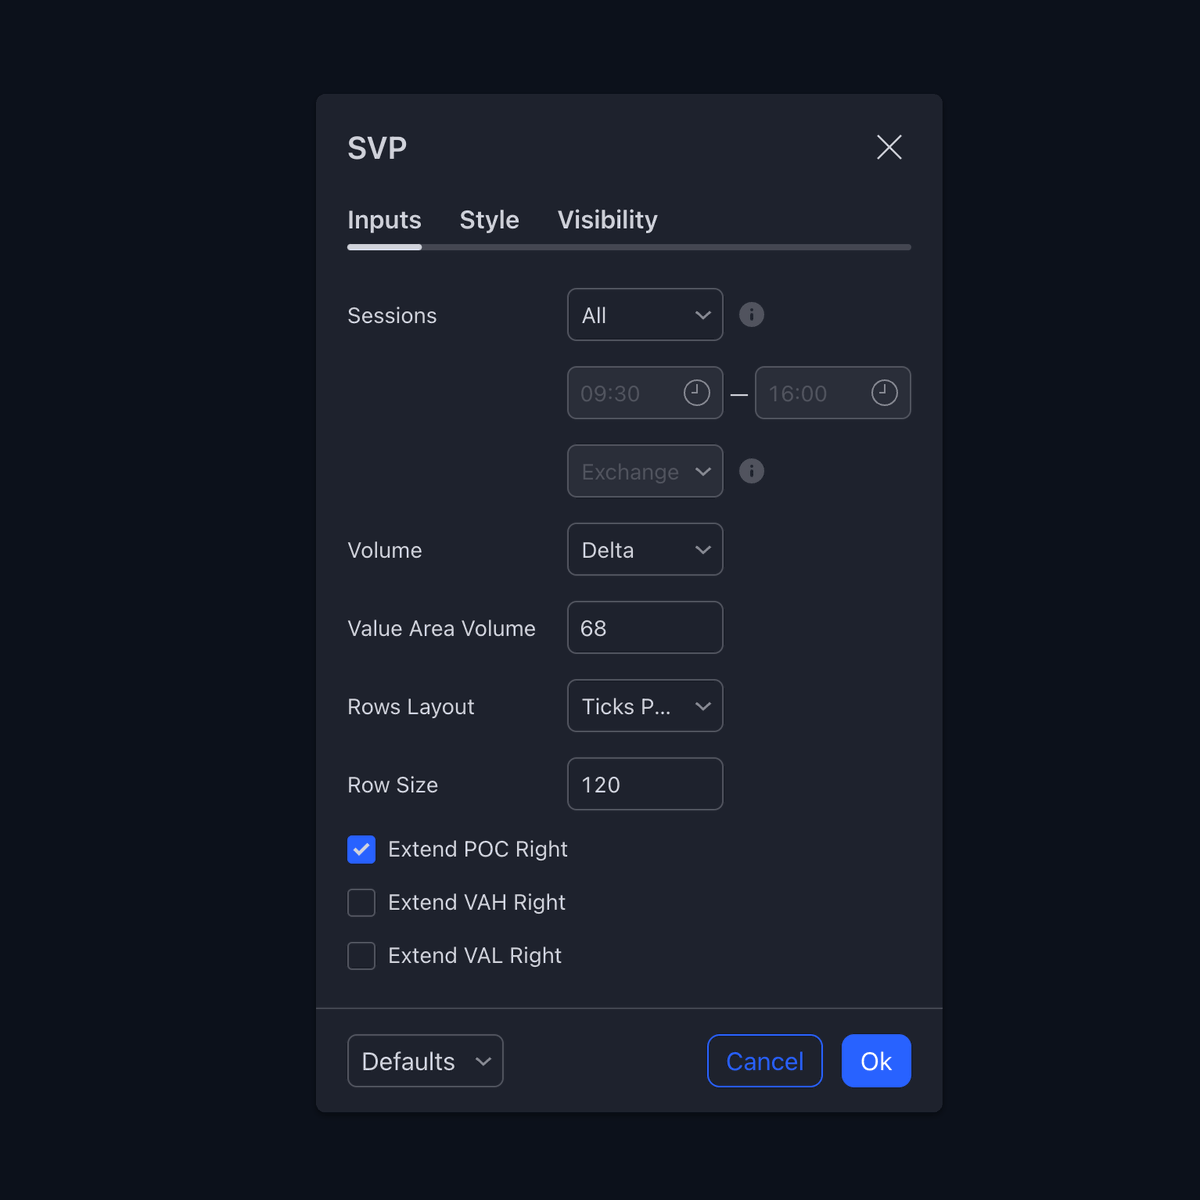
TV has a build in - session volume profile (for daily & custom sessions)
@leviathancrypto has some great tools for analysing ranges and volume profiles in general such as: range analysis tool & open interest profile.
Below are my settings for session volume profile ↓
14
Hope you found some value in this thread, likes & reposts are greatly appreciated, let me know below if you have any questions.
For all the resources I use check my pinned post (everything free).
For all the resources I use check my pinned post (everything free).