Alright, here's how to time tops almost perfectly or at the very...

jack@jacknuked
12 views
Dec 20, 2024
~4 min read
Advertisement
1
Alright, here's how to time tops almost perfectly or at the very least, exit at a local high.
Short thread on how i exit local tops before a rapid retrace takes place, making sure i don't baghold a 80% downside move
Short thread on how i exit local tops before a rapid retrace takes place, making sure i don't baghold a 80% downside move
2
Now first of all i'm gonna clarify this is for higher caps specifically because that's where you need a solid exit strategy on your trades, i'm not going around and using this on my 0.1e position on a 15k mc coin ok lmfao
3
That aside, it's essential to know when to exit a trade if it looks weak/isnt going your way. This will save you tons of eth and minimize overall drawdown on your portfolio.
4
They way i do it is pretty simple and straightforward.
I monitor mainly 2 things.
1 - Volume
2 - Chart structure
Extras would include general sentiment, market conditions, upcoming catalysts for said coin and seeing if the meta is drying out, buttt mainly these two.
I monitor mainly 2 things.
1 - Volume
2 - Chart structure
Extras would include general sentiment, market conditions, upcoming catalysts for said coin and seeing if the meta is drying out, buttt mainly these two.
5
''Why Volume?''
Volume will help you determine what side is taking control, the stronger side will usually take the tide and lead the chart into the same direction for a bit too. this is basic knowledge used in every market
Volume will help you determine what side is taking control, the stronger side will usually take the tide and lead the chart into the same direction for a bit too. this is basic knowledge used in every market
6
(example if sellers are looking strong asf on 1hr and not allowing bounces etc, chart will likely go down until you start seeing buyers increase in frequency and size)
7
''Why Chart Structure?''
We're all looking at the the same charts here, the buyer the seller and the sideliner. Psychologically if certain levels on the chart are lost (broken down) it decreases confidence and almost always, it will cause more sells.
We're all looking at the the same charts here, the buyer the seller and the sideliner. Psychologically if certain levels on the chart are lost (broken down) it decreases confidence and almost always, it will cause more sells.
8
self fulfilling prophecy as we say. Instead of WHINING that TA on shitcoins is a meme, we simply use it to our advantage and buy and exit when needed. I look for trend exhaustion and crucial levels being broken down.
9
You ideally wanna see both indicators turn red (Sell volume take control + chart breaking down from crucial levels) to cut your loss/exit. Below i'll ofcourse demonstrate in some recent trades where i use this strat.
10
$linq swing trade i took recently, called this one on twt too, let's go over how my thought process here went
(pls revisit this chart wherever you feel lost in the text, it'll be easier to comprehend)
(pls revisit this chart wherever you feel lost in the text, it'll be easier to comprehend)
11
I averaged in with size with a plan to ride it to 5-6x and sell.
Of course trades wont always follow exactly what you want no matter how perfect the setup is, Saw Linq reclaim a crucial support on the chart with strength and decided to hold a 4x instead of selling.
Of course trades wont always follow exactly what you want no matter how perfect the setup is, Saw Linq reclaim a crucial support on the chart with strength and decided to hold a 4x instead of selling.
12
in an attempt to continue uptrend you can see linq tries to break a local high and fails which causes a harsh selloff too, thats the first sign that an uptrend is losing momentum.
13
Second sign checks itself once it loses the crucial support it reclaimed earlier. Which is where i sold, and a few days later price trickles back to near entry.
If i had held without a plan, this woulda been a 10-15e roundtrip lol
Moving on.
If i had held without a plan, this woulda been a 10-15e roundtrip lol
Moving on.
14
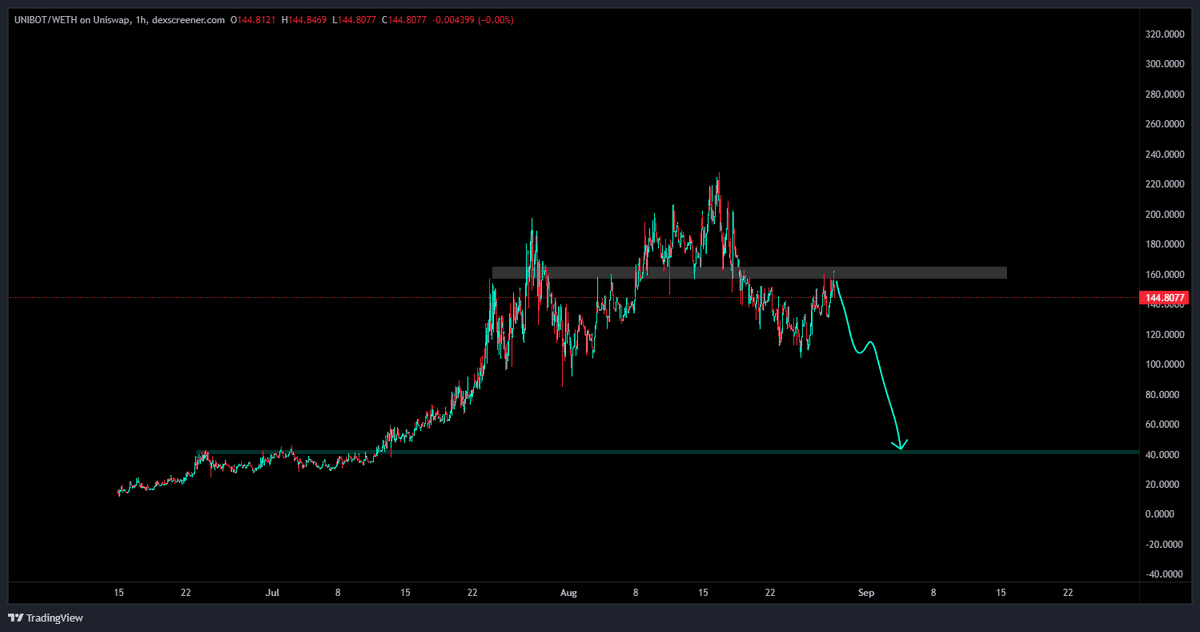
$unibot was one of my biggest win of the year and how i publicly timed the absolute top here
()
()
15
Chart for reference
(once again if you feel lost in the text, come back and revisit the chart)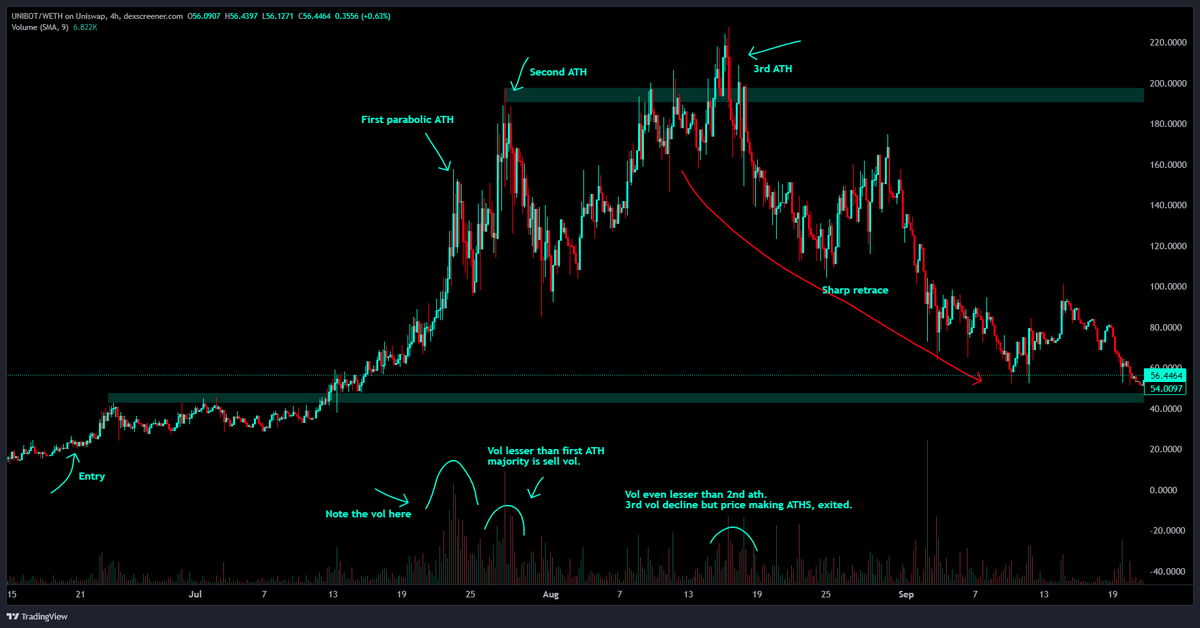
(once again if you feel lost in the text, come back and revisit the chart)
16
Note the volume on the First parabolic ATH the chart sees, it's shortly followed by a second ATH where volume is slightly lower, with sell vol overpowering buy vol.
This is where i shaved off my holdings since it was indicating trend exhaustion.
This is where i shaved off my holdings since it was indicating trend exhaustion.
17
3rd ATH we see is way way lower in terms of volume compared to the previous two ones, price was just not matching the volume and this is where i start full stacking and i exit.
18
Later you can see how unibot retraces all the way back to $50s. The market is irrational, until it isn't, that's basically how you'd mostly use volume to mark tops.
19
$bitcoin/hpos10i was another big win which i called as i entered too
Here's how i used volume+chart structure to shave most of my stack near the top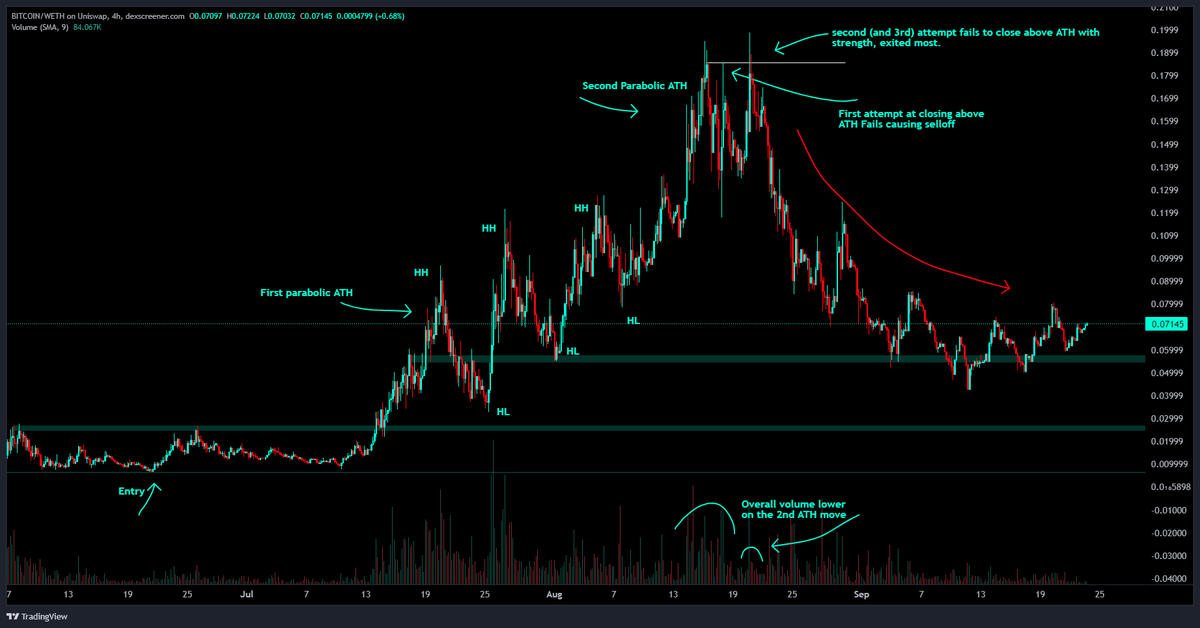
Here's how i used volume+chart structure to shave most of my stack near the top
20
After the first parabolic ATH you see continuous Higher Highs (HH) and Higher Lows (HL), in shitcoins with a crazy community and meme potential, this ends up in a vertical chart most of the time to create another ATH which is exactly what happens here.
21
After the second ATH we see 3 attempts to break ATH, on higher timeframe it's a 2 timer move which both end up failing, volume is also seen to be declining both of the times so theres the pretty obvious signal to exit. Perfect exit and the price trickles back down another 70-75%
22
I have wayyy more examples but it's all repetitive and no point to keep repeating the same thing, if i've confused you PLEASE read it again and again until you understand it
23
before some bagholders seethe, i'm just teaching the curious how i exit at tops, i'm never emotionally attached to any coin and im literally just trading the charts to make money
IF used correctly, this will benefit you a lot.
IF used correctly, this will benefit you a lot.
24
Anyways i tried to keep it concise yet detailed as always, lmk what you think of it aswell.
See you bros for the next one.
See you bros for the next one.