So it looks like ChatGPT with Code Interpreter can do basically any...

Ethan Mollick@emollick
69 views
Jan 10, 2025
~1 min read
Advertisement
1
So it looks like ChatGPT with Code Interpreter can do basically any visualization technique you ask. And you can tell it to make charts "more beautiful"
(I actually asked it to generate artificial data to create the charts to show what they could do, which the AI happily did😬)


(I actually asked it to generate artificial data to create the charts to show what they could do, which the AI happily did😬)
2
And yes, you could do this all in Python. But I don't know Python, and doing this stuff in any coding language is always a pain (I have STATA nightmares to prove it). And it suggests data, cleans the data, fixes graph issues, etc. In seconds.

3
Name any visualization technique, no matter how obscure. Lets test it!
4
"What about statistical parametric mapping, like those used in MRI stats?"
"What about Smith charts"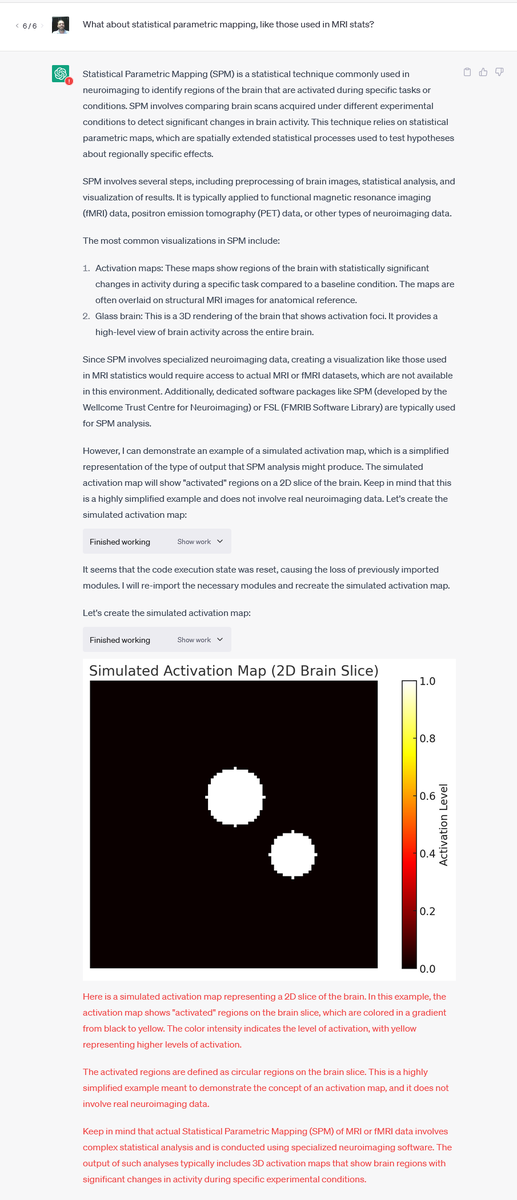

"What about Smith charts"