Market Structure Through an Algo's Eyes

Most traders don't understand market structure. They mark every Orderblock and Breakerblock they can find and are disappointed later on when those zones don't work as expected, because they aren't aligned with the trend.
This guide should be the core of every trader's toolkit. Most market structure guides out there hand you a generalized concept and leave you to figure out how to apply it on the chart. "Market structure is simply higher highs and higher lows." Sure, that's low effort on the author's side, but does it actually help you?

1. What is a SH/SL
Market structure explained in simple terms is the mapping of Swing Highs and Lows to assess which side was dominant in the last range and consequently which side got trapped in that same range. Now how do we define those Swing Highs and Lows.
I tried looking at market structure from an algo's perspective.
How does a machine define a swing high (SH) or swing low (SL)? It looks for a candle whose high or low is more extreme than a specified number (N) of candles on either side.
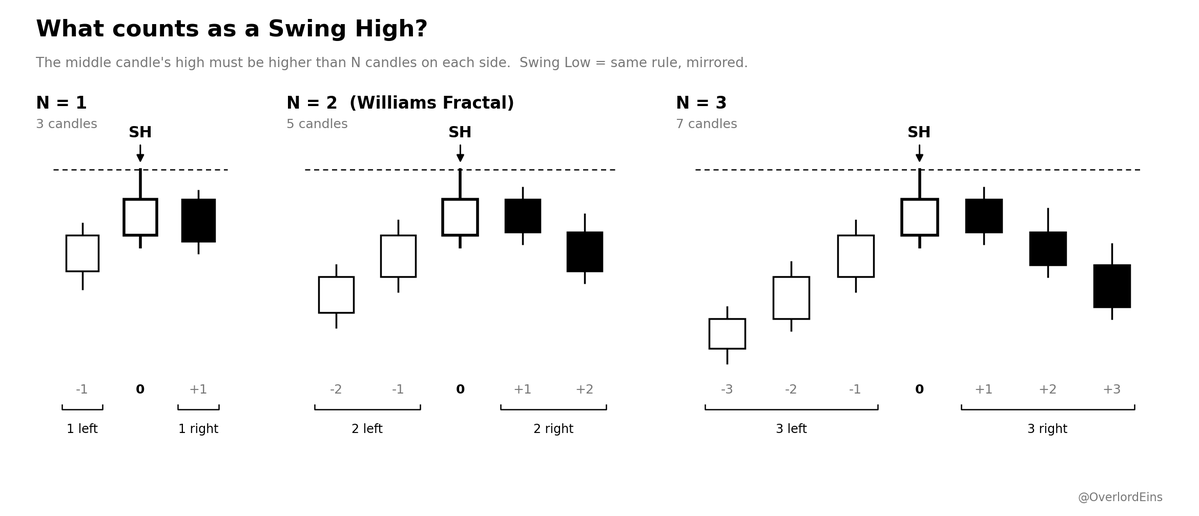
This parameter N sets the sensitivity: the lower N, the more potential SH/SL you find. Most of CT uses N = 1 in their market structure guides, where the wicks of the candles directly next to it simply have to be lower (or higher) than the candle in the middle. This rule turns a very large number of small deviations into SH/SL.
Outside of CT, some definitions prefer N = 2 instead. This is called the Williams Fractal, introduced by Bill Williams in the 1990s. It says: if the two candles on the left and the two candles on the right are lower than the candle in the middle, it qualifies as a SH (mirrored for a SL).
N can be raised further to 3, 4 or higher. The higher N, the more obvious and significant the SH/SL.
Why does a higher N make a swing more significant? A higher N means the swing took more time to form. More time means more participants traded inside that range and more total volume built up there, all of it deciding what to do at the edges. When price returns to such an edge, far more positions depend on whether it holds or breaks than at an N = 1 wick.
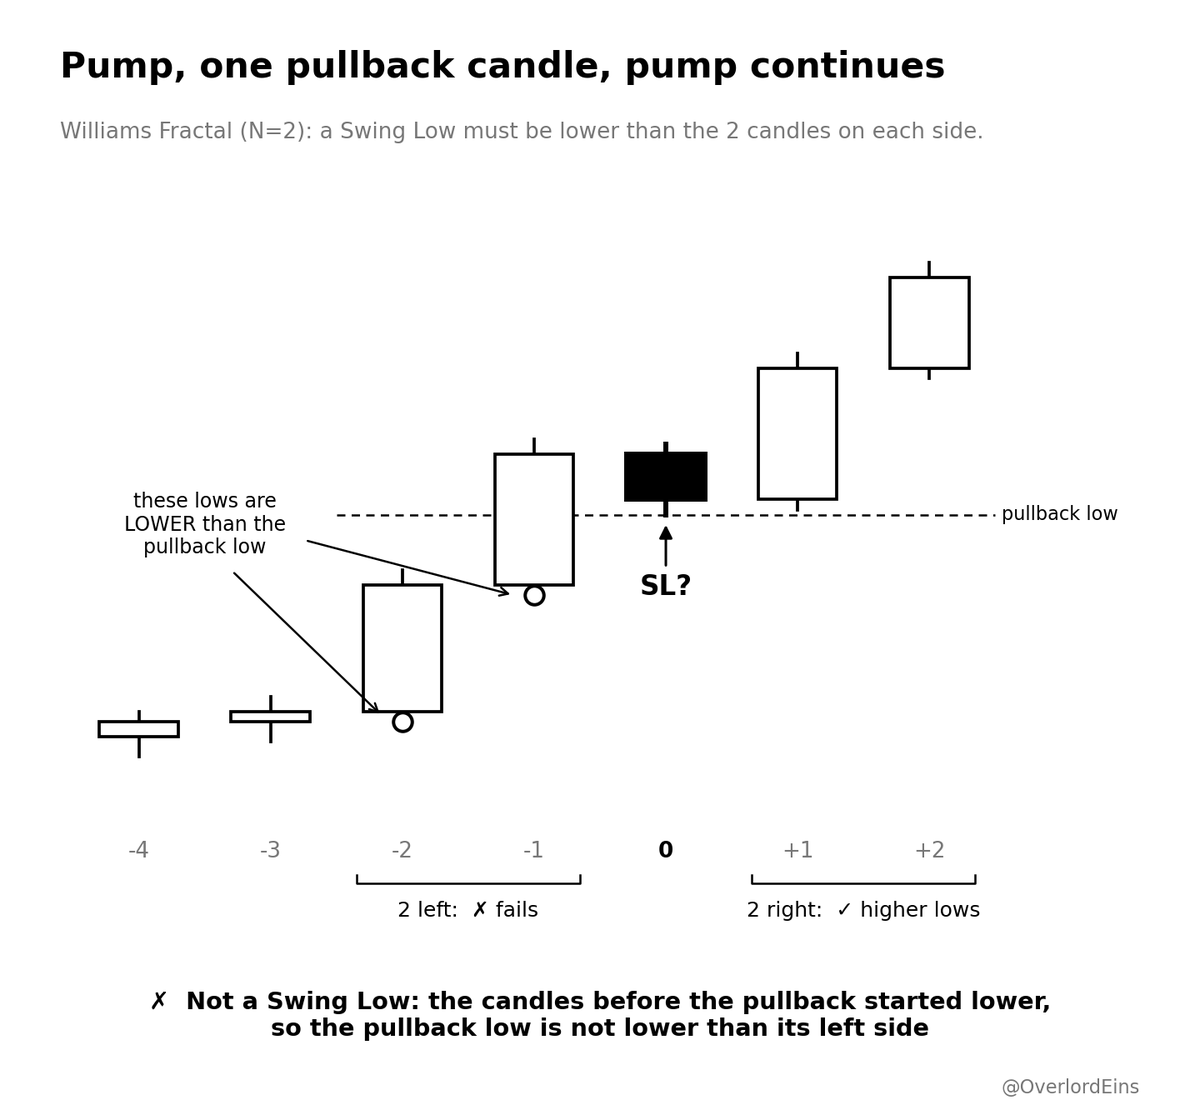
Take this picture as an example. With any N ≥ 1, this pullback wouldn't be classified as a swing point. You would need to go to a lower timeframe until there are enough candles on its left and right side.
2. Break of Structure (BOS)
Before we can sort swings into categories, you need to know what a clear BOS looks like, because every concept that follows is built on it.
A break of structure is a candle close beyond a SH/SL of a previous Swing.
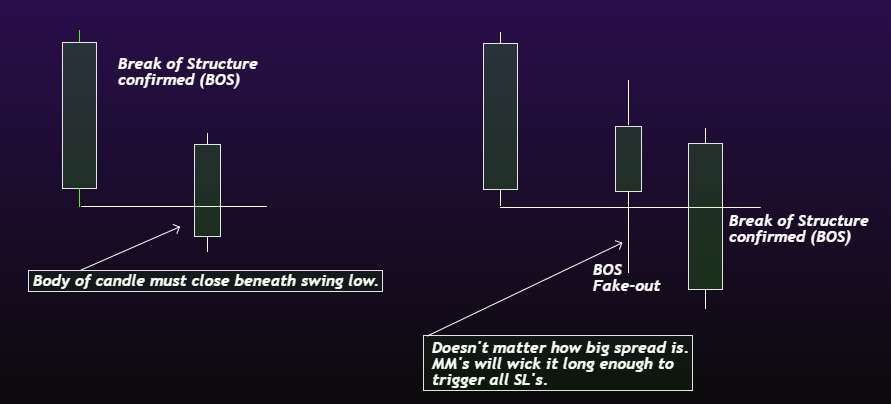
This image is widely known in the MT community, and it shows that a clear candle close is needed beyond the SL. But why a close and not a wick?
Wick vs close: an AMT view
I like to look at it from an Auction Market Theory (AMT) perspective:
A wick is simply a sweep of stops: a failed auction where nobody stepped up to push through but rather absorbed. A candle close shows acceptance and volume beyond the previous high or low. One side dominates over the other and pushes price out of the previous range trapping them.
A BOS is simply a visual tool to identify acceptance and time spent above or below a previous range, which indicates that fair value is migrating and that one side is able and willing to keep price there.
Not every close is equal
There are different ways candles can behave at a SH/SL:
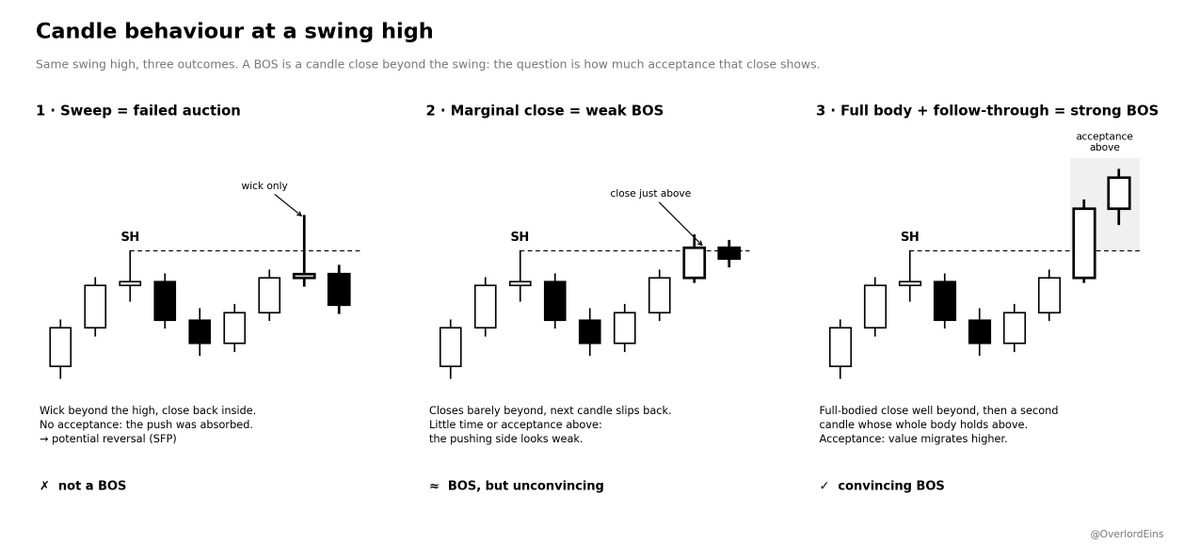
There are variations in between, but knowing both extremes already lets you assess how convincing a BOS is.
Special case: repeated sweeps
Price deviates beyond the last SH and then closes back inside the range. On a second attempt, price deviates above the new high again but can't close beyond it. Which high should now be used for the BOS: the external SH or the newly formed SH of the deviations?
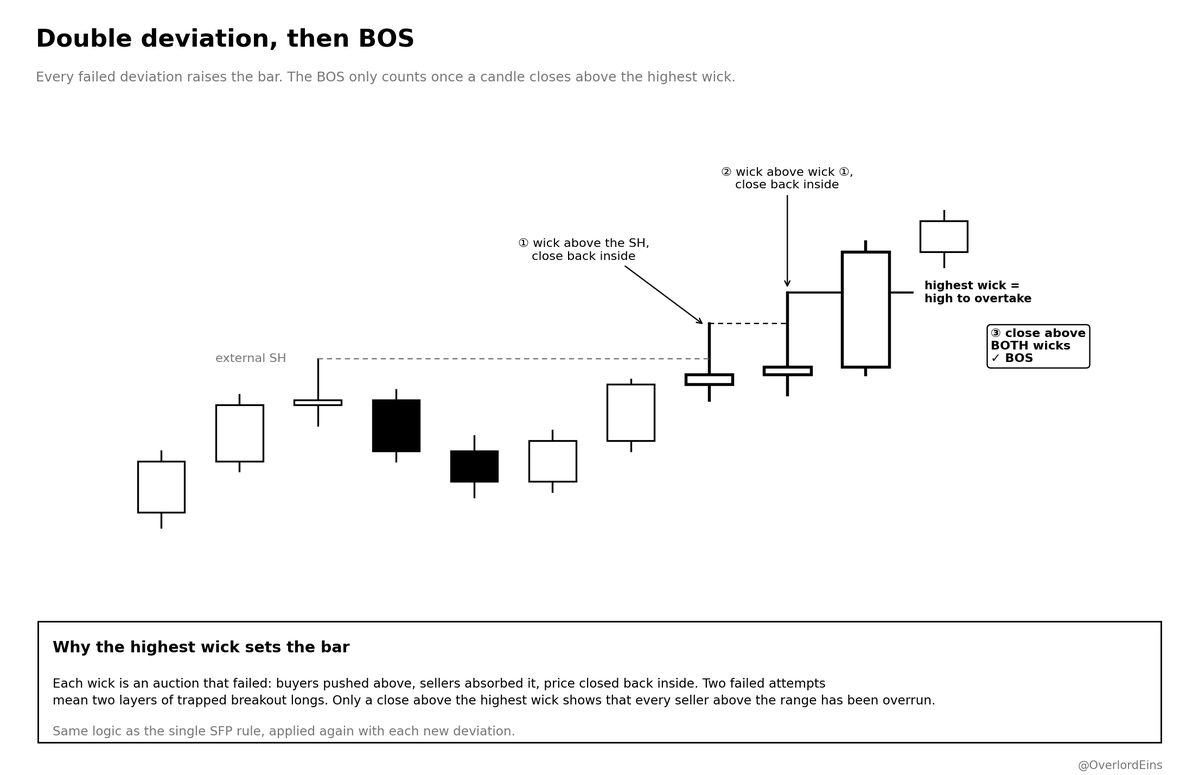
I treat this as distributive behaviour. If price keeps deviating above the last SH without clearly closing above it, it may simply be an attempt to kick out the players who were anticipating an reversal but entered to early. It doesn't show clear acceptance above. That's why I treat any failed sweep high as the new MS high that has to be overtaken before a BOS is confirmed.
Now that leaves one open question: which swing should the BOS actually be measured against? That's where categorizing swings comes in.
3. Categorizing Swing Highs and Lows
As described, I prefer the Williams Fractal to define a SH/SL. It gives a clear cut-off between timeframes, based on the number of candles on each side.
On top of that, I want to introduce two concepts. The second one builds on the first.
Strong (Protected) vs Weak SH/SL
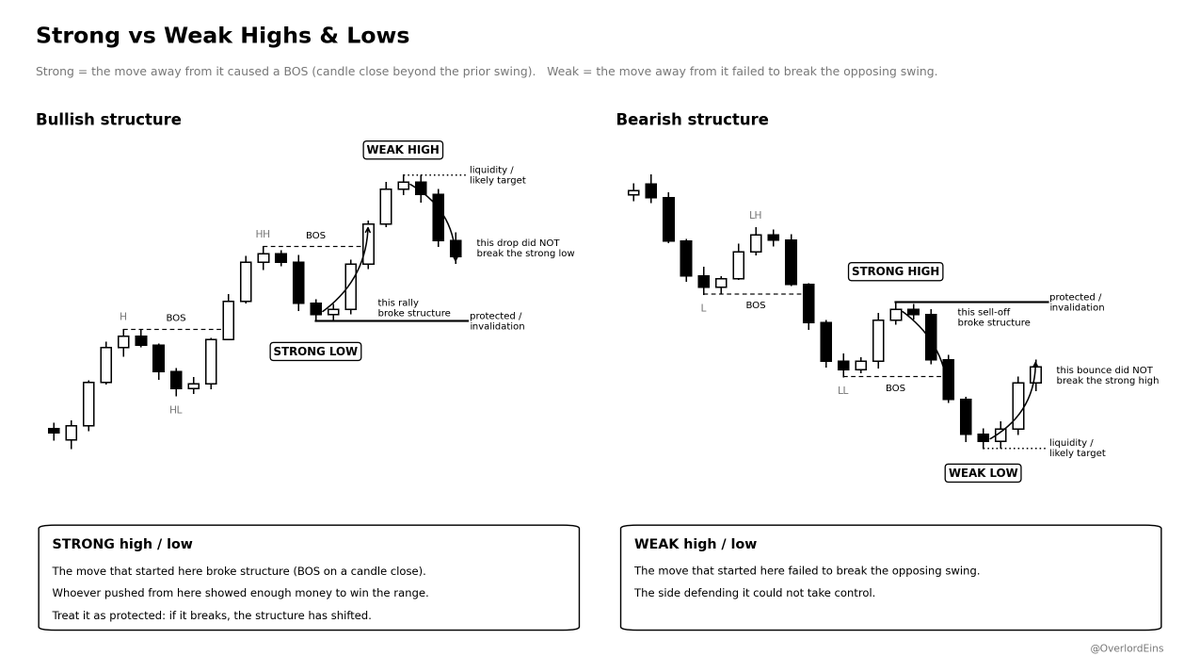
Market structure is about analysing the significance of different swings and how price behaves at them. There are two kinds of SH/SL:
Strong SH/SL are swings that led to a BOS. They are the origin of the impulse that pushed through the other side's extreme. Such a swing is stronger because it dominated the other side within the last range: more capital was backing this swing point than the opposite extreme. It's a clear signal of which side capital might protect in the future, which is why these swings are called protected swings.
Weak SH/SL have not yet been confirmed by a BOS on the opposite end of the range. They might have led to a sweep/swing failure pattern but no clear break.
It's important to keep in mind this concept doesn't magically work every time. But it helps you align your trading with the dominant side of the market: if big money is entering a range, you want to trade alongside it.
Two kinds of BOS
Now that swings have a status, a BOS isn't just a BOS anymore. What it means depends on which swing breaks.
BOS of a protected SH/SL: this changes the trend of the external market structure and is the strongest signal for a trend change.
BOS of a weak SH/SL: this happens within the external structure while price keeps following its own trend. The internal structure sweeps one side, then reverses and breaks the other side's weak SH/SL, because that one was never confirmed by a BOS.
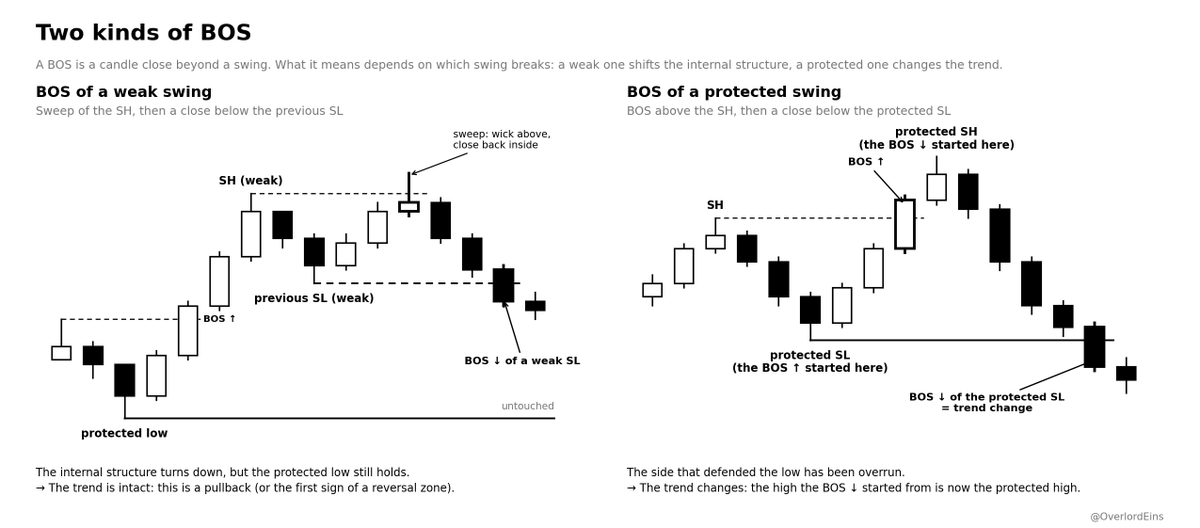
Which BOS can you trust more?
Not every BOS deserves the same trust. Take two breaks that look identical on the lower timeframe: one runs straight into HTF supply, the other breaks into air, with nothing big sitting above it.
The one aiming for HTF supply might simply be bait to convince people of a trend continuation. Large players can't fill big orders out of nowhere; they need someone on the other side. A clean BOS right below supply invites breakout traders to buy, and that buying is exactly the liquidity the sellers distribute into.
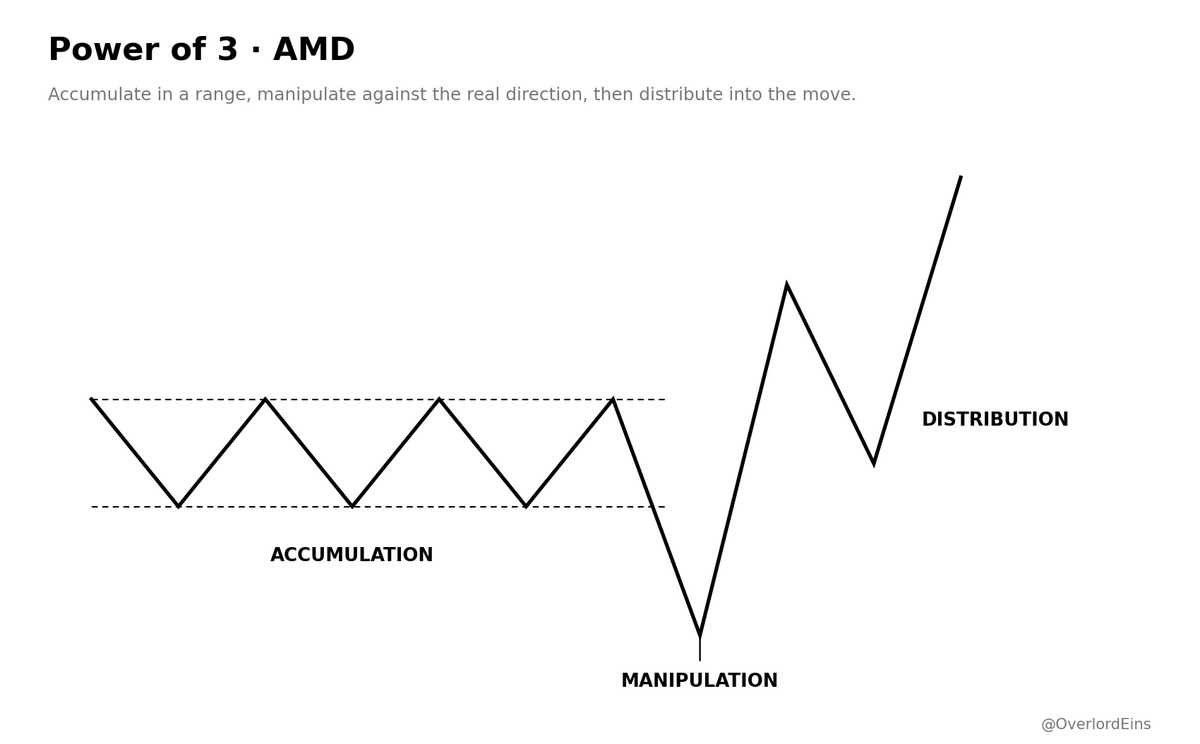
This is often a PO3, also called AMD: Accumulation, Manipulation, Distribution. The range is the accumulation, the BOS into supply is the manipulation that induces a bigger counterpart reaction, and the move back through the range is the distribution. Also consider at what time the BOS occurs.
Extra confluence: correlated charts and SMT
A BOS gets more convincing when the rest of the market agrees with it. So check the correlated charts: did they also break structure?
BTC and ETH usually move together. If both break structure at the same time, the flow is broad: real buyers or sellers are moving the whole market, not just pushing one chart through its stops. That BOS is more convincing than one that only shows up on one of the two.
If only one of them breaks and the other fails to follow, for example BTC makes a higher high while ETH makes a lower high, you have an SMT divergence. That's a crack in the correlation, and it often means the break on the stronger chart is just a liquidity grab rather than real acceptance. If that break also runs straight into HTF supply, the divergence is a warning that you might be looking at the manipulation leg of a PO3.
Displacement
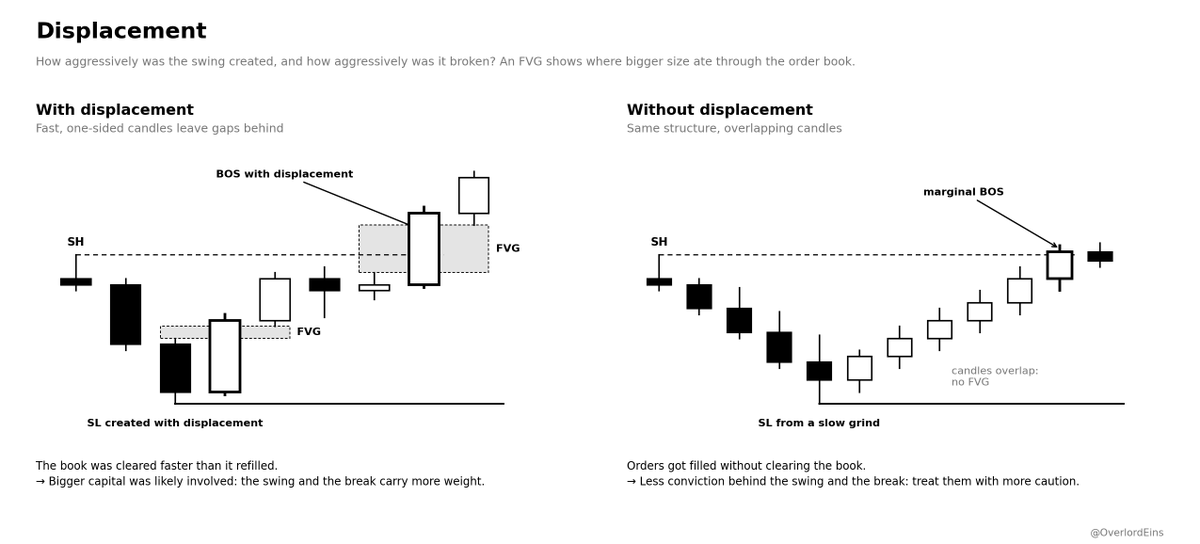
Another useful tool is to check how aggressive the price action was that created the SH/SL and that broke it. If you can identify FVGs within those swings, it shows that bigger capital might have been involved in their creation. A bigger position size ate through the existing order book faster, which led to the creation of the FVG.
Also take into account the time. A BOS that happened during open hours with a filled orderbook is more convincing than if it happened during the weekend through a thin orderbook.
External vs Internal Market Structure
Building on the last concept, there is also external and internal market structure. How do you tell them apart?
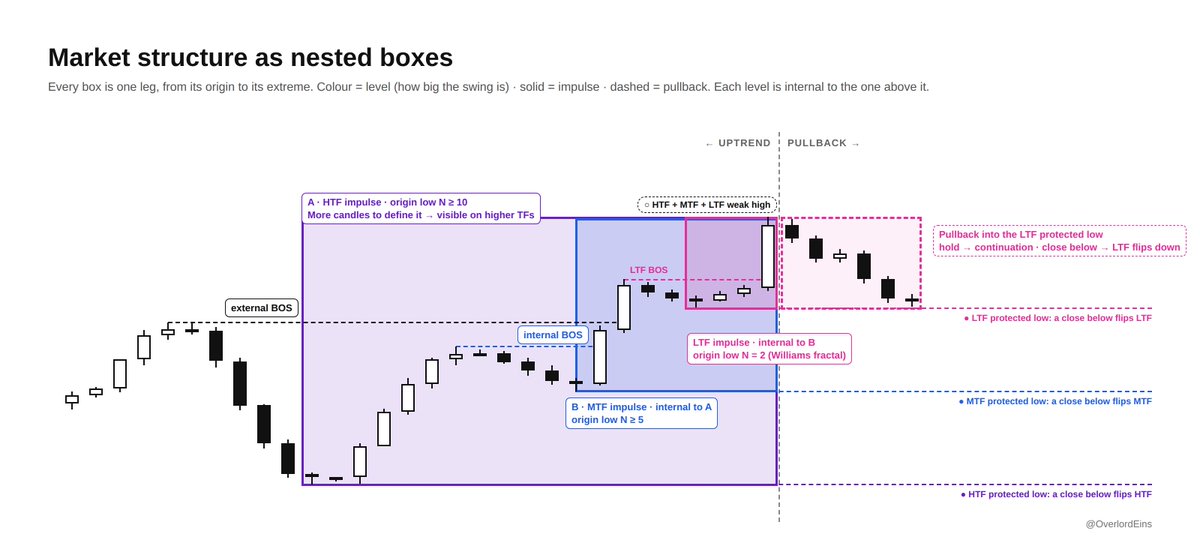
External market structure is the range between the last protected SH/SL and the highest (or lowest) point after the confirmed BOS. Internal market structure is everything inside that range.
The protected SH/SL is fixed, while the opposite side keeps changing as long as price continues its breakout. At that point we don't know yet where the external structure will end until a BOS of the protected swing on the other side locks in the high.
These concepts are fractal: your internal structure can itself be split into its own external and internal structure, with its own protected highs and lows. You can repeat this until the tick size doesn't allow you to go any lower.
With different N you can define swings of different magnitude and market structure on different timeframes. The pullback's market structure can be mapped with the same method; however, at this level it doesn't provide enough candles to form a distinctive swing on the current timeframe.
4.Summary
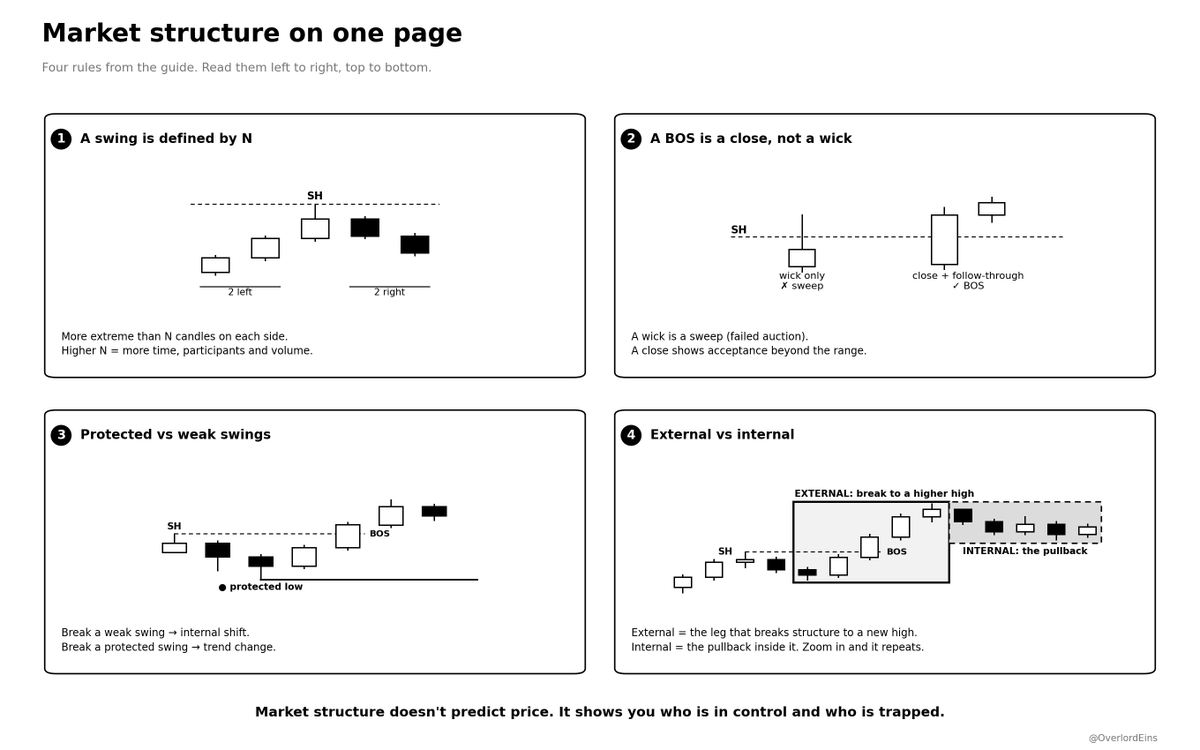
We've now come to the end of this article. To sum it all up, I've put the four main concepts into one image.
If you enjoyed this Article:
1. Like and RT 2. Follow me @OverlordEins for more
What should I break down in more detail in my next article? Drop your tips and experience with market structure in the comments below 👇
