Orderflow isn't as difficult as they make it look

Order flow looks complex at first, but almost everything comes down to three data points.

All the advanced tools—footprints, profiles—are just different ways of visualizing these three.
The goal of order flow is simple:
Identify who is entering the market, and who gets trapped.
Once traders are trapped, they are forced to exit. That forced exit is what drives price.
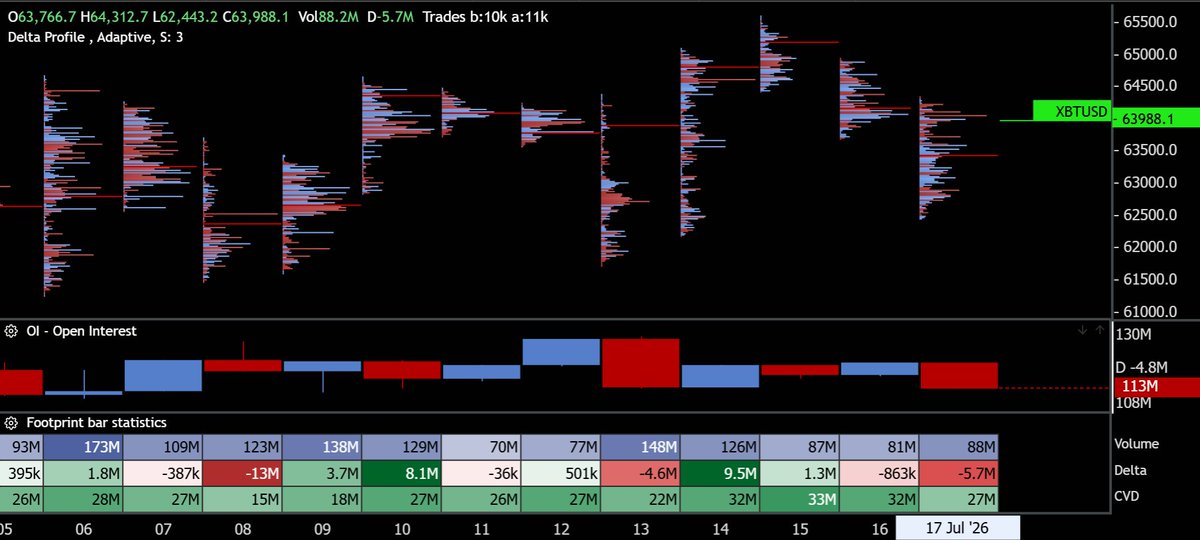
First I will explain them step by step and second I will also illustrate them later on with a real example so you can see how to use them in the real world.
1. Volume:
Every trade is a market order matched with a limit order.
Volume increases whenever these two meet.
Volume does not tell you direction. It only shows how much activity is happening.
In trading, volume becomes important at key areas.
At these levels, you often see spikes caused by:
This is where it starts to matter for trading.
A volume spike usually means many participants are entering at the same time. Some are forced to exit, others are entering expecting continuation. In most cases, both happen simultaneously.
If price fails to continue after that spike, a portion of those traders will be caught on the wrong side.

Delta: Delta adds direction to volume. It shows the difference between aggressive buyers and sellers.
If more market sells than buys are executed, delta turns negative. If buyers dominate, delta turns positive.
For example, if 100 market sells and 50 market buys are executed, the delta/difference is -50.
However, delta alone does not determine price direction.
Price moves when aggressive orders are able to push through available liquidity (limit orders). If that liquidity absorbs the flow, price may barely move despite strong delta.
This is where absorption comes in.
You can see heavy selling enter the market, with strongly negative delta, but price holds its level. That tells you buy limit orders are absorbing the flow.
At these points, it’s important to understand where that selling is coming from.
When a previous low gets taken, long positions are forced to exit. Their stops are sell orders, which adds to the negative delta. At the same time, breakout traders may enter short, expecting continuation. Both contribute to the same selling pressure.
From delta alone, you can’t fully distinguish between the two, but in practice, they often appear together.
Once that selling pressure slows down or runs out, price can move higher more easily, especially if the order book above is relatively thin after the move down.
At that point, the sellers who entered aggressively are in a losing position. They are trapped. As price moves against them, they are forced to buy back, which accelerates the move upward.
Two useful mental shortcuts:
It's often the same sequence:
High delta/volume > being absorbed > big candle on opposite delta > trapped traders squeezed > TP into their liquidation/squeeze
The trapped traders ran out of funds to protect/double down at their entry and now they are in panic — especially if it's a very big trader. He is panicking to offload, because him trying to exit will push price even more against him, and he knows the opposing side that absorbed him wants to squeeze everything out of him that they can.
However, its important to know that limit orders don't always "win", its just one of two ways to enter a position.
Both sides can equally win in this kind of battle, it’s usually just a story about who has more capital to push or absorb the other side. One has to monitor which side is pushed into a corner to ride the wave of their liquidation/squeeze. But you have to be careful because there can always be a bigger fish that steps up against you.
For example, if someone has urgent insider information about an imminent war breaking out within seconds, they will aggressively hit the market sell button, trying to fill as much as possible—there is no time to distribute. The limit order side, representing the uninformed in this situation, absorbs that flow and, once the news hits, gets squeezed out by an influx of other participants adjusting to the repricing.
2. CVD
CVD is another tool that simply illustrates the development of the delta over time. It's the cumulative volume delta, it adds all the delta of the candles up.
It helps identify trapped traders through CVD divergences.
When price and the CVD line diverge, it signals that aggressive market orders (reflected in CVD) are being absorbed by passive limit orders. If price moves against the direction of CVD, it shows that breakout traders are getting trapped and stop orders are being absorbed.
Once price reverses, those trapped positions get squeezed, fueling the move in the opposite direction.

3. Open Interest:
This adds another important data point on top. Open Interest tracks the number of open contracts. Futures are zero sum — the moment you open a long, the other side opens a short (you get filled into someone else's limit order). Your negative PNL pays them, or their negative PNL pays you.
OI shows that contracts were opened or closed, delta shows which side used market orders to make it happen.
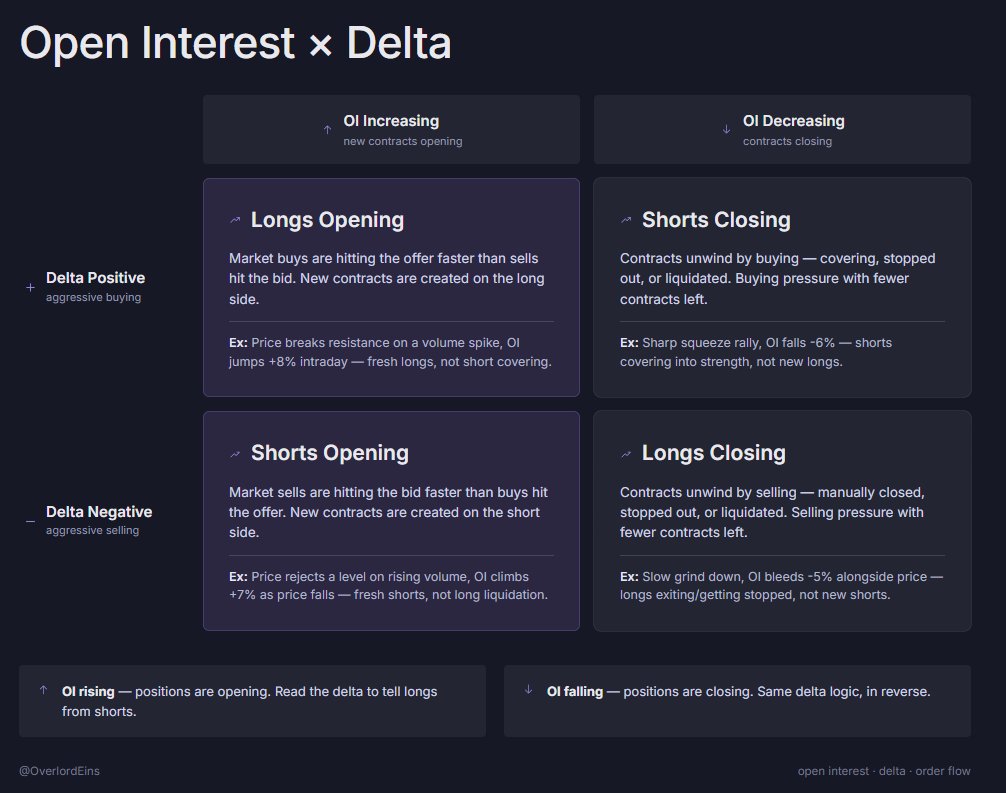
Using Open Interest we can triangulate what kind of market orders are incoming into the market.
Open Interest increasing means positions are opening — either long or short market orders.
When open interest decreases, contracts are either manually closed, stopped out, or liquidated. The same logic applies in reverse: if a long gets squeezed, it must sell to exit, creating negative delta, while a short that gets squeezed must buy back, creating positive delta.
Now that the basics of order flow have been covered, traders can also use additional data to understand exactly where those traders entered:
4. Footprint Charts:
They allow traders to see more precisely where participants entered, identify when they are in the red, and spot when a squeeze becomes more likely. If price reclaims their entry levels, it can be used as a sign of strength when the other side is unable to defend them.
5. Trading example and step by step workflow:

The workflow:
If you enjoyed this Article: 1. Like and RT 2. Follow me @OverlordEins for more What should I break down in more detail in my next article?
Drop your thoughts in the comments below 👇
Just a little sidenote: in the past, @Moneytaur_ has talked about VSA. It stands for volume spread analysis, and at its core is the analysis of effort versus result. In my opinion, CVD divergence is one tool that can complement VSA. It shows large volume with price failing to follow through because it gets absorbed, resulting in a smaller candle spread.
