More Parallelism, Less Throughput: measuring the Cost of Tensor Parallelism

tensor Parallelism (TP) is often treated as the default scaling strategy in distributed Large Language Model (LLM) inference engineers instinctively scale up TP degrees whenever more GPUs become available.

However, in high-concurrency production environments, increasing Tensor Parallelism without analyzing workload dynamics can severely penalize throughput, introduce costly communication synchronization, and trigger catastrophic prefill head-of-line blocking!
In this deep-dive engineering post, we compare SGLang Disaggregated TP1 (4 Prefill + 4 Decode pods) versus SGLang Disaggregated TP2 (2 Prefill + 2 Decode pods) on the exact same fixed hardware budget: an 8x NVIDIA H100 SXM5 GPU cluster.
both topologies serve Qwen/Qwen3.6-35B-A3B-FP8 with a full 131,072-token (~132K) context window, static VRAM allocation of 0.85, and
zero-copy NIXL UCX RoCE RDMA state transfer!
by tracing performance across a complete concurrency scaling sweep (c=1 to c=128) using AIPerf, identifying the exact tipping point where TP=1 outperforms TP=2 by +31.0% higher output throughput and delivers an 8.2x faster Time-to-First-Token (P95 TTFT)
The Goal
evaluate the performance trade-offs between intra-pod Tensor Parallelism (TP2-2P2D) and inter-pod replica parallelism (TP1-4P4D) across an 8x NVIDIA H100 cluster when serving Qwen3.6-35B-A3B-FP8 under scaling concurrency.
this experiment answers four architectural questions:
Hardware & Runtime Specifications
before diving into the system architecture and benchmark results, the table below details the exact bare-metal cluster hardware, model architecture, interconnect configuration, and runtime parameters used across both topologies:

serving Qwen/Qwen3.6-35B-A3B-FP8 efficiently requires tailoring the inference engine to its hybrid architecture.
Out of its 35 billion total parameters, only approximately 3 billion parameters are actively routed per token via its Sparse Mixture-of-Experts (MoE) layers, combined with Gated DeltaNet recurrent linear attention states (HybridLinearKVPool).
In native FP8 precision, the model weights consume approximately 35 GB of VRAM because each NVIDIA H100 GPU provides 80 GB of high-bandwidth memory (HBM3), a single GPU easily holds the entire 35 GB model weight footprint while still leaving over 40 GB of unallocated VRAM.
by setting --mem-fraction-static 0.85, SGLang dedicates 85% of total VRAM (~68 GB per GPU) to the static KV cache and Mamba linear recurrent state pool after subtracting model weights and CUDA execution buffers, each individual GPU maintains an in-VRAM capacity of approximately 380,000 to 450,000 active context tokens!
Architecture & Parallelism Design
To understand why the two configurations behave so differently under load, let us examine their topological layouts and execution mechanics across the 8-GPU cluster:

Intra-Pod Tensor Parallelism vs. Inter-Pod Replica Parallelism
The fundamental distinction between these two architectures lies in how GPU compute resources are organized between intra-pod synchronization and inter-pod replication:
In TP2-2P2D, each worker pod binds two physical H100 GPUs joined by high-speed NVLink. Attention projection matrices, feed-forward layers, and MoE routing matrices are split across the two devices.
during every single transformer layer, intermediate activation tensors must be synchronized across GPUs using all-reduce operations over NVLink. While this sharding reduces the arithmetic workload per GPU and accelerates the forward pass for an isolated single request, it imposes continuous synchronization barriers throughout the execution graph.
More critically, clustering 8 GPUs into 2-GPU pods reduces the cluster's replica count to only 2 prefill workers and 2 decode workers.
In TP1-4P4D, each worker pod operates entirely on a single H100 GPU with zero intra-pod communication overhead. Attention computation, linear state updates, and MoE routing execute completely within local GPU registers and HBM3 memory because there are no all-reduce communication barriers, the GPU compute engines run at 100% duty cycle.
Most importantly, running at TP=1 doubles the cluster's concurrency capacity, provisioning 4 independent prefill workers and 4 independent decode workers.

Production Manifests & Deployment
The complete deployment manifests are structured as runnable
Kubernetes recipes:
Cluster Deployment Workflow
# 1. Configure deployment environment variables
export NAMESPACE=qwen32-bench
export EXP_DIR=/ephemeral/shared/qwen3.6-35b-a3b/sglang/disagg/tp1-4p4d
export DEPLOYMENT=q36-sgl-pd-tp1-4p4d
export GRAPH_LABEL="nvidia.com/dynamo-graph-deployment-name=${DEPLOYMENT}"

# 2. Deploy TP1-4P4D serving graph (4 Prefill + 4 Decode across 8 GPUs)
kubectl apply -n "$NAMESPACE" -f "$EXP_DIR/deploy.yaml"

# 3. Monitor rollout & readiness across all 8 worker pods
kubectl get pods -n "$NAMESPACE" -l "$GRAPH_LABEL" -o wide -w

# 4. Teardown & release cluster resources when switching topologies
kubectl delete dynamographdeployment.nvidia.com "$DEPLOYMENT" \
  -n "$NAMESPACE" --wait=true --ignore-not-found
Benchmarking & Performance Analysis
To evaluate how both topologies scale from single-user execution up to extreme cluster saturation, we execute benchmarks using AIPerf configured with a production-grade mixed sequence distribution:
16 warmup requests, and a 3,600-second timeout ceiling
The mixed sequence distribution is specifically designed to stress both compute intensity and memory footprint across the cluster:

by blending shorter high-frequency requests (1K–4K) with heavy long-context payloads (8K–32K) and a 75% prefix reuse pattern across 8 prefix groups, the benchmark replicates production agentic traffic where prefix caching, prefill compute queuing, and autoregressive generation happen concurrently.
Peak Saturation Analysis: C 128 Breakdown
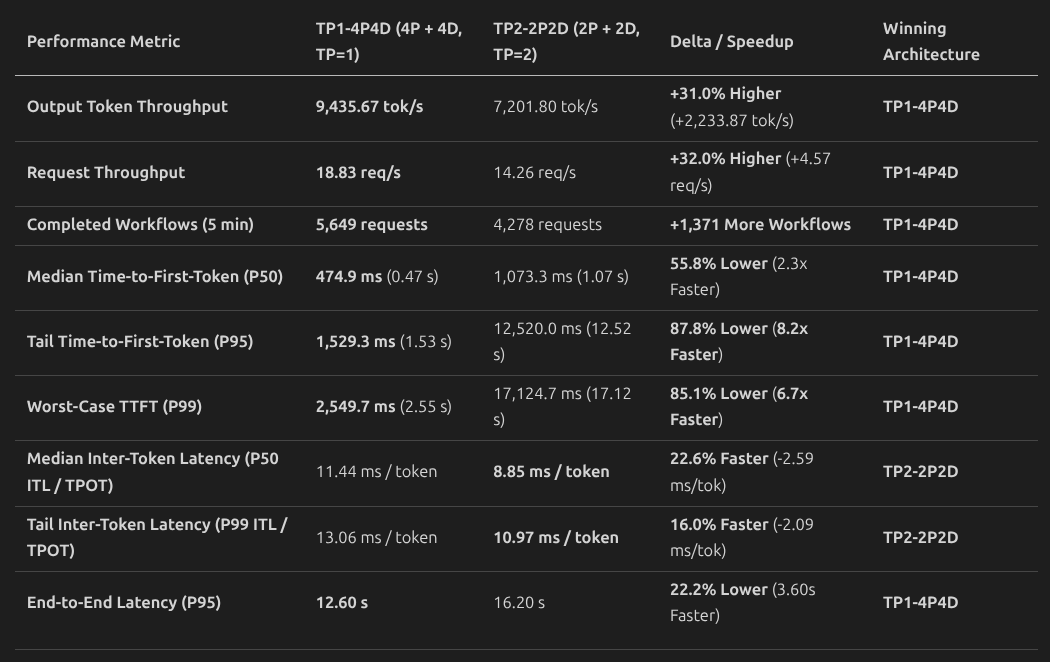
Under peak multi-user saturation (c=128c=128), the performance divergence between TP1-4P4D and TP2-2P2D becomes stark.
The performance dashboard and empirical scorecard below summarize aggregate throughput, queueing latency, and per-token generation speeds:


To understand why TP1 outperforms TP2 at scale, look at how GPUs execute prefill versus decode.
1. Prefill is Compute-Heavy, Decode is Memory-Bandwidth-Bound
Prefill ingests the entire prompt in parallel through large matrix multiplications, heavily utilizing the H100 Tensor Cores While a prefill worker processes a prompt, its compute engine is fully occupied, forcing subsequent requests to wait in line.
In contrast, autoregressive decode generates one token per step per stream because the arithmetic per token is small, decode execution is bounded by HBM3 memory bandwidth as the GPU reads the 35 GB model weights from memory on every step.
2. Why TP2 Wins at Low Concurrency (c <= 32)
When traffic is light, GPU compute capacity sits largely idle. Sharding the model across two GPUs in TP2 cuts the weight data each GPU must read in half (~17.5 GB), dropping per-token generation latency from 11.44 ms down to 8.85 ms (a 22.6% speedup).
with low arrival rates, TP2's two prefill pods are rarely occupied at the same time, keeping queue delays near zero (P95 TTFT is 16–21 ms).
3. The Crossover and Collapse at High Concurrency (c >= 64)
As concurrency ramps up, prefill ingress capacity becomes the hard bottleneck. In TP2-2P2D, the entire incoming stream must funnel through only two prefill pods.
Long prompts (up to 32K tokens) monopolize the Tensor Cores, causing severe head-of-line blocking where shorter requests queue behind them. At c=64, TP2's P95 TTFT surges 40x to 842 ms, and at c=128 it balloons to 12.52 seconds.
This prefill queueing triggers a decode starvation paradox because prefill workers cannot process and hand off KV caches fast enough, decode workers finish active jobs and sit idle waiting for state transfers over RDMA, capping TP2 throughput at 7,202 tok/s. TP1-4P4D provisions four independent prefill pods, halving queue depths. keeping P95 TTFT at 1.53 seconds (8.2x faster), and keeping all four decode workers continuously fed at 9,436 tok/s (+31.0%).
furthermore, TP1 eliminates the 128 NVLink all-reduce synchronization barriers per token required by TP2, allowing each GPU to run at maximum local efficiency.
Takeaways & Decision Guide
this experiment demonstrates that higher Tensor Parallelism is not inherently better for cluster throughput. When architecting production LLM serving clusters, we should apply the following decision framework:

This memory footprint fundamentally decouples Tensor Parallelism from physical hardware necessity.
In distributed LLM serving, we frequently default to Tensor Parallelism because massive model weights (such as 70B models in FP16) exceed
single-GPU memory limits, making multi-GPU sharding an unavoidable capacity constraint
but when weights fit comfortably within a single accelerator, however tensor Parallelism ceases to be a capacity requirement and transforms into an explicit architectural trade-off between per-token compute latency and cluster-wide replica throughput.
Choosing TP=2 shards linear projections across two GPUs joined by NVLink, halving the arithmetic workload per device and accelerating individual layer forward passes for isolated requests.
yet this compute speedup comes at a steep infrastructural cost: it introduces synchronous all-reduce communication barriers at every transformer layer, and on a fixed 8-GPU budget, it halves total cluster replicas from 4 Prefill and 4 Decode pods down to just 2 of each.
Conversely, TP=1 completely eliminates inter-GPU communication overhead, runs compute engines at full local hardware efficiency, and doubles prefill dispatch capacity across the cluster.
when VRAM is non-constraining, Tensor Parallelism operates purely as a latency optimizer for under-subscribed environments, whereas Replica Parallelism (TP=1) maximizes concurrency resilience and aggregate cluster throughput under production load.
Conclusion
This benchmark study proves that Disaggregated TP1 (4P4D) is the superior production serving architecture for Qwen3.6-35B-A3B-FP8 on an 8x NVIDIA H100 GPU cluster when serving concurrent multi-user traffic.
by eliminating NVLink all-reduce synchronization barriers and provisioning 4 independent prefill and decode workers, TP1 delivers:
(9,436 tok/s vs. 7,202 tok/s at c=128).
say you have a model that only takes ~30–35 GB for weights on an 80 GB NVIDIA H100. You already have ~45–50 GB of free VRAM sitting on each GPU ready for KV cache! If you split that model across GPUs with TP=2 just because you have multiple GPUs, it's a bad trade-off you cut your total replica pods in half and add hundreds of NVLink all-reduce sync stalls.
Keeping each worker at TP=1 gives you double the worker pods, zero communication overhead, and the maximum throughput needed to serve high-concurrency production workloads.
This architectural efficiency compounds when integrated with hierarchical memory tiers. As demonstrated in our previous experiment on Hierarchical CPU KV Offloading (HiCache)
offloading evicted prefix states to host DDR5 RAM unlocks massive effective context capacity and drives higher sustained throughput without requiring additional accelerator hardware.
combining TP=1 replica parallelism with host RAM offloading maximizes overall token-per-watt efficiency: single-GPU workers eliminate inter-device synchronization stalls to keep Tensor Cores saturated at maximum duty cycle, while CPU offloading prevents redundant prefill recomputations, extracting peak serving throughput per watt across the cluster!
for our next writeup, we will dive deep into profiling NVIDIA NIXL for KV cache over RoCE v2 RDMA, showing how to instrument Prometheus telemetry on Dynamo workers and build a production Grafana dashboard to track
real-time transfer latency, bandwidth, and CPU host memory caching at scale!
Thanks for reading until here 🙏