Everything I’ve Learned About Position Sizing From a Market Wizard

The most frequent advice we get on position sizing is a recipe for blowing up our accounts.

And the sizing rule everyone quotes from Market Wizard Kristjan Qullamaggie is advice he gives beginners. It's not how he actually trades.
Qullamaggie turned $9,000 into over $105 million, and live streamed most of it. He got bombarded with questions about entries, setups and where to put the stop. Very few asked about his sizing. Which is weird, because his sizing is the results of the answer to those three questions.
And if we ever do ask about sizing, in almost any trading community, the advice we're given - "risk one percent of your account" - over and over, is a recipe for blowing up our accounts. Given out by people who never checked what he actually does.
Qullamaggie's actual risk is a fifth to half of that 1 percent. So don't take sizing advice from randoms on the internet. Including me. Take it from what he actually does.
I went through over 500 of Qullamaggie's live streams from 2019 - 2022, and all of his tweets from 2013 till today. All in order to find out:
Let's begin with looking at why risking 1% just isn't feasible.
Total position size is risk divided by stop distance. Qullamaggie's median stop on breakouts is 2.44% and for episodic pivots it's 3.85%. This gives us the following table:
| Risk per trade | Position with 2.44% stop | Position with 3.85% stop |
|---|---|---|
| 1 percent (what we're told) | 41 percent of the account | 26 percent |
| 0.5 percent | 21 percent | 13 percent |
| 0.3 percent | 12 percent | 8 percent |
| 0.2 percent | 8 percent | 5 percent |
As you can tell, risking 1% of our account puts us out of buying power very fast. And, holding 40% of our account in one stock is poor risk management. More on that later.
Qullamaggie spends most of his time in the bottom two rows. Most of the time.
How he finds his position size
He doesn't choose a position size. He chooses two other things, and the position size is the consequence of these two choices.
Yeah, position size can vary due to the stop. You can go with it from two ways. You let the your risk determine your size, and or you can let your size determine your risk.
Position equals risk divided by stop distance. Decide you're willing to lose 0.3 percent of your account, put the stop 3 percent under the entry, and the position is 10 percent of your account. Cut the stop in half and the position doubles. Nothing else changed, not your conviction, not your read on the stock. The chart moved your stop, and the size followed.
I only rebought half size yesterday since I had a much wider stop. So instead of 400,000 shares, I have 200,000
Qullamaggie, on stream 2021-01-29
Wider stop, half the shares, same risk.
This is why setup type changes our size before we've decided anything. Episodic pivot stops are wider than breakout stops, by enough that at the same risk an episodic pivot gets about 63 percent of the size a breakout gets. Not half, which is what I assumed before measuring. A volatile stock does the same thing through its daily range.
That's his whole approach. Choose the risk, read the stop off the chart, and then divide. Every sizing rule he mentions is a way to adjust one of those numbers.
Our entry window picks the size for us
Before we continue we need to recap a little from the entry article. If you haven't read it yet, I encourage you to read it now, as it will help make everything in this article make more sense.
Quick recap: the entry timing sets the stop distance, and the stop distance sets the risk. If we buy the 1m ORB the median stop is 1.24%. If we buy the 30m ORB the median stop is 3.78%. Three times higher.
Now, there are two ways to turn that stop distance into a position size.
Keep the risk the same on every trade:
We can risk 0.5% of the account on every trade. If we use the same dollar risk, we can get three times the size with the fast entry. Or rather, a 40% position with the 1 minute vs a 13% position if we use the 30 minute entry.
Keep the same dollar-position size on every trade
Or, we can put the same amount of buying power into every trade. The number of shares bought will be the same, regardless of the stop distance. With this method, the only thing that matters is how far the stock moves.
If we put this into a table, we get a table which is difficult to fully understand at first.
| Time of entry | Median stop | Return per unit of risk | Avg. move captured |
|---|---|---|---|
| the first minute | 1.24% | 3.61R | 4.73% |
| the first thirty minutes | 3.78% | 1.54R | 7.19% |
Two ways to measure trade performance
The third column shows how much we made per dollar we risked. The fourth column shows how much the stock moved between our entry and exit, which is how much we made per dollar invested.
We used the same trades, exited at the same times, and traded on the same days. The only thing that changed was what we divided by.
Per dollar risked, the fast entry makes more than double the slow one. Per dollar invested it's the worst performer. It captures a smaller move and still posts the bigger number, because the tight stop let it own three times the stock. Which is why it's dangerous, for the lack of a better word, to blindly measure gains and risk with R. Every R figure assumes we size with the same dollar risk, and on a 1.24 percent stop that means 40 percent of the account in one name.
Now, you might ask why the fast entry captures less of the move (4.73% vs 7.19%). Half of it is selection. The fast entry enters setups the slow entry never triggers on, and loses money on them.
The other explanation is shakeouts. On setups that trigger at both entries, the average winner is the same size at both ends, but the tight stop stops us out of 7.8% more of the identical trades. What a shakeout costs isn't the small loss. It's getting stopped out of a monster.
On top of all of this, there's a third rule, and it changes how we should approach this. We'll look at that after we have reviewed Qullamaggie's actual sizing.
The two rules everyone quotes
Two of his sizing rules are based on account size, and we can use them at any account size.
One, risk per trade.
I usually risk between 0.2 and 0.5% of my equity in, in most trades
Two, his maximum size in any ticker
And don't put more than say 20, 25% of your account on in any single stock or ETF overnight.
The exact number he uses changes from day to day. The lowest number he ever uses is 15%.
The two rules work well together. A 10 percent position with a 3 percent stop risks 0.3 percent, and both rules are followed at the same time. He also mentions a third limit, the liquidity one. Will get back to that later.
The risk number is the ordinary part
Let's go back to the number from the top. The answer we get most often is 1 percent per trade, but this is two to five times what he actually risks. So, as a description of him, it's not accurate. However, he does use 1 percent as advice for small accounts:
When I had a smaller account, let's say sub 100k, I used to risk like 1-2% all the time. But nowadays, I rarely risk more than 1%
So 1% isn't misinformation. It's his advice for beginners, repeated as if it were his rule. The difference matters when your stops are as tight as his, because a tight stop turns 1% of risk into a very large position.
The first time I heard 0.2 to 0.5 percent it sounded like a very small number. A fifth of a percent, on his conviction? We can't possibly make triple digit returns with such a small risk?
Turns out we can.
Of all the traders I have data on, Qullamaggie's risk level falls in the middle of the pack.
| Trader | Stated risk per trade, percent of account |
|---|---|
| Kristjan | 0.2 to 0.5 in most trades |
| Peter Brandt | 0.8 at most, usually less |
| Jim Roppel | 0.5 at most |
| Christian Flanders | 0.25 to 0.5 |
| Matt Petrallia | 0.25 to 0.5, total open risk capped at 6 |
| Ryan Pierpont | 0.25 to 0.5 |
| Martin Luk | 0.5 (but sizes bigger) |
| Eve Boboch | 0.3 to 0.5 |
| Tomas Claro | 1 to 2 |
| Ted Zhang | 0.15 to 0.25 on the initial entry |
| Pradeep Bonde | around 1, down to 0.25 in a bad market |
| Jeff Sun | 0.15 to 0.25, ramped to 0.35 when it's working |
| Oliver Kell | 0.2 to 0.5 |
| Marios Stamatoudis | 0.25 to 0.4 |
| Clement Ang | 0.3 to 0.5 (but sizes bigger) |
| Brian Shannon | 0.3 to 1, but can size up |
| Mark Minervini | 0.15 to 1 |
These numbers are based on interviews and don't cover everything. But you get the idea.
Note that I haven't included any @smbcapital traders, including @TheOneLanceB. That's because they use a different framework - dollar risk per trade, graded by trade quality.
Then I'd have set risk amounts. Okay, if um if I'm going to risk maybe 10K on an A, I want to risk 3K on a B, I might only want to risk 1K on a C. Whatever is the right amount for you.
Same formula, different label on the risk, with a quality grade doing the work his setup selection does.
So, the risk number isn't the edge. 17 different traders, most of them land between 0.15% and 0.5%. Sure, most of them also say they can risk more if the conditions are right, but the notable thing here is, in my opinion, how little a lot of widely successful traders actually risk per trade.
So, there's no secret here. But, there are some interesting behaviors related to the low risk number. And that's what the rest of the article is about.
Quick note on what these numbers are based on:
I reviewed all of Qullamaggie's streams and went through all of his tweets since 2011. I've then tracked all his actual positions and his stated positions, and cross referenced them with his own spreadsheet. It's not perfect, but it's good enough for us to take some lessons from it
How big he actually sized
Based on his own account-size tracking and the positions he either posted or talked about we can get a good picture of how he actually sized his long positions.
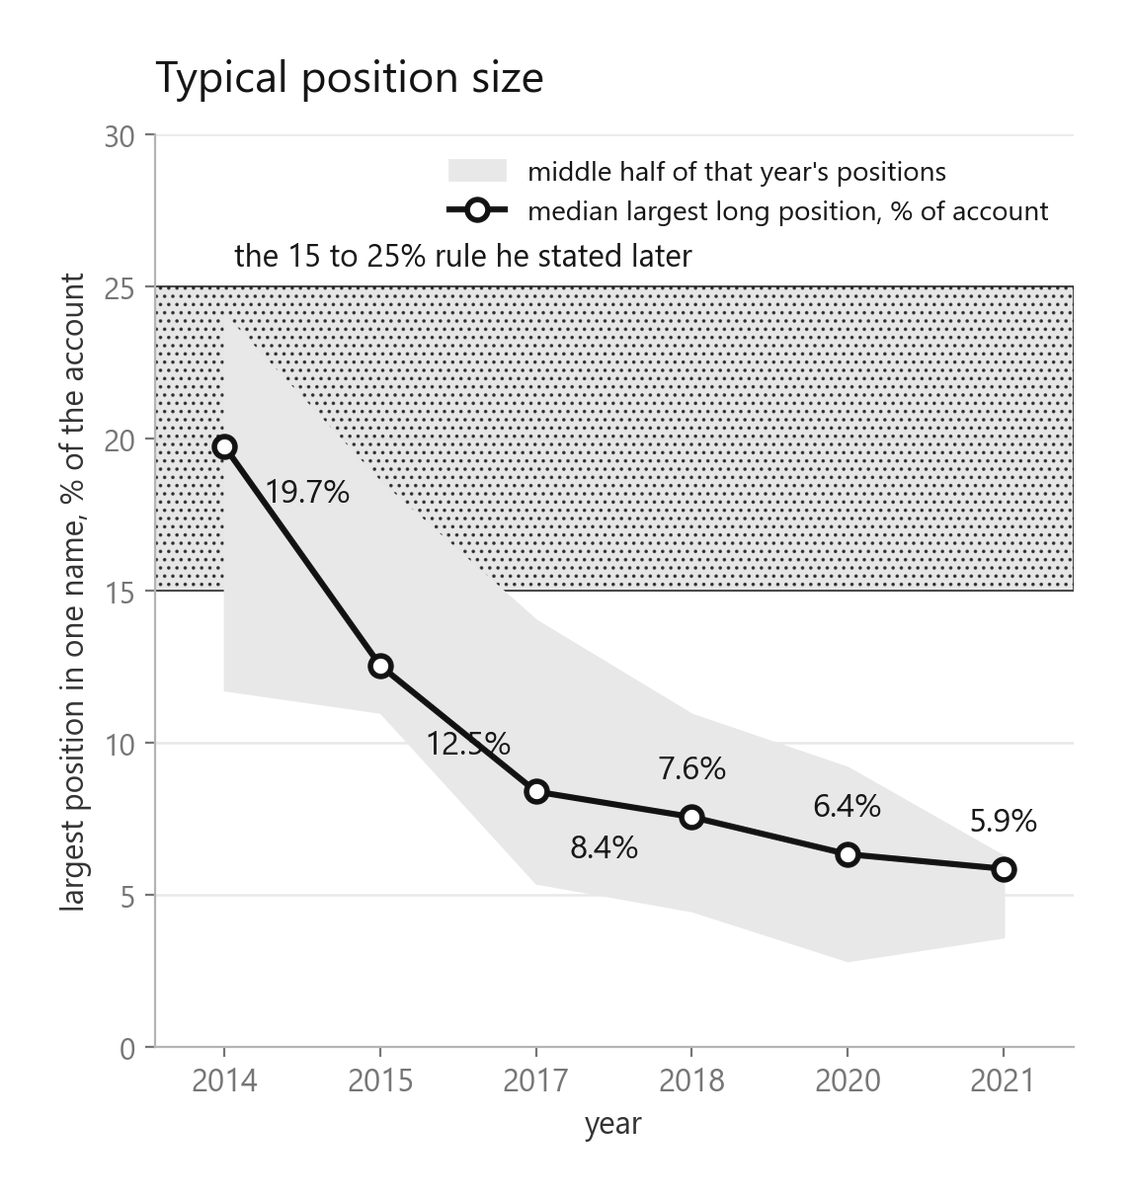
This is tracked trades at its biggest position, measured against his account size at the time, for long trades only. The number used is the median, so he did have bigger positions - and smaller. For most years the sample size was meaningful, but for 2015 and 2021 our dataset is limited.
The median largest long position, year by year: 19.7%, then 12.5, then 8.4, 7.6, 6.4, 5.9. He sized smaller every year.
Look at 2014. The median sits at 19.7 percent, mid band of the rule he'd state five years later, and the upper quartile at 24.0 percent sits under its ceiling. That's what a trader obeying the rule looks like. From 2017 onward he's never near it again, and by the end his typical largest position is a quarter of what it was. Only about 7% of his long positions ever exceed 25 percent of the account.
Don't get too hung up on the accuracy of the numbers. What's interesting here is the trend. The account grew, but the position size decreased.
Shorts play by different rules
For the years we have a meaningful sample, his shorts are much bigger than his longs. For example, in 2017 the median short was 14.8% of his account, while his median long was 8.4%.
He tends to scale in, or pyramid, into his shorts.
It's more common that I size into a parabolic type of, like when I short, but when I go long, I usually mostly buy it all at once. You know, either you get a trigger or you don't.
He's not afraid to put on risk intraday, and since the shorts are often day trades by nature, they get more size.
Intraday I can go up to around 50% in a single position, but overnight it's rarely more than 20 to 25%. Years ago those numbers were higher, but there's just no point taking that kind of risk now.
Qullamaggie on stream, June 2020
But shorting parabolics is a different beast, worthy of its own article soon.
How he actually sells a winner
In the exit study I previously published we looked at how we can achieve different goals with different sell rules - drawdowns, profits or winrate.. It's worth a read, as it will make the next session easier to follow if you are familiar with the basics.
Let's look at three concrete examples of how Qullamaggie sells a winner.
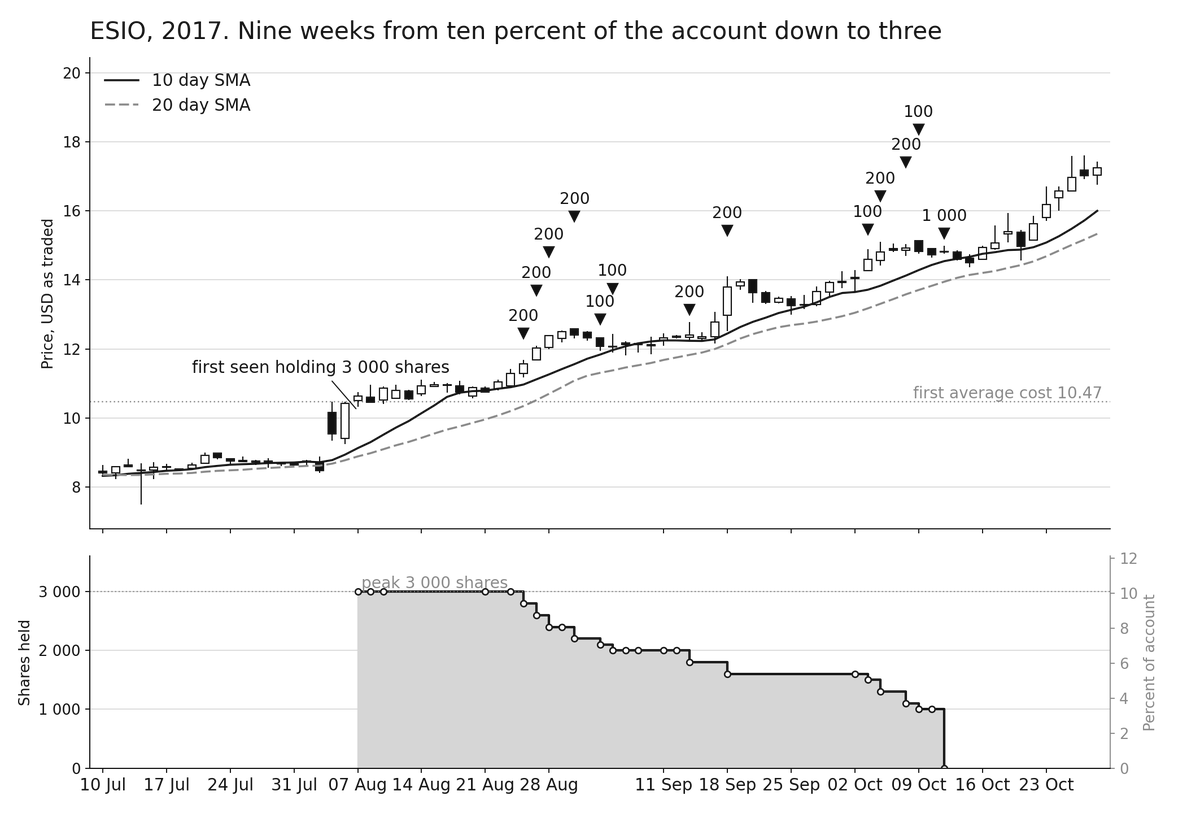
ESIO, August to October 2017. Bought 3,000 shares, 10.1 percent of the account. I was surprised by the patience. Six weeks in, more than half the position was still on. It works down from 10.1 to 3.4 percent of the account, then out entirely in mid October.
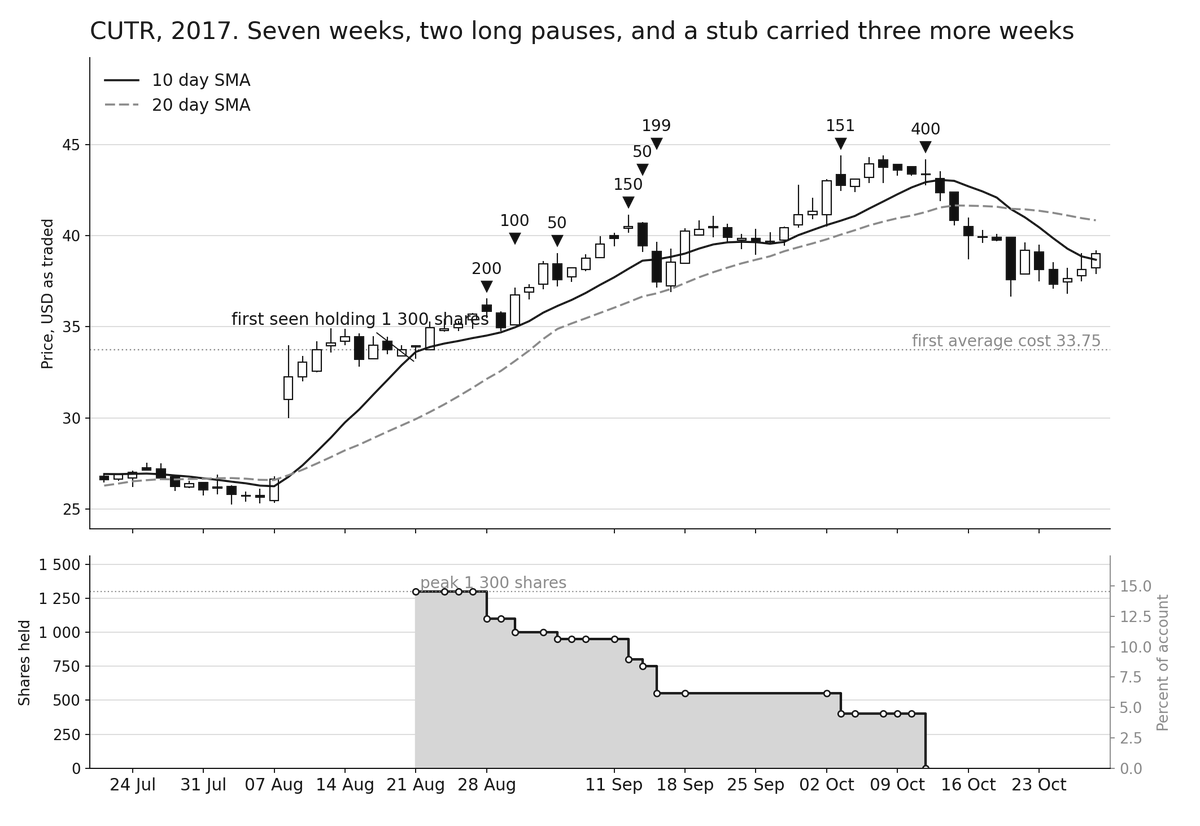
CUTR, same year. Bought 1,300 shares, 15.1 percent of the account. It's interesting that he already back then also trailed with the 20-day. Notice how he closed the full position the same day as the ESIO trade.
ATH, February 2017, the opposite profile. Bought 2,000 shares, 22.7 percent of the account. It's cut in half in three sessions and down from 22.7 to 6% in four, biggest sale first, the reverse of ESIO. The cost basis also rises on the way out, from 47.90 to 52.45, so he's adding some at some point.

All of these trades were made in 2017. So let's look at one he made on stream.
A trade breakdown from his streams
SE, May 2020. He bought a full position on the breakout.

We don't know how he managed the trade initally. But we know how much he has left of the position after three weeks.
I have a half size left on this thing. I mean, you know, it it did go up 47% from entry, so I mean, I was just forced to sell a bunch.
A week after that, up another leg, another piece. Then in the middle of June he breaks it down for us.
I think I bought 15,000 shares when it broke out here in the 50... where was it here? 57 area. So and I only have 3,900 shares left.
I'm going to sell a little bit more. I have less than a third left of my, I have like a quarter left now that I sold some more. I only have 3,000 shares.
Two weeks after that he's still carrying those three thousand shares, a fifth of what he started with, trailing the 10 day average until it finally gives way in the middle of July. Ten weeks from entry to exit. Same shape as ESIO three years earlier: no rush in selling everything, the biggest cuts in the middle, and a leftover that rides the trend to the end.
Which makes us ask:
So how much of the move did he actually capture? SE made almost a 100% move, but he captured about 60%. CUTR made almost a 30% move, but he captured about 17-19%. ESIO did about 40% move, and he captured about 30%.
And that is representative across the other trades we have reasonable data for. As a rule of thumb, he captures about 50% of the potential full move on the long side.
It's called discretionary trading for a reason
But, like most of us, Qullamaggie sometimes breaks his own rules.
I didn't follow my sell rules, and if you don't follow your sell rules, you suck. I sold TSLA early and now I regret it every time I look at it.
I sold NVAX because it doubled in a couple of weeks and looked extended - thought it was going back down. I sold it and it went up another 150%. If I had just used the 10-day moving average as my trailing stop, I would have caught the whole move.
And like us.. he would often be better of following his rules..
But, its informative for us to understand what makes him break his rules.
Chart weakness is the number one reason why he sized down
But not in isolation. He often also factors in the general market- and sector weakness.
FMCI, I sold a third of my position, took out yesterday's lows, uh, and also now it's breaking below the rising 10-day moving average. So I'm lightening down. This is how you lighten down on a momentum stock once they start breaking support areas
Qullamaggie on stream, 2020-06-24
But he's surprisingly good at staying disciplined and following his rules. But since it's part of his system to sell into strength, this makes it psychologically easier to follow the rules. We touched on this in the exit study, and Qullamaggie doesn't hide the fact that emotions play a factor.
if you feel like you're scared, you can always size down, okay? Always sell down to your sleeping points.
Qullamaggie on stream, 2020-10-14
Starters, pilot positions, pyramiding
Qullamaggie claims he doesn't pyramid into breakouts.
But I usually don't do starters on my longs. I usually buy my full position. I only do starters on shorts.
Analysing the transcripts we find that he breaks this rule as well, sometimes.
But sometimes when it's a really, really good setup, like a really, really good, I may anticipate with half size or something, but I rarely do that.
It's hard to quantify, but I'm under the impression that he tends to use starter and pilot positions more often than what we, and himself, gives him credit for.
But, buying the full position is definitely the rule and what he most often does. Mostly. Here's one of the exceptions with the shares attached, because it shows how he uses starter positions.
ACB, May 28th 2020 breakout:

I'm trying to do a starter ACB here.
I have 30,000 shares now. I'm still trying to get some on dips.
If it can break that range, I'm gonna add more. I bought 35,000 shares so far.
I just added another 15,000 shares to ACB. I have 50,000 shares now
It's not a huge part of his strategy, but it's something not much talked about, cause people tend to regurgitate the "buy the full position at once".
This is progressive exposure on the individual trade level. Let's look at how he treats it at the account level.
We have to deserve exposure
I said he had three rules. There's actually a fourth. It's related to speed. Or exposure tempo.
When things are going well, I use margin at least half the time. But I never go from 100% cash to full margin. I would take weeks, if not months, to make that transition.
Qullamaggie, in his Market Wizards interview with @jackschwager
He talks about it on stream as well.
You don't go like zero to 100 in one or two days, you know, going on margin, you know, it takes weeks.
And you need to start seeing gains in your prior buys before you add more exposure.
He uses the feedback he gets from his open trades as a gauge for how hard he should push. We came to a similar conclusion in our Market Breadth study. The best indicator for a favourable market is how our current trades performs.
You always have to deserve taking on more risk. You never add more risk if you don't deserve it.
I really like how it all comes together, and how each dial affects the other. The risk percentage and position size limits one trade. The exposure tempo limits a bad week. And that bad week is what limits our long term gains, once we get over being ruined by a single trade.
This really helped me appreciate the fact that this is not a sprint, and we can allow ourselves to be patient.
How he can hold thirty positions
Across all his streams, the median number of long positions (breakouts and episodic pivots) he held was 8. By now, you know he didn't carry 8 full positions.
By the very nature of how his trade management, when the market is favourable his position list tends to grow.
I need to clean my portfolio anyways. I have 21 positions on. That's what happens when the market goes on a prolonged run. I just build up a lot of positions. Most of them are partials.
Qullamaggie on stream, 2019-11-27
The trades we have his exact trade management for supports this.
Most positions spend their final stretch as a stub, a few percent of the account that sits for days or weeks after the real selling is done. He scales out, but almost never to zero, and the stubs pile up: in a good market he opens new names faster than the old ones close, so the count grows on its own. His own counts run into the low thirties in good markets, 32 twice and 33 at the peak, against the ten to fifteen he calls normal. And when most of the names are leftovers at a few percent rather than full positions at fifteen or twenty, everything adds up to the 120 to 160 percent exposure he claims himself.
Here's how this all plays out: take the first of July 2020, one of the most crowded days, with 25 names open. Three of them he bought that morning. Four he bought the day before. Eighteen are older than that. So on that day maybe seven of the 25 are still full size, and eighteen are leftovers, already sold some into strength.

You can watch how it ebbs and flows: a dozen or two names through the autumn of 2019, 31 longs at the January 2020 top, a single name in the March 2020 crash, the high twenties again in the July 2020 boom and in mid January 2021.
You size down on some, then you buy new ones, and you just, you know, rotate your money. And you then you end up with a lot of partials.
At some point he joked about the correlation between hitting 30 open positions and the incoming market pullback.
Not market crash, but usually there is a market pullback soon after I hit 30 positions in my portfolio
We're like four, four, four for four right now, right? Every time I hit 30 positions, we got a multi-week, multi-month pullback.
The long positions list is a measure of how long the market has been favourable. A market that is good for a long time will eventually need a break.
Where his buying power comes from
By now we've demonstrated how most of his positions are not full positions. If they were he'd run out of buying power after 4, and max his margin at 8.
There's two parts to explain where he gets his buying power from.
A look at his position lists from 2017 gives us insight at how his positions are actually sized.
On dates where the data shows twelve or more names, the median single position is 7.4 percent of the account, and 70 percent of positions sit under 10 percent. The typical crowded day is one core at 15 to 25 percent, a couple in the 10 to 15 band, and a belt of leftovers below that. The densest day in the whole dataset holds 22 names at 150.9 percent of the account, and the median 2017 day runs at 118.2. All of it inside Reg-T overnight margin.
The second part is account turnover. In 8 months he traded his whole account balance 40 times. This means he recycled his account about once a week. So, the buying power isn't parked in 30 positions. It rotates through them. See how well this connects to the sell rules-study?
Quick note on margin
He uses margin, but not as aggressively as I imagined.
Two times is max margin for me? Yeah, but I never use two times.
The few times he specifically talks about it, he has 120 - 160% exposure..
And he's very clear on what he thinks about us aspiring traders using margin.
And you shouldn't use margin if you have small accounts. There's no need. You're just going to mess up and blow up
Qullamaggie on stream, 2020-08-03
Size is the ability to hold
But, there's not solid technical reasons for having small positions. If you can stomach it, we should always size as big as we can.
the only reason I was able to hold it through a 36% pullback is because it's a small position size. There's no way I would have been able to hold it if I had 20% of my account in this thing.
He repeats this often. He doesn't sell just to lock in profits. He sells to make his positions easier to stomach when they eventually pull back.
He doesn't stay calm during a pullback. He stays calm because his position is small. It's small because he sold most of it when the market was going up.
Nobody can choose to be less bothered by a drawdown. But we can decide how much to save by the time a drawdown arrives.
He also resolves a seeming contradiction in his own advice. He says to start with a small risk, half a percent. He also says that one big win can make the whole game. These two ideas only seem to conflict if the position stays the same size. If we sell into strength, what's left is a small amount that costs almost nothing to keep and still gets the profit.
A small trailing position is better than no position.
His WKHS position management is a good example of this:
A practical approach to size ceiling
Nobody sizes to pure risk parity, cause that would mean we would need to have 40%, or more, of our account in many trades. Qullamaggies ceiling is 20-25%. You have a ceiling as well, whether you've written it down or not.
I wanted to find out what the different account ceilings meant in practice, and investigate whether it could influence our entry timings.
Cause there's a paradox here. We argue that an early entry and tight risks allows us to size up, and a later entry increases our risk and gives us a smaller position. But, if our max position size is 10% anyways, what's the actual benefit from entering early? Remember from our entries study how often we got stopped out by the 1m ORB?
Now, if we put some numbers to: Our position size is the smallest of what the risk asks for and our ceiling. And our expected returns is position size x avg. gain. With 0.5% risk we get this table:
| Max position size | Highest EV entry time |
|---|---|
| 10% | fifteen minutes |
| 15% | five minutes |
| 20% | one minute |
| 25% | one minute |
The limits is somewhere between 15 and 20%. Above this limit, the stop-loss is worth what it seems. Below this limit, the stop-loss is eaten up by the limit before it can become anything, and a slower entry is a better choice.
In other words, if your maximum position size is 10%, you might as well use the 15 minute ORB as entry.
The liquidity ceiling
Everything to this point works at any account size. What's left is the liquidity constraint. Unless your account has crossed seven figures it decides nothing for you. It decided almost everything for him. This article is already too long, so I will make that into it's own post.
When the account grew, the stocks changed
The clearest measurable change across the three years isn't in his rules. It's in what he was allowed to buy. The median stock he entered traded 34.6 million dollars a day in 2019. In 2021 that number is 415.4 million.
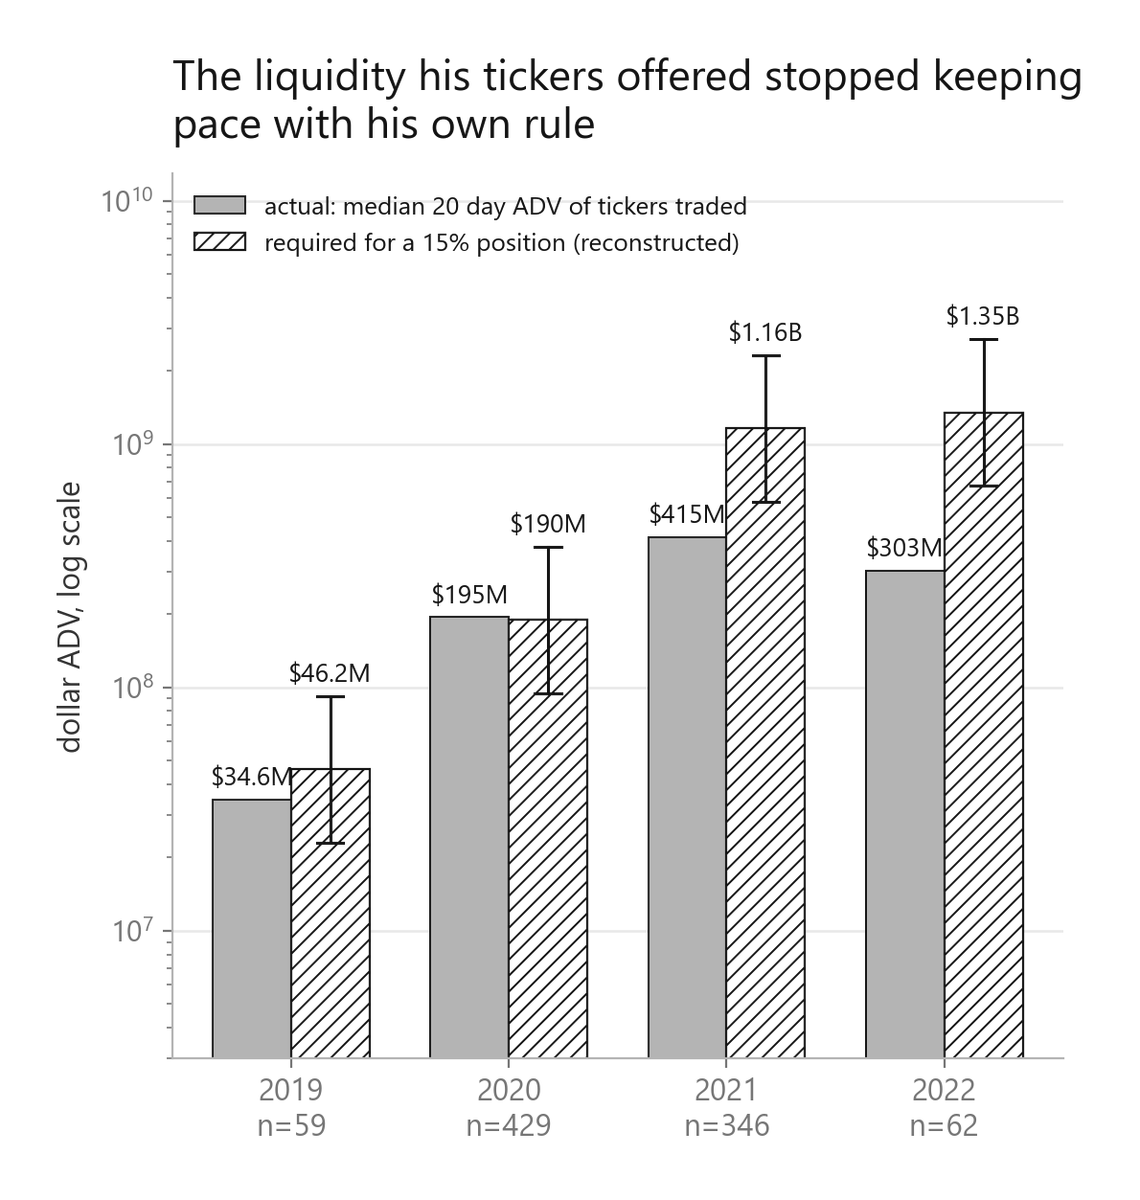
For Qullamaggie liquidity became an issue.
I wanted like half a million shares, but I'm not getting it. Didn't even get 200. Too thin. Way too thin.
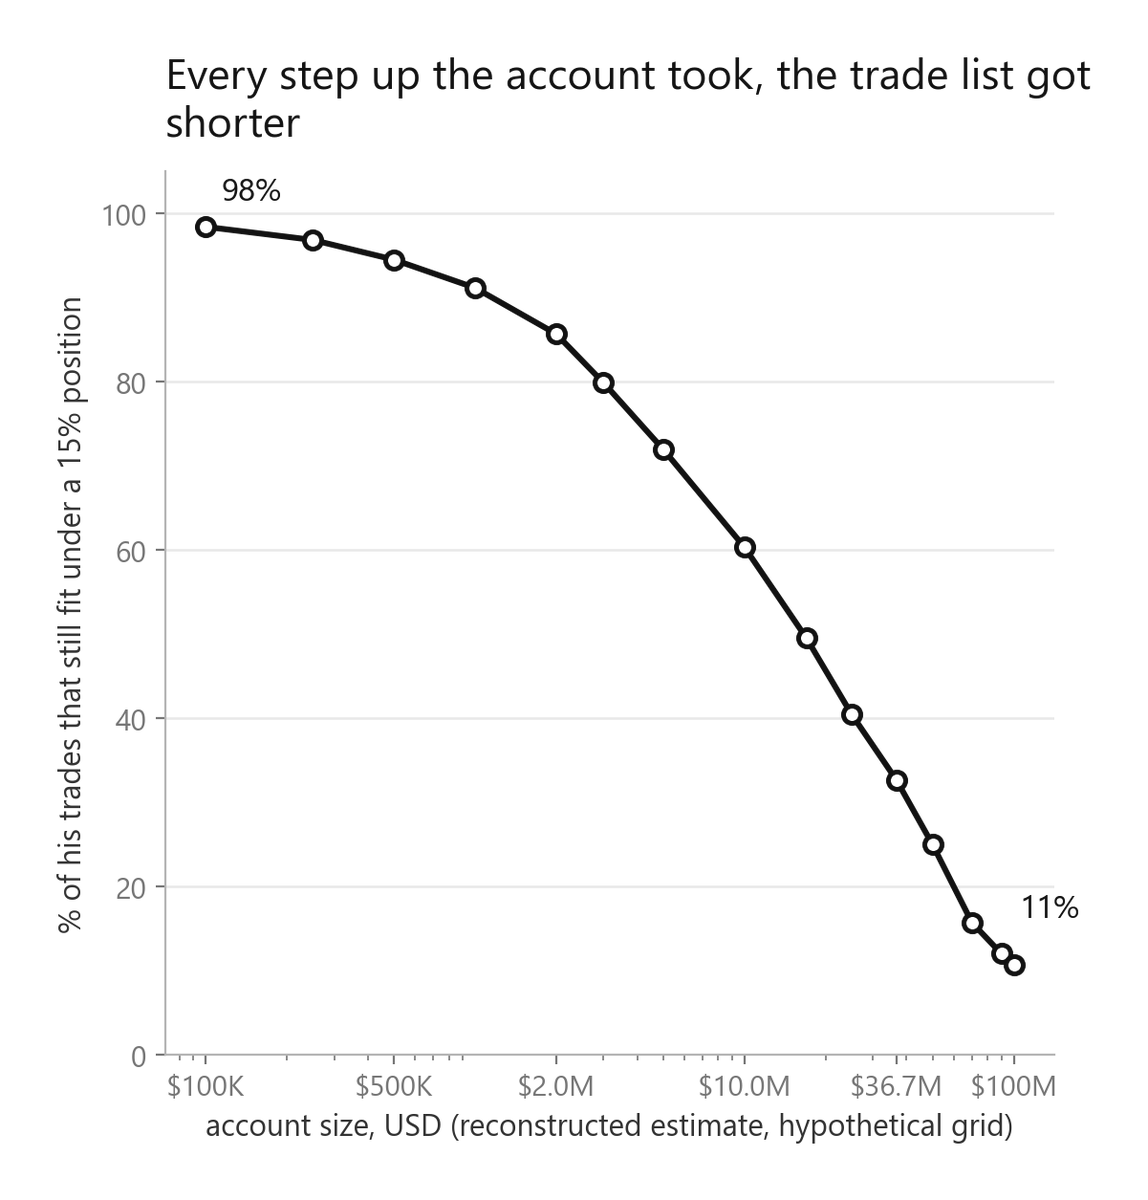
Most of us don't have this problem. I ran the numbers for when it becomes one. What percentage of his trades would have broken the 1 percent limit at a 10 percent position size.
At $100,000, the cap is almost insignificant. At $1 million, it affects 7.0 percent of his trades. At $25 million, it affects half of them.
Something I keep seeing is how people want to be in the liquid leaders. I keep asking myself: why? We want to be in the leaders which has enough liquidity for our account size. We should be copying his edge, not his constraints.
Four things I've changed in my trading
What's your takeaway from this article?
If you want to dig deeper and study actual trades you can check out app.qullamaggiedeepdive.com - where all the data for this study is available as well
I think it's the single best source to study how a real Market Wizard trades 🧙♂️
DM me and I will hook you up with a discount

