Understanding probability is essential in data science. In 4...

Matt Dancho (Business Science)@mdancho84
26 views
Apr 06, 2026
~2 min read
Advertisement
1
Understanding probability is essential in data science.
In 4 minutes, I'll demolish your confusion.
Let's go!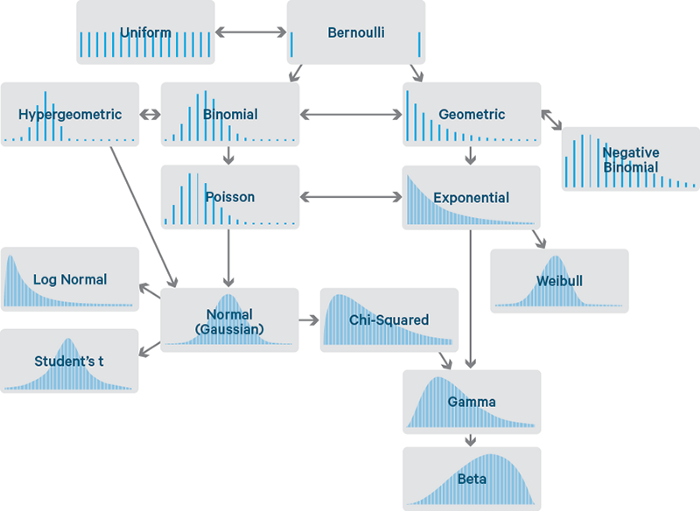
In 4 minutes, I'll demolish your confusion.
Let's go!
2
1. Statistical Distributions:
There are 100s of distributions to choose from when modeling data. Choices seem endless. Use this as a guide to simplify the choice.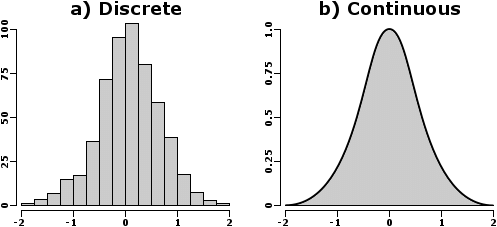
There are 100s of distributions to choose from when modeling data. Choices seem endless. Use this as a guide to simplify the choice.
3
2. Discrete Distributions:
Discrete distributions are used when the data can take on only specific, distinct values. These values are often integers, like the number of sales calls made or the number of customers that converted.
Discrete distributions are used when the data can take on only specific, distinct values. These values are often integers, like the number of sales calls made or the number of customers that converted.
4
3. Continuous distributions:
Used for data that can take on any value within a range or interval. These values are typically real numbers, like the percentage of visitors that converted or the forecasted revenue over the next 6 months.
Used for data that can take on any value within a range or interval. These values are typically real numbers, like the percentage of visitors that converted or the forecasted revenue over the next 6 months.
5
4. Probability Mass Function (Discrete):
Discrete distributions are described by a probability mass function, which gives the probability that a discrete random variable is exactly equal to some value. In a graph, a discrete distribution is often represented by a series of bars, where each bar represents the probability of each discrete outcome.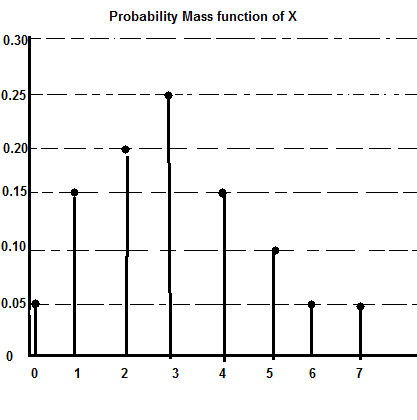
Discrete distributions are described by a probability mass function, which gives the probability that a discrete random variable is exactly equal to some value. In a graph, a discrete distribution is often represented by a series of bars, where each bar represents the probability of each discrete outcome.
6
5. Probability Density Function (Continuous):
Continuous distributions are described by a probability density function. The probability of the variable falling within a particular range is given by the area under the curve of the PDF within that range. In a graph, a continuous distribution is usually represented by a smooth curve.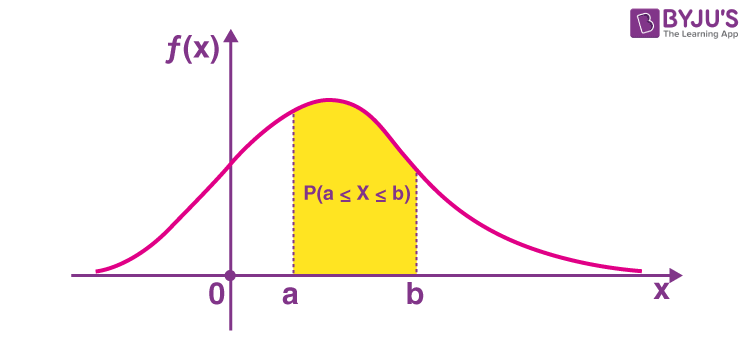
Continuous distributions are described by a probability density function. The probability of the variable falling within a particular range is given by the area under the curve of the PDF within that range. In a graph, a continuous distribution is usually represented by a smooth curve.
7
6. Parametric Models: Many models assume a specific distribution.
- Linear Regression: Assumes normally distributed errors.
- Logistic Regression: Assumes a binomial distribution of the response variable.
- Linear Regression: Assumes normally distributed errors.
- Logistic Regression: Assumes a binomial distribution of the response variable.
8
7. Non-Parametric Models:
These models do not make strong assumptions about the form of the data distribution.
- Decision Trees
- K-Nearest Neighbors
- Support Vector Machines
These models do not make strong assumptions about the form of the data distribution.
- Decision Trees
- K-Nearest Neighbors
- Support Vector Machines
9
8. Loss Functions:
Distributions will come up in Loss Functions in Machine Learning (e.g. XGBoost, LightGBM, CatBoost). Selecting the right Loss Function can often improve performance.
Examples:
- Poisson is used for count data.
- Tweedie for mixed continuous data with many zeros like intermittent demand forecasting problems.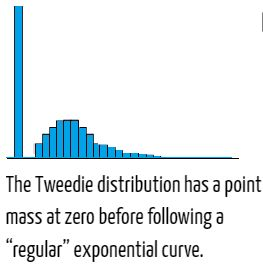
Distributions will come up in Loss Functions in Machine Learning (e.g. XGBoost, LightGBM, CatBoost). Selecting the right Loss Function can often improve performance.
Examples:
- Poisson is used for count data.
- Tweedie for mixed continuous data with many zeros like intermittent demand forecasting problems.
10
🚨 If you’re worried about data science career death in 2026…
I have a live workshop that will help (free).
I have a live workshop that will help (free).
11
Inside my live workshop, you'll get:
• My Generative AI + Data Science Process
• Applied to a Business Problem (not "toy" data)
• Actual Python code + AI Agents
👉Register here (500 seats): learn.business-science.io/registration-a…
• My Generative AI + Data Science Process
• Applied to a Business Problem (not "toy" data)
• Actual Python code + AI Agents
👉Register here (500 seats): learn.business-science.io/registration-a…


