We analyzed 62 Billion+ views from 2025 to find out what makes a...

Richard the Youtube strategist@Richard_YTS
322 views
Dec 19, 2025
~7 min read
Advertisement
1
We analyzed 62 Billion+ views from 2025 to find out what makes a video go viral on YouTube.
Title length, thumbnail colors, niches, video duration, we cover everything.
Here’s what we found👇🧵
Title length, thumbnail colors, niches, video duration, we cover everything.
Here’s what we found👇🧵
2
The report studied:
- 323,000+ outlier videos
- 50,000+ channels
- 300+ data points per video
And cost us $10,000 to create.
We’re giving away a free 1of10 Pro subscription to 2 creators who comment ‘1of10’ and retweet this thread (worth $1,000 each).
- 323,000+ outlier videos
- 50,000+ channels
- 300+ data points per video
And cost us $10,000 to create.
We’re giving away a free 1of10 Pro subscription to 2 creators who comment ‘1of10’ and retweet this thread (worth $1,000 each).
3
1. How long should you make your videos?
More than 50% of the videos we studied were shorter than 15 minutes.
BUT shorter ≠ better.
In fact, longer videos (1 hour+) tend to perform better on average.
And for videos under an hour, the sweet spot is 15–25 minutes.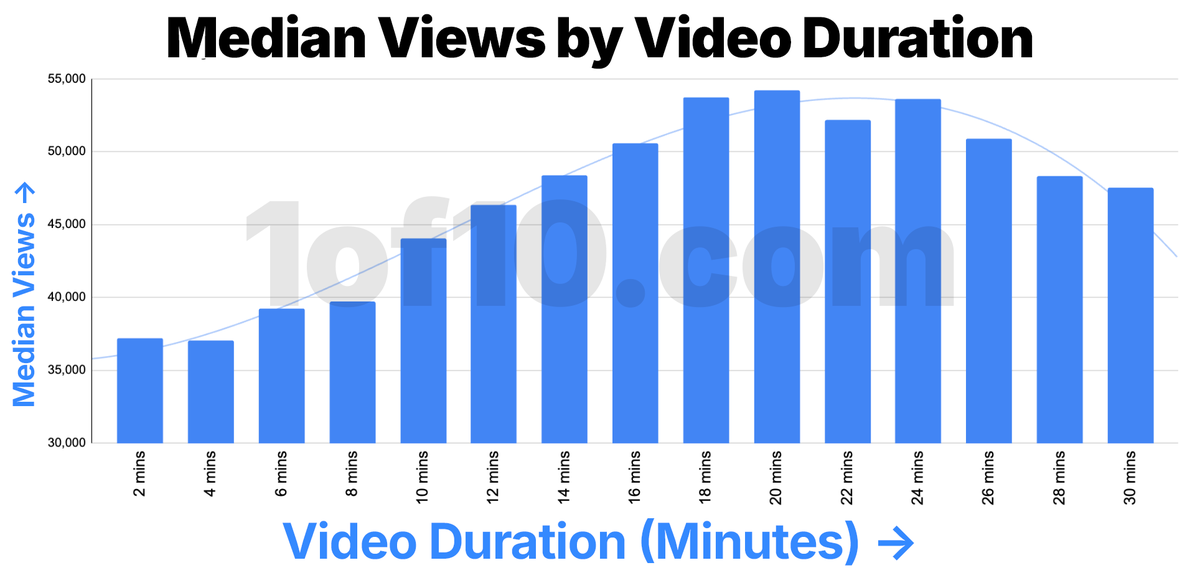
More than 50% of the videos we studied were shorter than 15 minutes.
BUT shorter ≠ better.
In fact, longer videos (1 hour+) tend to perform better on average.
And for videos under an hour, the sweet spot is 15–25 minutes.
4
Why is this?
Longer videos = more watch time = stronger recommendations.
But on an audience level, we’re seeing 2 things happening:
1. More watch-time coming from TVs (where longer content thrives).
2. More short-form content being consumed (which competes with short long-form content)
15-25 minutes hits the sweet spot. It’s more in-depth than shorts, is suitable for TV viewers, but still feels like an easily digestible piece of content and low time commitment.
30-60 minutes, however, is more in the danger zone.
The time commitment feels long, but the watch time can’t compete with videos longer than 1 hour.
Longer videos = more watch time = stronger recommendations.
But on an audience level, we’re seeing 2 things happening:
1. More watch-time coming from TVs (where longer content thrives).
2. More short-form content being consumed (which competes with short long-form content)
15-25 minutes hits the sweet spot. It’s more in-depth than shorts, is suitable for TV viewers, but still feels like an easily digestible piece of content and low time commitment.
30-60 minutes, however, is more in the danger zone.
The time commitment feels long, but the watch time can’t compete with videos longer than 1 hour.
5
And things get even more interesting when we break video length down by niche…
Below you can see the duration times that lead to most views per niche:
- Gaming, Entertainment, Sports
→ Peak around 15–30 minutes
Long enough for immersion, short enough to binge.
- Finance, Business, Tech
→ Stronger performance at 25–40 minutes
Depth + trust beat quick takes.
- Movies / TV, Music, Art
→ Clear spikes around 20–30 minutes
Context, breakdowns, and payoff matter.
- DIY / Engineering
→ One of the strongest cases for long-form (30–45 min)
Viewers want the entire process, not highlights.
- Lifestyle / Vlogs
→ Wide variance, but 15–25 minutes consistently wins
Too short lacks story, too long loses pacing.
- Tech
→ 28mins peak also makes sense for Tech due to longer tech reviews and more in-depth explanations of product features
Big takeaway:
There is no universal “best” video length.
But across almost every niche,
👉 mid-to-long form dominates median performance.
Below you can see the duration times that lead to most views per niche:
- Gaming, Entertainment, Sports
→ Peak around 15–30 minutes
Long enough for immersion, short enough to binge.
- Finance, Business, Tech
→ Stronger performance at 25–40 minutes
Depth + trust beat quick takes.
- Movies / TV, Music, Art
→ Clear spikes around 20–30 minutes
Context, breakdowns, and payoff matter.
- DIY / Engineering
→ One of the strongest cases for long-form (30–45 min)
Viewers want the entire process, not highlights.
- Lifestyle / Vlogs
→ Wide variance, but 15–25 minutes consistently wins
Too short lacks story, too long loses pacing.
- Tech
→ 28mins peak also makes sense for Tech due to longer tech reviews and more in-depth explanations of product features
Big takeaway:
There is no universal “best” video length.
But across almost every niche,
👉 mid-to-long form dominates median performance.
6
2. How long should your titles be?
Shorter titles consistently perform best…
And this makes sense because every additional word adds friction.
Long titles:
- Increase cognitive load.
- Slow decision-making.
- Feel less confident.
But things get more interesting when we break down title length by characters 👇
Shorter titles consistently perform best…
And this makes sense because every additional word adds friction.
Long titles:
- Increase cognitive load.
- Slow decision-making.
- Feel less confident.
But things get more interesting when we break down title length by characters 👇
7
Titles around 30 characters get nearly 60% more views than titles 70+ characters.
But what’s interesting here is that we see a sharp drop off around the 60-70 character mark.
This is right around where Youtube begins to cut titles off in certain displays.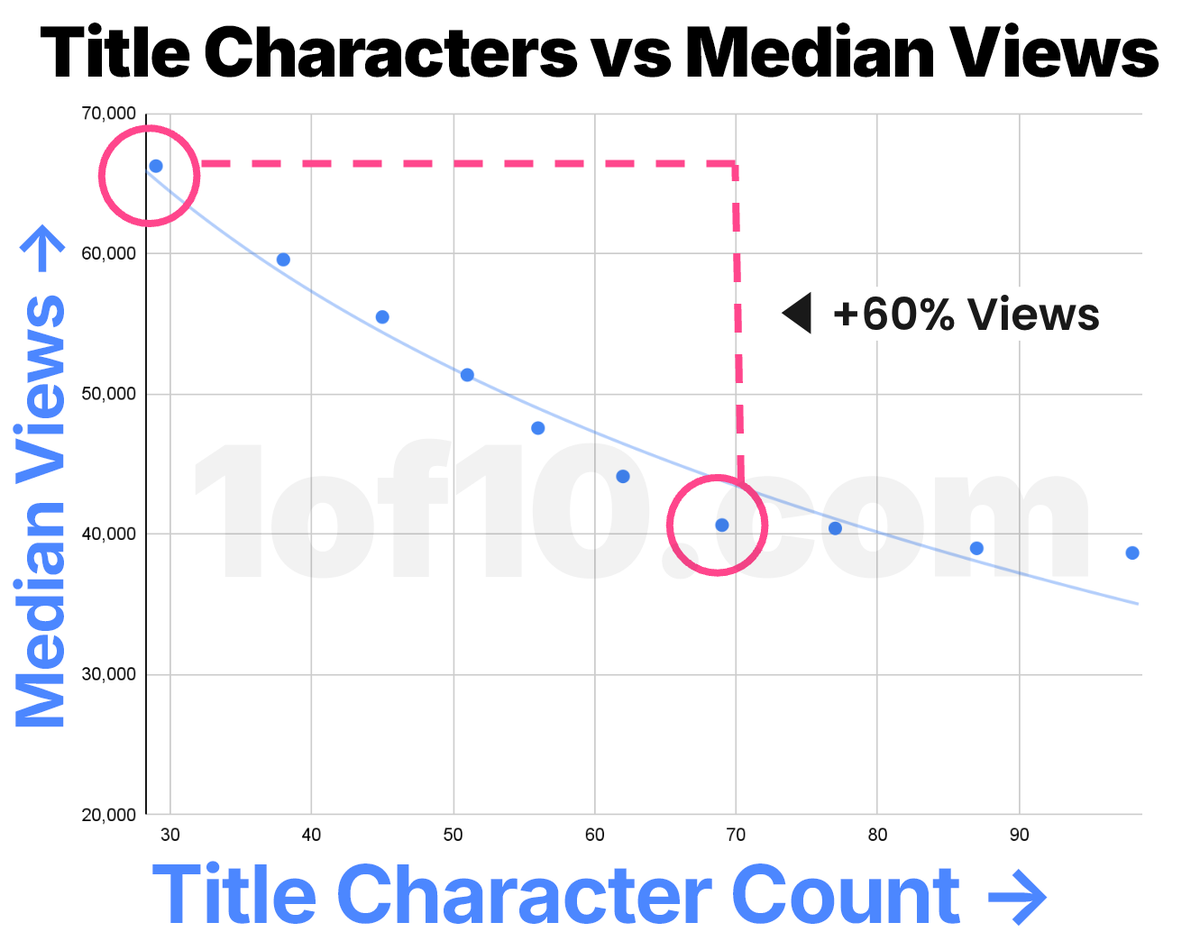
But what’s interesting here is that we see a sharp drop off around the 60-70 character mark.
This is right around where Youtube begins to cut titles off in certain displays.
8
But when we split this by Educational vs Entertainment content, a big difference appears…
Title length matters far more for entertainment videos than it does for educational ones.
This is because educational content is watched with intent, e.g. “I want to learn X”
So as long as the title clearly signals the topic, extra words don’t hurt performance much.
Entertainment content is clicked on impulse.
The title has to:
- Create curiosity
- Trigger emotion
- Win attention *instantly*
Every extra word adds friction.
That’s why we see a sharp drop-off in performance as entertainment titles get longer, while educational titles are far more forgiving.
Title length matters far more for entertainment videos than it does for educational ones.
This is because educational content is watched with intent, e.g. “I want to learn X”
So as long as the title clearly signals the topic, extra words don’t hurt performance much.
Entertainment content is clicked on impulse.
The title has to:
- Create curiosity
- Trigger emotion
- Win attention *instantly*
Every extra word adds friction.
That’s why we see a sharp drop-off in performance as entertainment titles get longer, while educational titles are far more forgiving.
9
3. Do faces help thumbnails?
Overall, there’s minimal difference in performance…
But when we zoom in, the impact of showing your face in a thumbnail varies greatly by niche.
E.g. in the finance niche:
Showing a face in the thumbnail performs 36% better on average.
(Faces add trust and credibility in this niche)
V.s gaming, where showing a face in the thumbnail performs 3% worse on average.
(Gameplay, characters, and action frames outperform creator faces because the content is the star, not the person)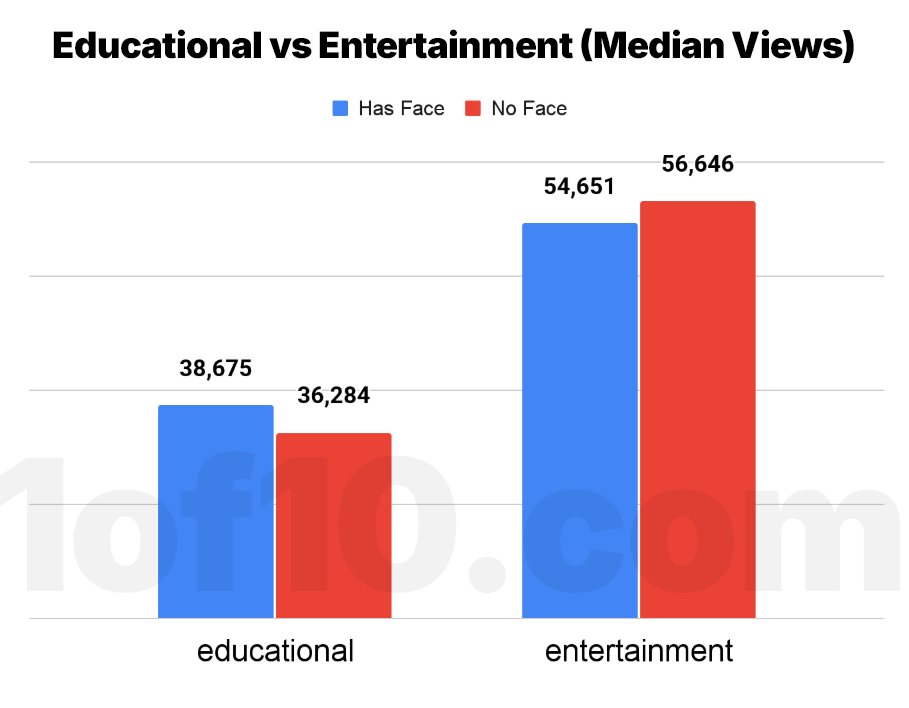

Overall, there’s minimal difference in performance…
But when we zoom in, the impact of showing your face in a thumbnail varies greatly by niche.
E.g. in the finance niche:
Showing a face in the thumbnail performs 36% better on average.
(Faces add trust and credibility in this niche)
V.s gaming, where showing a face in the thumbnail performs 3% worse on average.
(Gameplay, characters, and action frames outperform creator faces because the content is the star, not the person)
10
Interestingly, multiple faces consistently outperform a single face.
This is likely because multiple faces imply interaction, collaboration and are generally an indication of a higher production video.
Two (or more) faces instantly signal:
- A moment is happening
- A reaction or conflict exists
- Other people found this interesting
- (Maybe) a collaboration
That social + emotional context stops the scroll and gets clicks.
This is likely because multiple faces imply interaction, collaboration and are generally an indication of a higher production video.
Two (or more) faces instantly signal:
- A moment is happening
- A reaction or conflict exists
- Other people found this interesting
- (Maybe) a collaboration
That social + emotional context stops the scroll and gets clicks.
11
4. Should you include text in your thumbnails?
84% of videos in our report included text in the thumbnails.
But actually, thumbnails with text get 19% fewer views on average.
84% of videos in our report included text in the thumbnails.
But actually, thumbnails with text get 19% fewer views on average.
12
Why?
Thumbnails without text are more inclined to visually “show” the video, adding action or conflict as opposed to just labelling.
This visual cue can be picked up faster, making it easier to click.
But adding text also:
- Competes with the title
- Slows human processing
- Clutters the image
Thumbnails without text are more inclined to visually “show” the video, adding action or conflict as opposed to just labelling.
This visual cue can be picked up faster, making it easier to click.
But adding text also:
- Competes with the title
- Slows human processing
- Clutters the image
13
But it’s not always possible to show no text in a thumbnail.
So when you do use text, whats the best approach?
According to the data, thumbnails where the text is fewer than 10 characters and takes up less than 7% of the image perform best.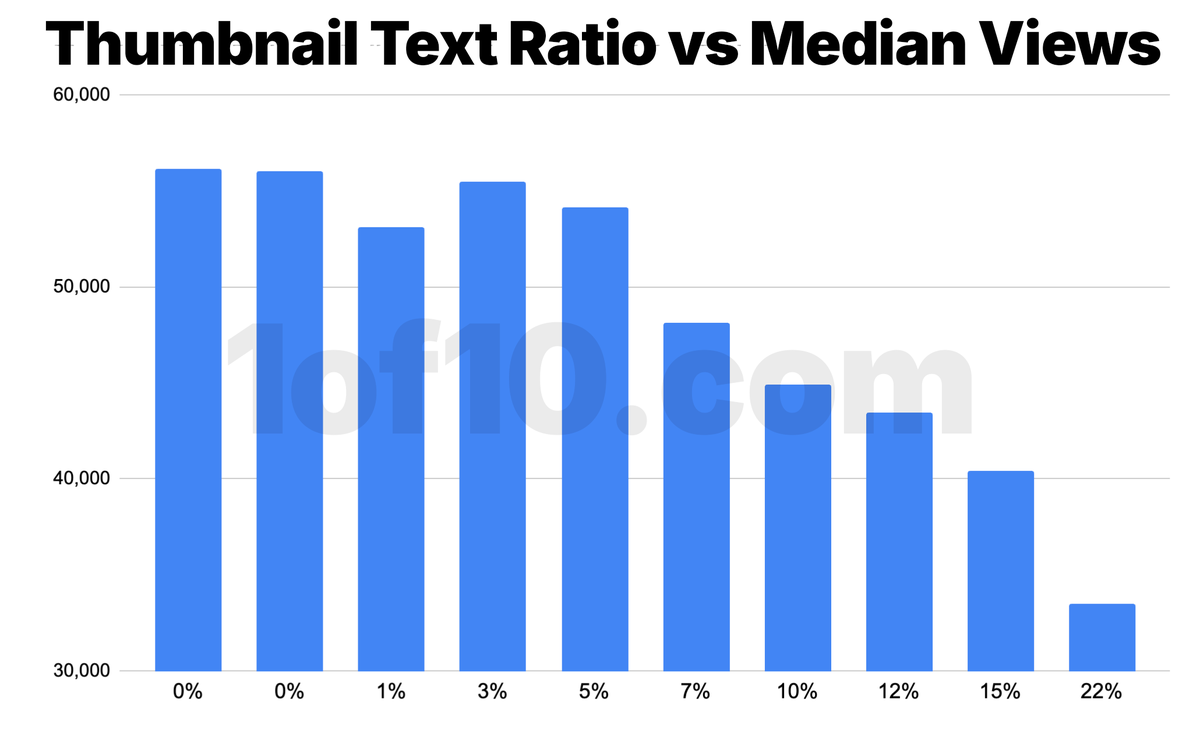

So when you do use text, whats the best approach?
According to the data, thumbnails where the text is fewer than 10 characters and takes up less than 7% of the image perform best.
14
5. How bright should your thumbnails be?
The brighter the thumbnail the better, but…
Median views peak when the average thumbnail brightness is 100–110
(measured on a 0–255 grayscale scale: 0 = black, 255 = white).
Dark thumbnails = lower contrast = fewer clicks.
(See the full 100+ page report for free to see more practical examples of this - link in bio)
The brighter the thumbnail the better, but…
Median views peak when the average thumbnail brightness is 100–110
(measured on a 0–255 grayscale scale: 0 = black, 255 = white).
Dark thumbnails = lower contrast = fewer clicks.
(See the full 100+ page report for free to see more practical examples of this - link in bio)
15
6. Which thumbnail colors perform best?
Top-performing dominant colors:
- Cyan
- Green
- Yellow / Orange
These colors win because they:
- Pop against YouTube’s mostly neutral feed
- Signal energy and clarity without visual fatigue
- Preserve contrast even after YouTube compression
But it’s worth noting, some of these colors could be influenced due to niche patterns.
E.g. sports could be affecting green, altering what it typically would be, etc.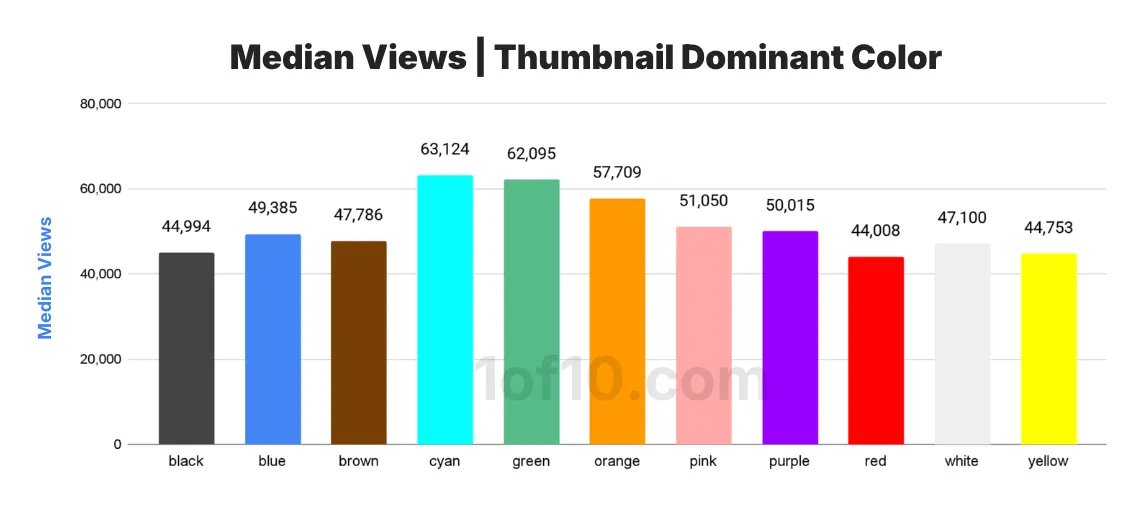
Top-performing dominant colors:
- Cyan
- Green
- Yellow / Orange
These colors win because they:
- Pop against YouTube’s mostly neutral feed
- Signal energy and clarity without visual fatigue
- Preserve contrast even after YouTube compression
But it’s worth noting, some of these colors could be influenced due to niche patterns.
E.g. sports could be affecting green, altering what it typically would be, etc.
16
7. How do numbers in titles impact performance?
35% of videos include numbers in their titles.
But, videos with numbers get ~11% fewer views on average.
Numbers often signal:
- lists
- explainers
- tutorials
Viewers click more for emotion, not structure.
35% of videos include numbers in their titles.
But, videos with numbers get ~11% fewer views on average.
Numbers often signal:
- lists
- explainers
- tutorials
Viewers click more for emotion, not structure.
17
8. What emotion should your titles target?
We categorized the videos into 9 segments, based on their titles.
And we found that the top-performing emotional buckets were:
Humor
Anger
Controversy
These emotions demand a reaction.
Your title’s job isn’t just to explain the video…
It’s to create emotional imbalance that clicking resolves.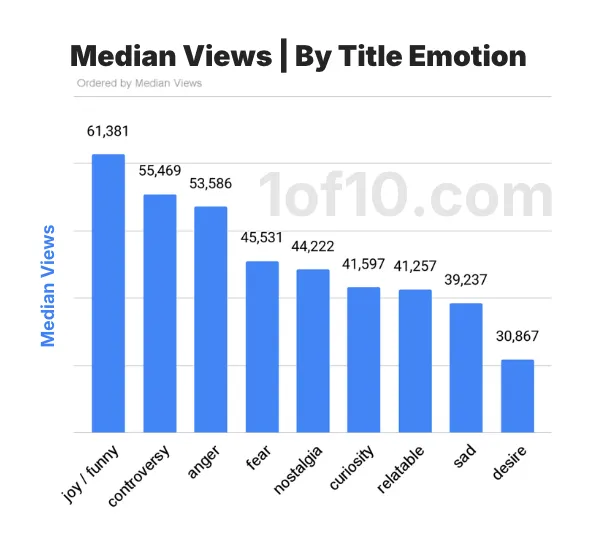
We categorized the videos into 9 segments, based on their titles.
And we found that the top-performing emotional buckets were:
Humor
Anger
Controversy
These emotions demand a reaction.
Your title’s job isn’t just to explain the video…
It’s to create emotional imbalance that clicking resolves.
18
9. Do negative or positive titles perform better?
66% of the videos in our data-set were neutral.
But the data shows that negative titles generally perform better on average regardless of whether the content is educational or entertainment.

66% of the videos in our data-set were neutral.
But the data shows that negative titles generally perform better on average regardless of whether the content is educational or entertainment.
19
10. Finally, which niche should I pick?
We mapped niches on two axes:
Y-axis = Median Views (baseline audience)
X-axis = Outlier Score (breakout potential)
Top-left: big audience, low breakout
Bottom-right: breakout potential, small audience
Top-right: best of both worlds
E.g. Gaming has:
- massive median views
- lowest outlier scores
Why? Extreme saturation + format sameness.
Top-right niches:
Movies/TV, Music, and “Other” (animals, politics, history)
These combine:
- strong baseline demand
- frequent external trends
- higher outlier potential
Politics → daily news
Movies/TV → constant releases
Music → nonstop drops
Animals/history → infinite scenarios
Trends manufacture breakout videos.
Business & finance reality:
- Low median views. Low outliers.
- Saturated topics + little novelty.
The niche isn’t bad, it’s just harder.
Across all niches:
- Median views range ~20K–70K
- Outlier scores range ~1.4×–2.4×
There are noticeable differences in each niche,
but it's not an "end all be "all, by any means.
We mapped niches on two axes:
Y-axis = Median Views (baseline audience)
X-axis = Outlier Score (breakout potential)
Top-left: big audience, low breakout
Bottom-right: breakout potential, small audience
Top-right: best of both worlds
E.g. Gaming has:
- massive median views
- lowest outlier scores
Why? Extreme saturation + format sameness.
Top-right niches:
Movies/TV, Music, and “Other” (animals, politics, history)
These combine:
- strong baseline demand
- frequent external trends
- higher outlier potential
Politics → daily news
Movies/TV → constant releases
Music → nonstop drops
Animals/history → infinite scenarios
Trends manufacture breakout videos.
Business & finance reality:
- Low median views. Low outliers.
- Saturated topics + little novelty.
The niche isn’t bad, it’s just harder.
Across all niches:
- Median views range ~20K–70K
- Outlier scores range ~1.4×–2.4×
There are noticeable differences in each niche,
but it's not an "end all be "all, by any means.
20
Virality isn’t random.
Across 300,000+ videos, the patterns are brutally consistent.
But this is just the tip of the iceberg, if you want to access the full 100+ page report for free, click the link in bio!
And if you found this thread helpful and want to see more reports like this, please comment + retweet (I’m sending 2 creators a free year of 1of10 Pro $1,000 value).
Across 300,000+ videos, the patterns are brutally consistent.
But this is just the tip of the iceberg, if you want to access the full 100+ page report for free, click the link in bio!
And if you found this thread helpful and want to see more reports like this, please comment + retweet (I’m sending 2 creators a free year of 1of10 Pro $1,000 value).
0:17


