1/ Chinese economic activity in May showed mixed results. The data...

Patrick Zweifel@PkZweifel
10 views
Jun 16, 2025
~2 min read
Advertisement
1
1/
Chinese economic activity in May showed mixed results. The data points to a Q2 GDP nowcast of 4% q/q ann., indicating a slowdown from Q1 (5.9%) but a slight improvement from April's nowcast (3.6%)
Chinese economic activity in May showed mixed results. The data points to a Q2 GDP nowcast of 4% q/q ann., indicating a slowdown from Q1 (5.9%) but a slight improvement from April's nowcast (3.6%)
2
2/
The positive surprise came from retail sales in China, which significantly rebounded after a slight contraction in April. This brought the six-month annualized growth to 10%, exceeding pre-pandemic average
While consumption was previously driven by service spending, this uptick in goods sales suggests a potential catch-up, although they still remain 13% below pre-pandemic levels
The positive surprise came from retail sales in China, which significantly rebounded after a slight contraction in April. This brought the six-month annualized growth to 10%, exceeding pre-pandemic average
While consumption was previously driven by service spending, this uptick in goods sales suggests a potential catch-up, although they still remain 13% below pre-pandemic levels
3
3/
Investments have slightly declined for the second consecutive month, bringing the six-month annualized growth rate to 8.1%, close to the pre-pandemic average
Investments have slightly declined for the second consecutive month, bringing the six-month annualized growth rate to 8.1%, close to the pre-pandemic average
4
4/
Investment spending remains strong in the manufacturing sector (>11%) and infrastructure (>9%), but there is still no sign of recovery in real estate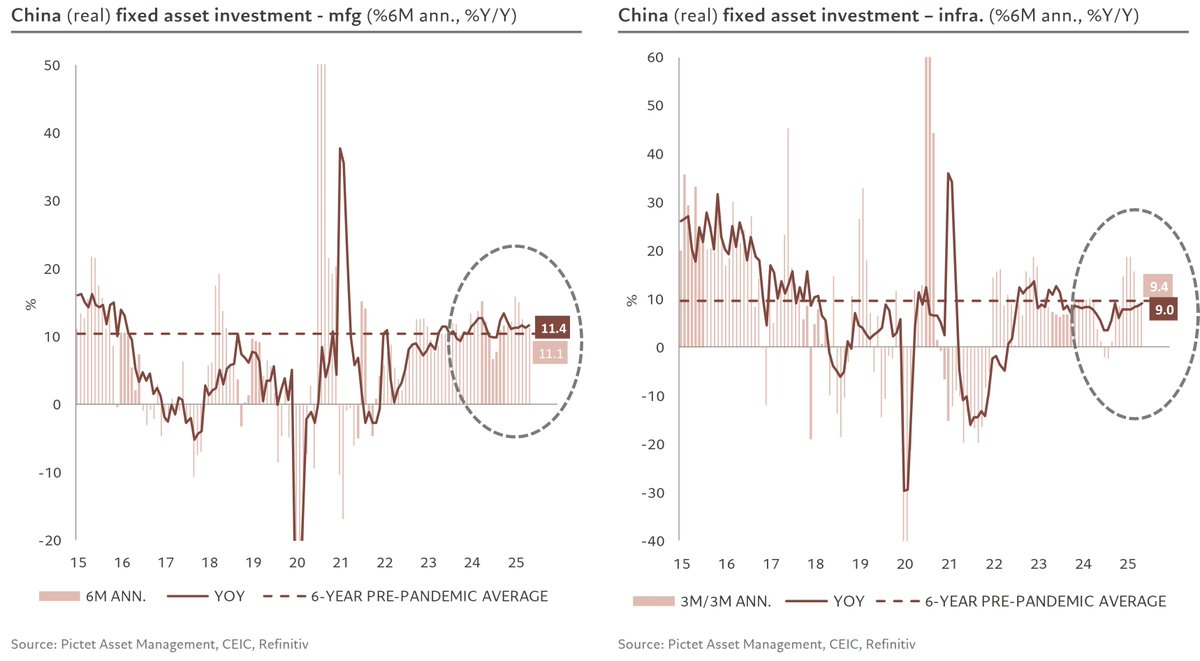
Investment spending remains strong in the manufacturing sector (>11%) and infrastructure (>9%), but there is still no sign of recovery in real estate
5
5/
Residential demand remains at its lowest point in the past 15 years, but has been relatively stable at these low levels for over a year, thus exerting a much less negative impact on overall growth
Residential demand remains at its lowest point in the past 15 years, but has been relatively stable at these low levels for over a year, thus exerting a much less negative impact on overall growth
6
6/
The inventory of unsold properties continues to decrease, albeit very slightly in May, but at 22 months, it still remains far from a normal level around 13 months. The downward pressure on real estate prices is expected to ease as a result, even though only 19% of cities saw an increase in May compared to 30% in previous months
The inventory of unsold properties continues to decrease, albeit very slightly in May, but at 22 months, it still remains far from a normal level around 13 months. The downward pressure on real estate prices is expected to ease as a result, even though only 19% of cities saw an increase in May compared to 30% in previous months
7
7/
No significant rebound in the property market is expected, as projections using four key factors indicate just 1.5% growth, well below overall GDP growth. This suggests the sector will continue to shrink in GDP size, currently at its 2004 level of 5.6%.
No significant rebound in the property market is expected, as projections using four key factors indicate just 1.5% growth, well below overall GDP growth. This suggests the sector will continue to shrink in GDP size, currently at its 2004 level of 5.6%.
8
8/
On the supply side, industrial production continues to remain significantly above pre-pandemic levels but has slowed over the past six months to below 5% annualized. This slowdown, stemming from a contraction for the second consecutive month, is likely due to external demand...
On the supply side, industrial production continues to remain significantly above pre-pandemic levels but has slowed over the past six months to below 5% annualized. This slowdown, stemming from a contraction for the second consecutive month, is likely due to external demand...
9
9/
... with US imports down by 24% compared to the end of 2024... although the increase in exports to ASEAN countries suggests a redirection of Chinese exports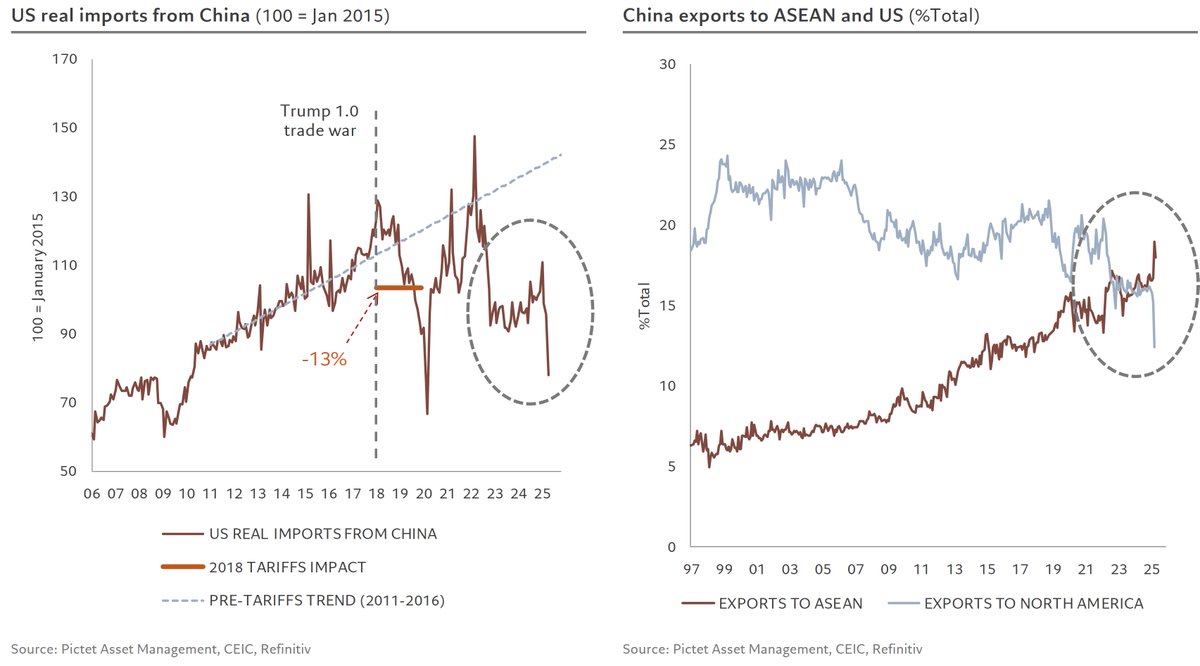
... with US imports down by 24% compared to the end of 2024... although the increase in exports to ASEAN countries suggests a redirection of Chinese exports
10
10/
Finally, total social financing (TSF) continues to expand, with growth close to 10% annualised over 3 months, resulting in a solid increase in credit impulse, around its highest level in five years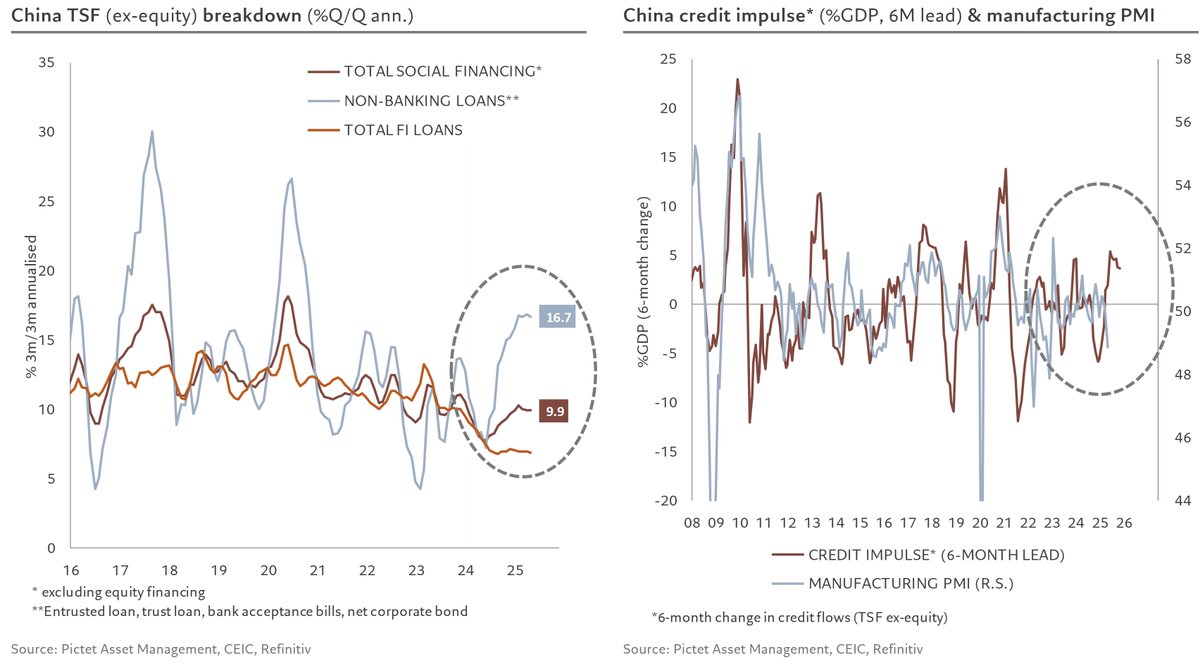
Finally, total social financing (TSF) continues to expand, with growth close to 10% annualised over 3 months, resulting in a solid increase in credit impulse, around its highest level in five years