Trading with a Higher Time Frame Bias Covering: - Top/Down Analysis...

Crypto Bully 🔥@BullyDCrypto
14 views
May 23, 2025
~1 min read
Advertisement
1
Trading with a Higher Time Frame Bias
Covering:
- Top/Down Analysis
- Achieving High Hit rates by using multiple timeframes
- Trading in line with HTF trend/direction


Covering:
- Top/Down Analysis
- Achieving High Hit rates by using multiple timeframes
- Trading in line with HTF trend/direction
2
Highest probability trades come from preparation and planning ahead with a top down approach.
Use higher time frames for the bias such as weekly for overall trend that is going to persist for days on end and generally higher probability, then drop down to daily, 4H, hourly, and lastly 15-minute for the execution.
Note: The higher the timeframe you trade on, generally the highest probability trades you'll end up taking and much less noice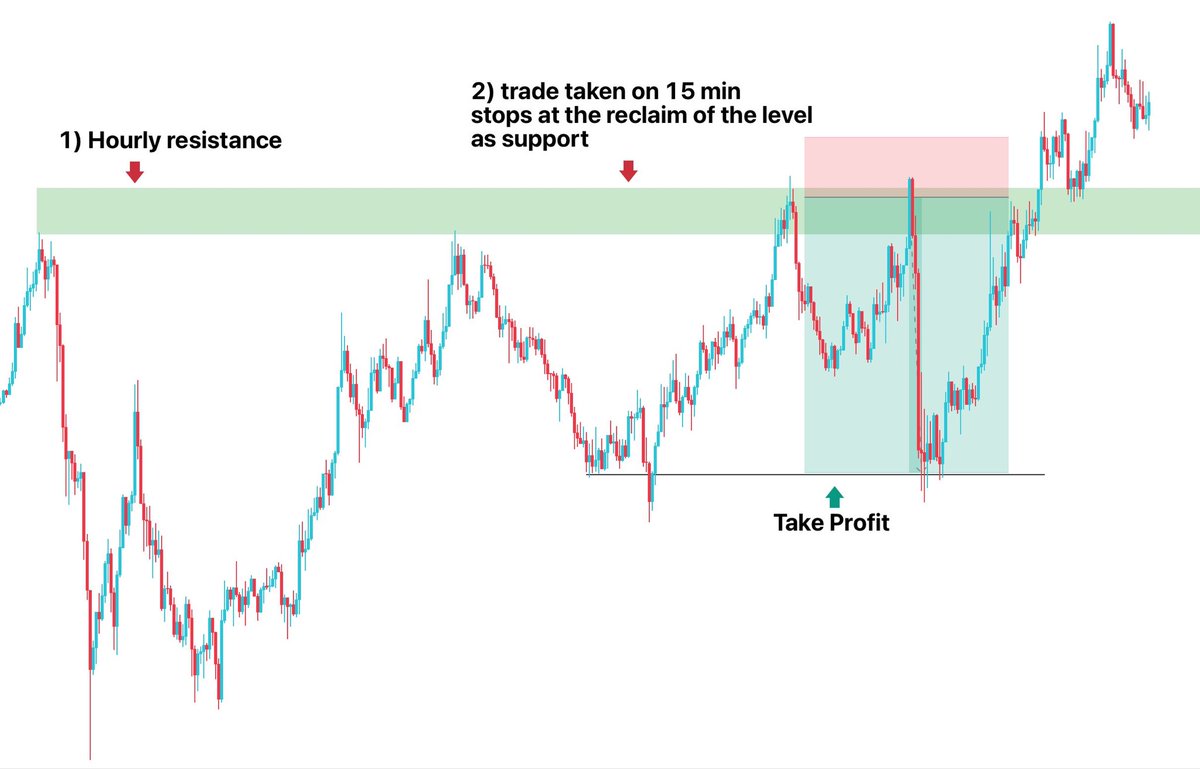
Use higher time frames for the bias such as weekly for overall trend that is going to persist for days on end and generally higher probability, then drop down to daily, 4H, hourly, and lastly 15-minute for the execution.
Note: The higher the timeframe you trade on, generally the highest probability trades you'll end up taking and much less noice
3
Bullish and bearish hammer candlesticks are key confirmation signals at support and resistance levels because they indicate strong price rejection and potential reversals.
A bullish hammer at support shows that buyers stepped in after sellers pushed the price down, indicating possible upward momentum.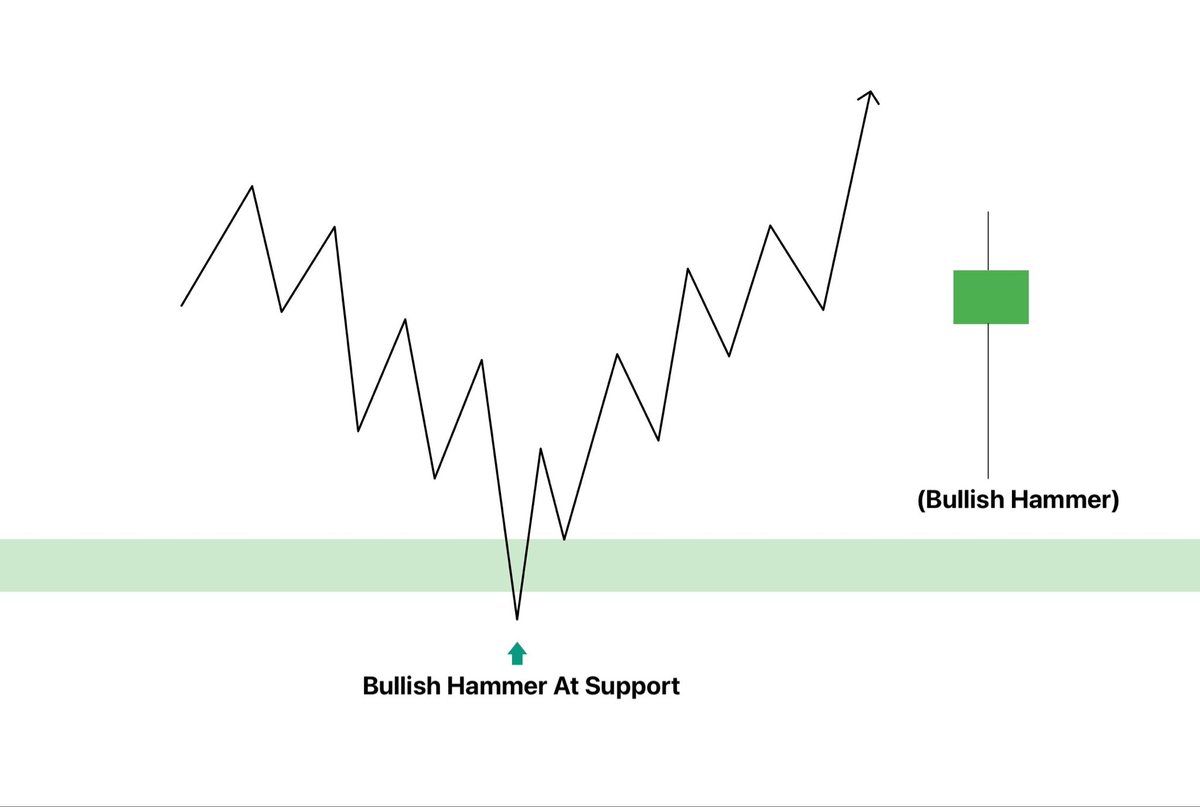
A bullish hammer at support shows that buyers stepped in after sellers pushed the price down, indicating possible upward momentum.
4
A bearish hammer (or shooting star) at resistance signals that buyers attempted to push the price higher but were overpowered by sellers, suggesting a potential downward move. When these patterns appear at significant levels, they reinforce the likelihood of a reversal

5
The chart above, is a bullish hammer forming at the end of a downtrend, resulting after a failed breakdown. This occurs when sellers try to push price lower but get outbid by limit orders at these key levels. The result is a quick reversal, often trapping aggressive short sellers.

6
This is 1/8 ways I form a HTF directional bias
Please leave a like/RT on the thread if you want more of these
Please leave a like/RT on the thread if you want more of these