My paper “Accounting for Slavery” presents a new database of state-...

joseph francis@joefrancis505
18 views
Apr 13, 2025
~4 min read
Advertisement
1
My paper “Accounting for Slavery” presents a new database of state-level GDP divided into 15 sectors for every census year in the US from 1839 to 1899.
I then use this new database to make a few gentle interventions in the slavery debates. 1/19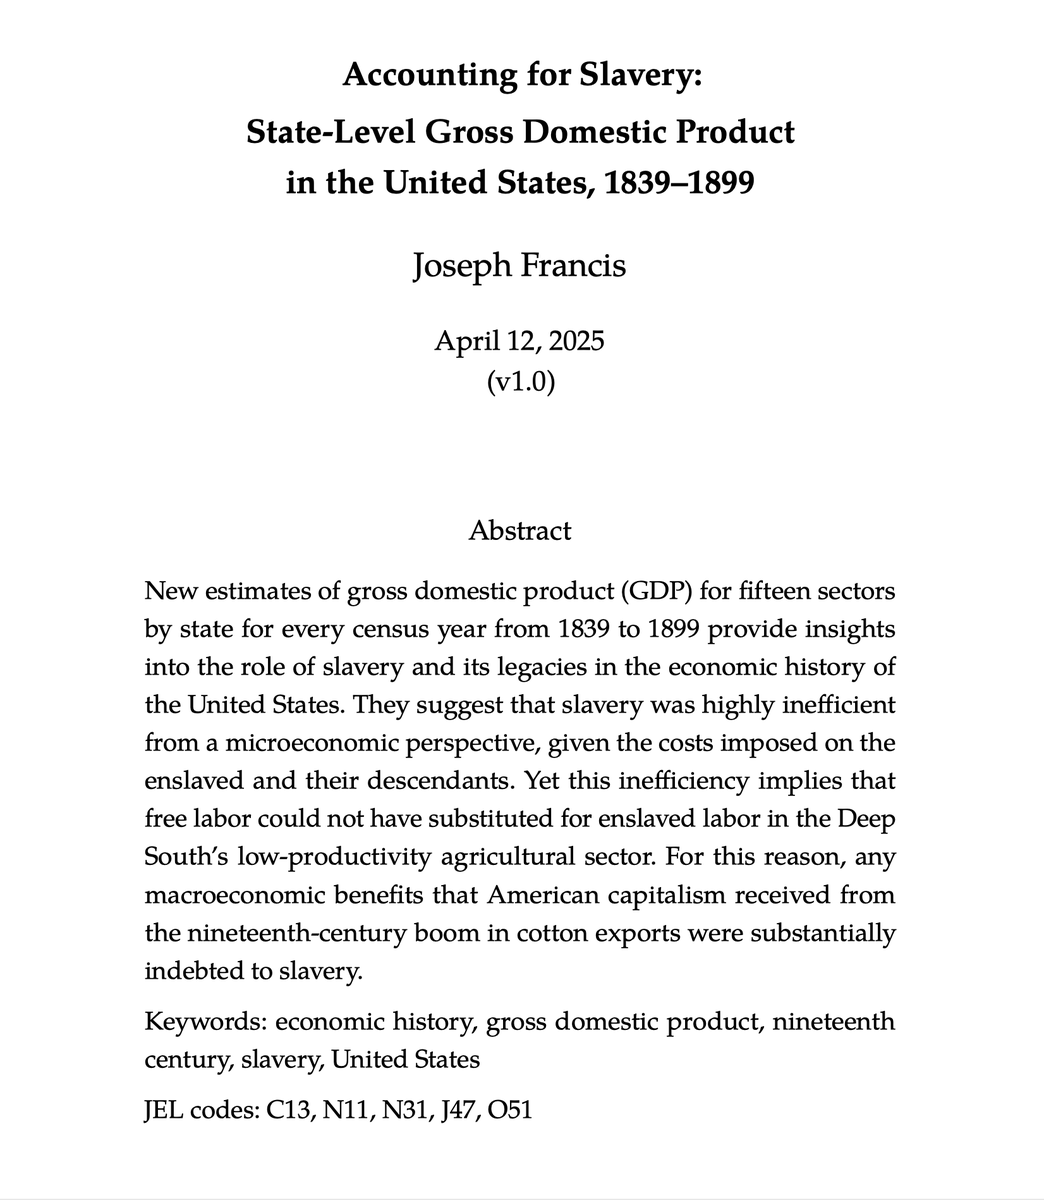
I then use this new database to make a few gentle interventions in the slavery debates. 1/19
2
These data are more granular and frequent than anything economic historians have worked with before for the 19th century.
As such, I have been able to shed some new light on old questions. 2/19
As such, I have been able to shed some new light on old questions. 2/19
3
For example, Easterlin long ago found that Southern personal incomes were relatively high before the Civil War and then declined afterward.
In “Time on the Cross,” Fogel and Engerman then took these numbers and used them to argue that slavery had aided the South’s growth. 3/19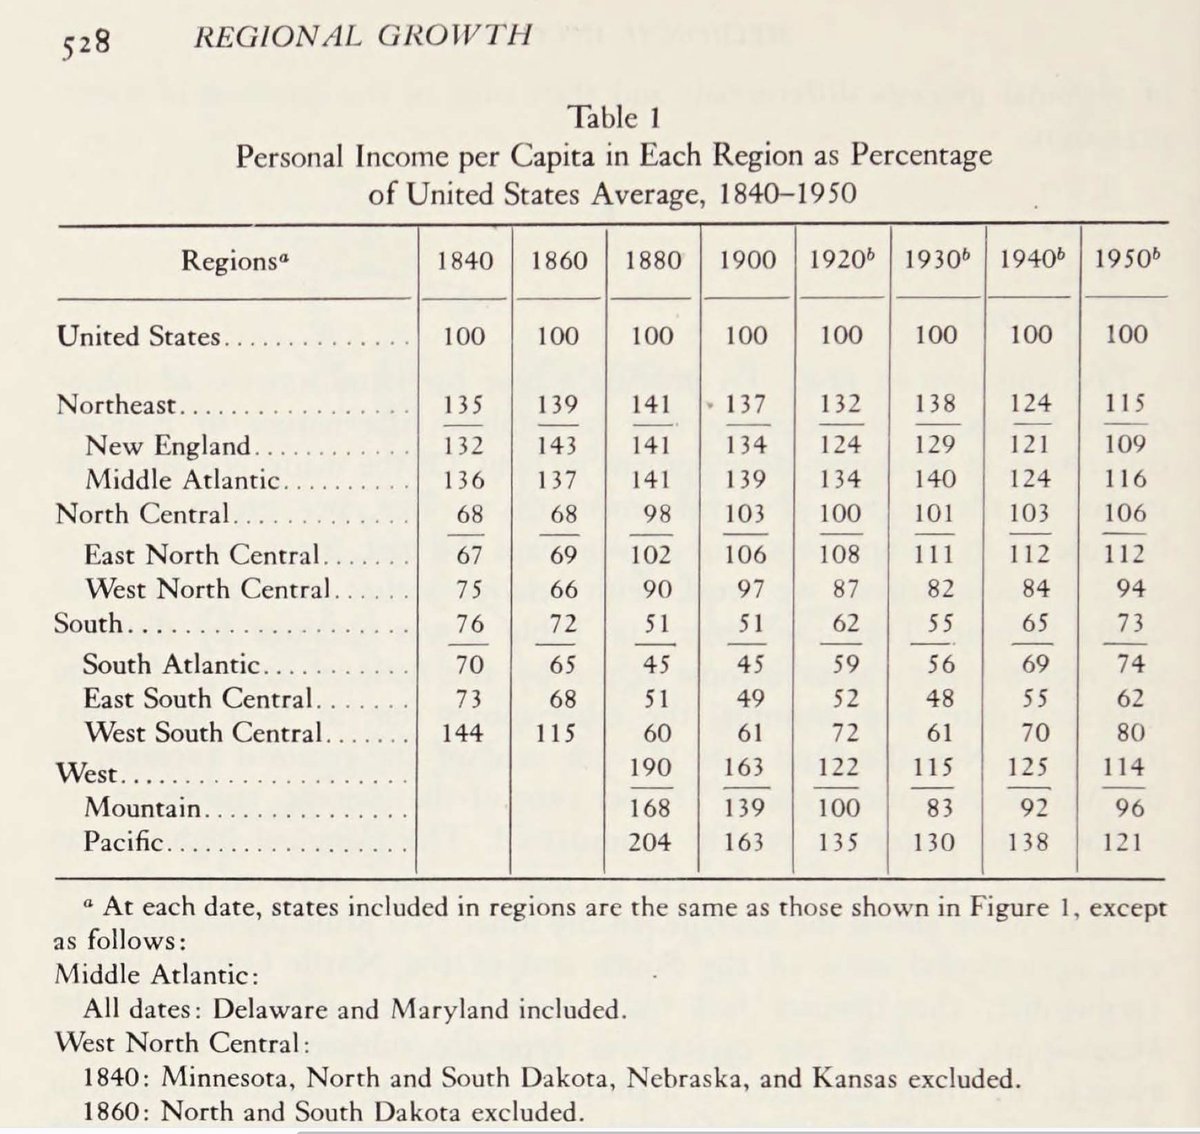
In “Time on the Cross,” Fogel and Engerman then took these numbers and used them to argue that slavery had aided the South’s growth. 3/19
4
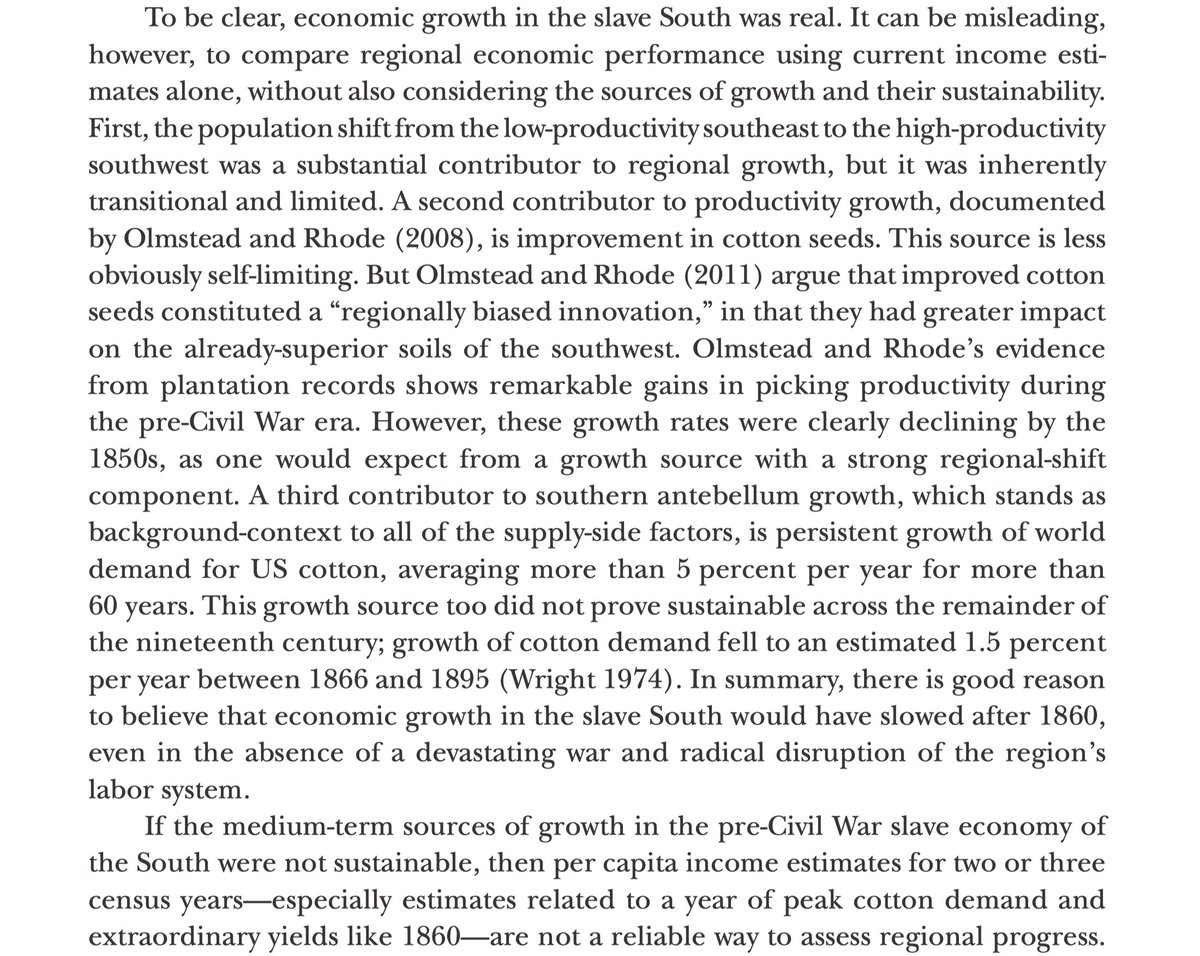
Wright argues, however, that Easterlin’s numbers can’t be trusted because 1860 was a year of unusually large cotton harvests and booming world demand for cotton.
The South’s postbellum decline was then due to stagnant demand for cotton. 4/19
The South’s postbellum decline was then due to stagnant demand for cotton. 4/19
5
Wright has been making this argument for decades and now combines it with Olmstead and Rhode’s work on biological innovation in cotton production to argue that the South’s antebellum growth was unsustainable, which is why it declined after abolition. 5/19
6
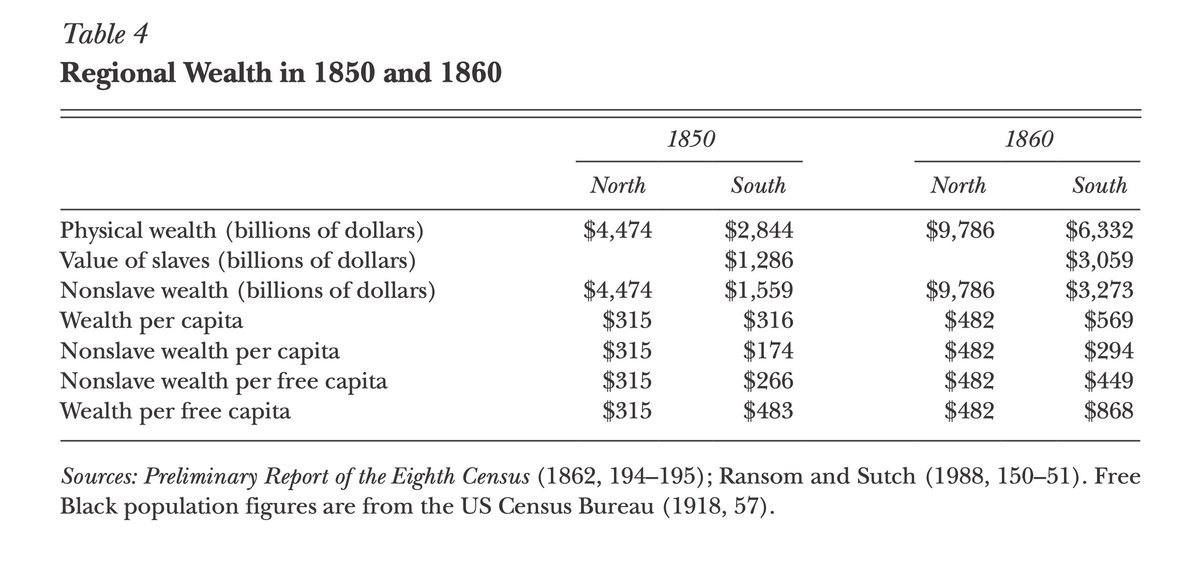
Rather than using Easterlin’s numbers, Wright prefers to look at his own wealth statistics, which he has taken from a preliminary publication of the 1860 census. They show the South being considerably poorer than the North, which he takes as proof of his narrative. 6/19
7
I found, however, that the data used by Wright were only rough estimates of wealth. If he had used the final version of the census, he would have found that the South was much richer than he supposes.
My new GDP estimates show the same. 7/19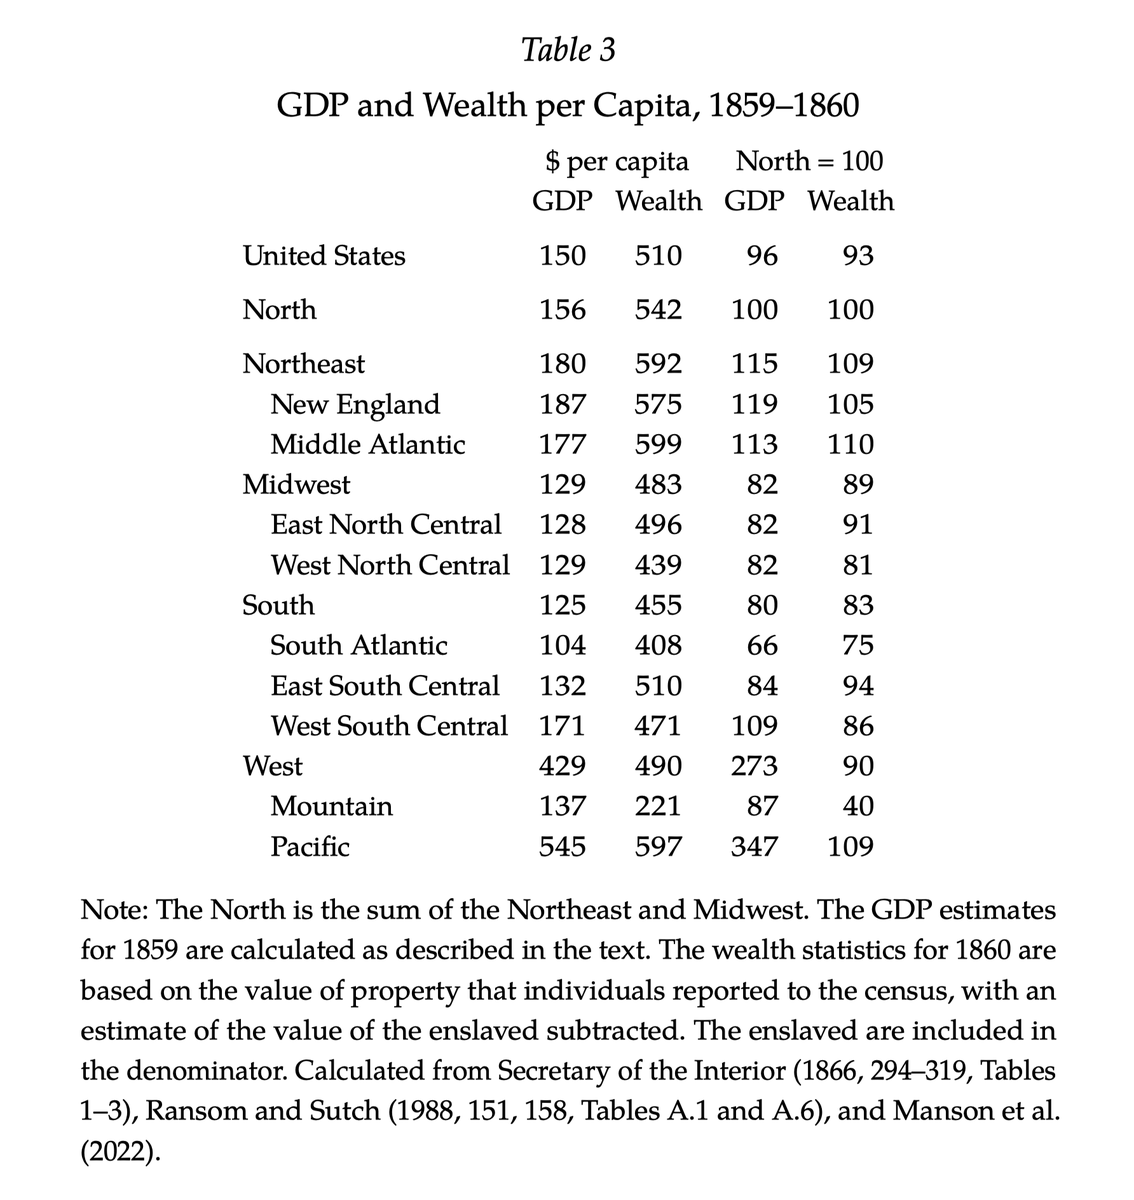
My new GDP estimates show the same. 7/19
8
What Wright takes as proof of his argument is thus just methodological error.
The fixation on cotton is, moreover, wrong. Cotton was just 14% of Southern GDP in 1859. Cotton harvests, demand for cotton, productivity levels in cotton, etc cannot have had such importance. 8/19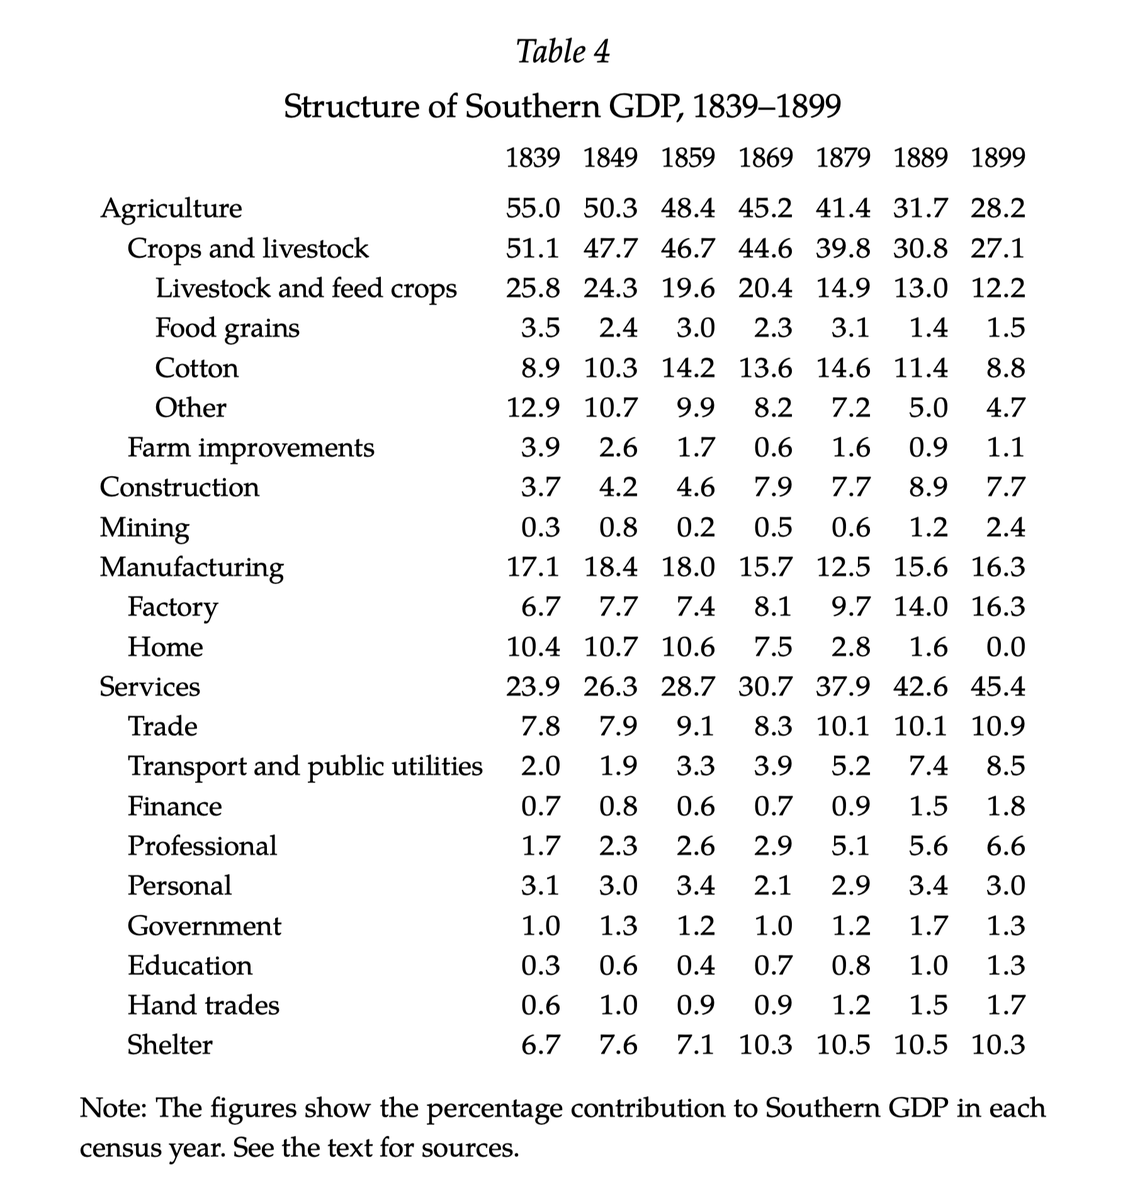
The fixation on cotton is, moreover, wrong. Cotton was just 14% of Southern GDP in 1859. Cotton harvests, demand for cotton, productivity levels in cotton, etc cannot have had such importance. 8/19
9
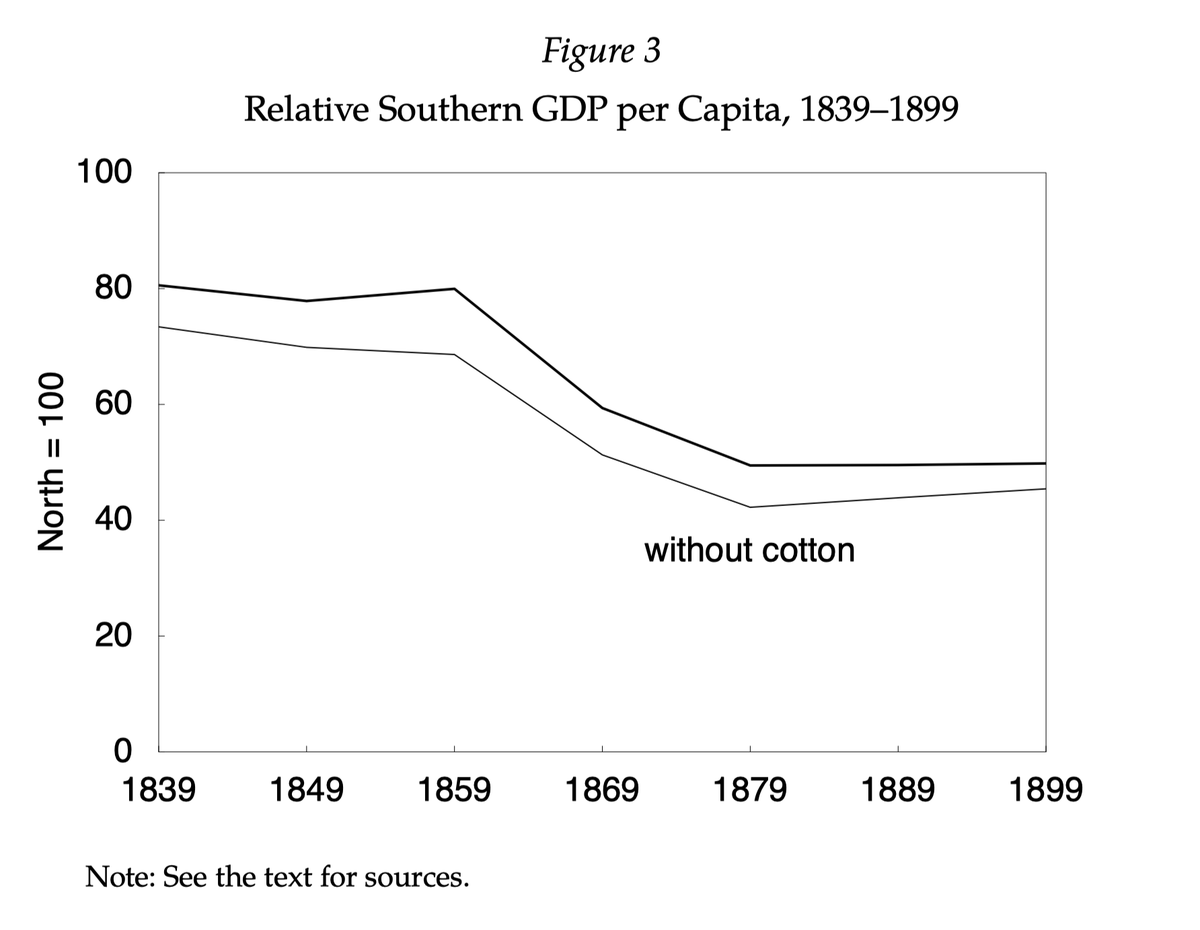
With cotton subtracted from GDP, the South still declines vis-a-vis the North––it makes little difference. In short, Wright’s analysis seems to be based on a misunderstanding of the Southern productive structure. 9/19
10
Rather, it seems likely that the abolition of slavery was the major cause of the South’s relative decline.
If you look at the labor force participation rate, you can see why: black children and women could no longer be forced to work. 10/19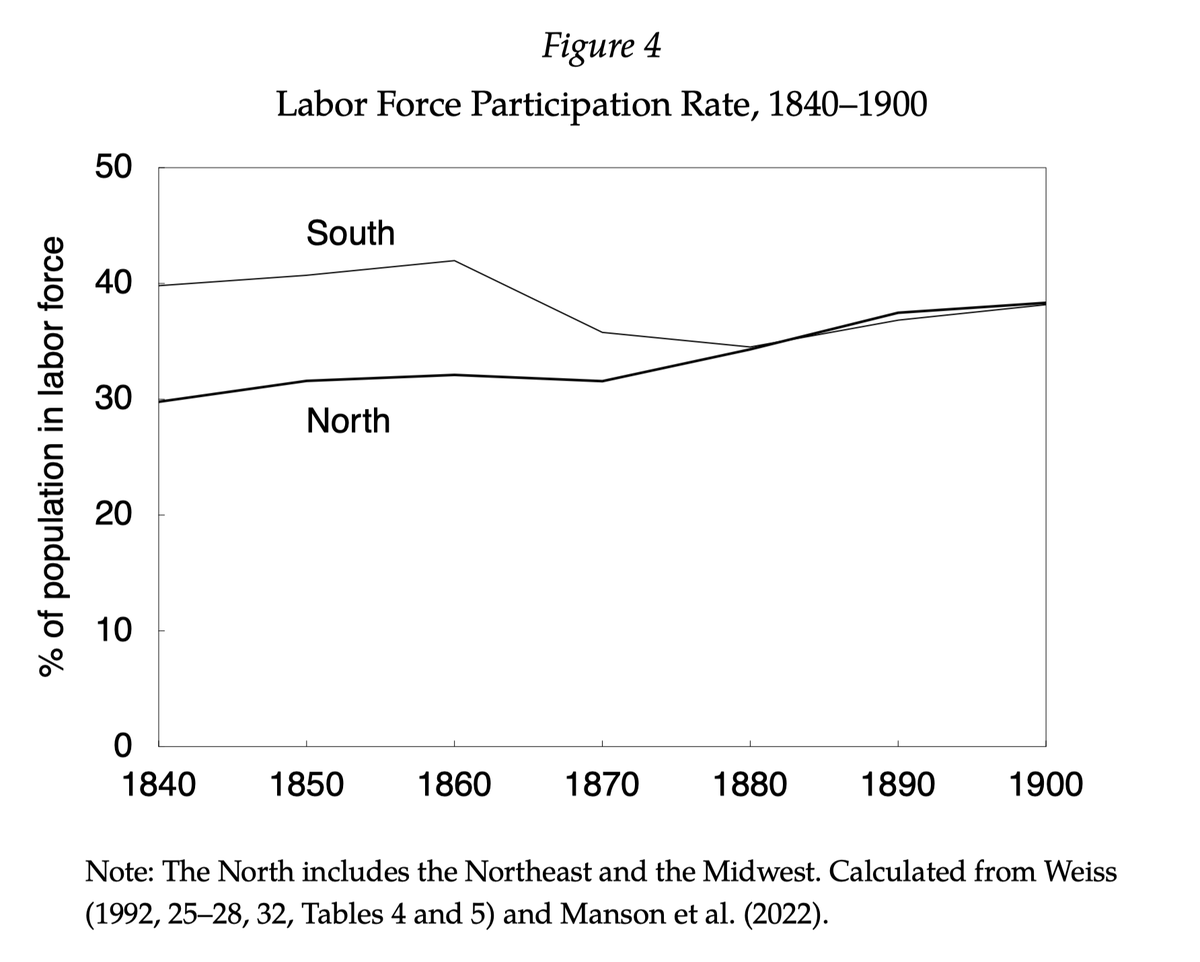
If you look at the labor force participation rate, you can see why: black children and women could no longer be forced to work. 10/19
11
And this was symptomatic of how slavery facilitated the growth of American capitalism: the enslaved could be forced to live and work in places––specifically the Deep South––where free labor would have been too expensive. 11/19
12
My estimates suggest that they were forced to do low-productivity activities, such as growing cotton.
And this is why slavery was inefficient from a microeconomic perspective: its externalities were massive due to a significant misallocation of labor. 12/19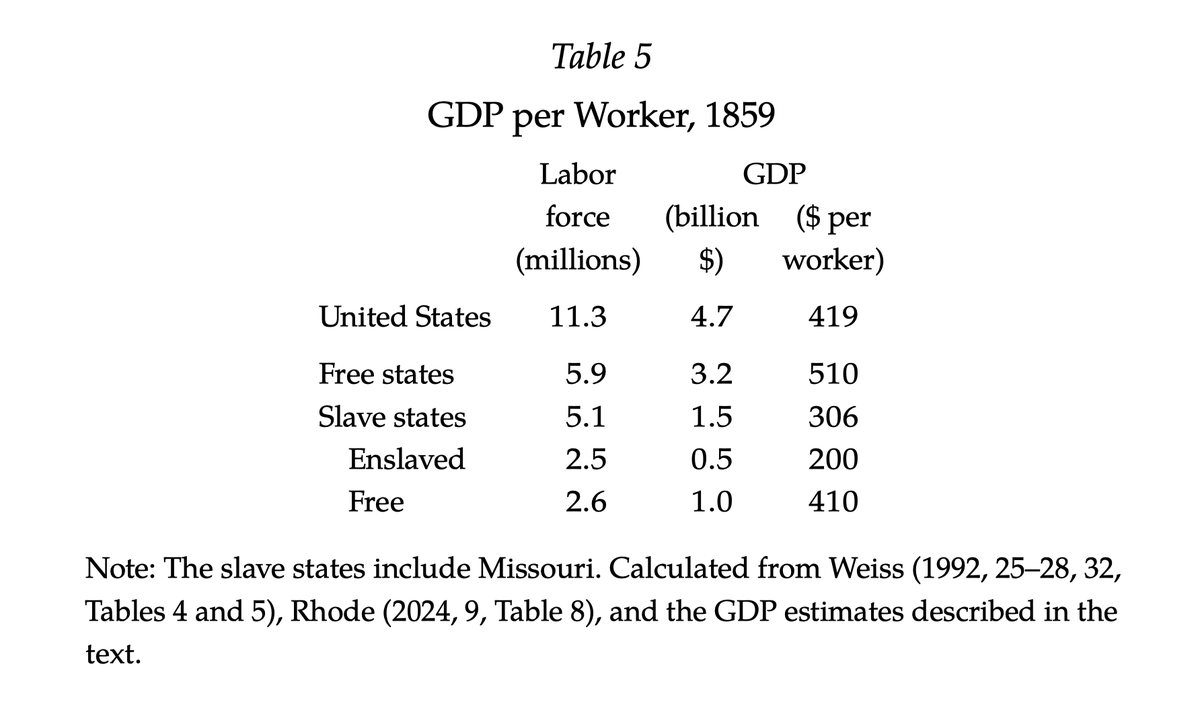
And this is why slavery was inefficient from a microeconomic perspective: its externalities were massive due to a significant misallocation of labor. 12/19
13
Nonetheless, this finding has an important implication: without the enslaved, it would have been far more difficult for Southern cotton to become internationally competitive. They were cheap labor, which meant that they could be employed in growing cotton. 13/19
14
Slavery was necessary for the cotton boom because productivity levels in the Deep South were not high enough to attract free labor.
Any macroeconomic benefits that American capitalism gained from cotton exports were therefore indebted to slavery. 14/19
Any macroeconomic benefits that American capitalism gained from cotton exports were therefore indebted to slavery. 14/19
15
In making this argument, I am turning much of the received wisdom on its head––as such, there will be (and already has been) much resistance from American economic historians.
This paper is, however, only a starting point. 15/19
This paper is, however, only a starting point. 15/19
16
The next one, for example, will be called “Cotton after Slavery in the Postbellum South” and will explain why the United States was able to continue producing cotton after abolition (short answer: there was a large, repressed black population in the South). 16/19
17
There’s also a lot of technical detail in this paper about the construction of the database, which you can find here: raw.githubusercontent.com/joefrancis505/…
And the paper itself is here: raw.githubusercontent.com/joefrancis505/… 17/19
And the paper itself is here: raw.githubusercontent.com/joefrancis505/… 17/19
18
Currently, the database is put together in the linked ODS workbook, but for Version 2, I want to try recreating it in an R script, which should be more transparent and less prone to error, of which there are likely to be some. 18/19
19
By making all the raw data and calculations available in this way, the goal is to make it easier to find those errors and improve on the numbers.
They should be useful for students of American economic history, whether they are looking at slavery or other topics. 19/19
They should be useful for students of American economic history, whether they are looking at slavery or other topics. 19/19
20
@JulianTrev78186 amazon.com/At-Freedoms-Ed…
