You have probably seen the famous bell curve hundreds of times...

Tivadar Danka@TivadarDanka
9 views
Feb 12, 2025
~4 min read
Advertisement
1
You have probably seen the famous bell curve hundreds of times before.
It is often referred to as some sort of “probability”. Contary to popular belief, this is NOT a probability, but a probability density.
What are densities and why do we need them?
It is often referred to as some sort of “probability”. Contary to popular belief, this is NOT a probability, but a probability density.
What are densities and why do we need them?
2
First, let's talk about probability.
The gist is, probability is a function P(A) that takes an event (that is, a set), and returns a real number between 0 and 1.
The event is a subset of the so-called sample space, a set often denoted with the capital Greek omega (Ω).
The gist is, probability is a function P(A) that takes an event (that is, a set), and returns a real number between 0 and 1.
The event is a subset of the so-called sample space, a set often denoted with the capital Greek omega (Ω).
3
Every probability measure must satisfy three conditions: nonnegativity, additivity, and the probability of the entire sample space must be 1.
These are called the Kolmogorov axioms of probability, named after Andrey Kolmogorov, who first formalized them.
These are called the Kolmogorov axioms of probability, named after Andrey Kolmogorov, who first formalized them.
4
Directly working with probability is hard. Most often, we interact with probabilities and events through random variables.
5
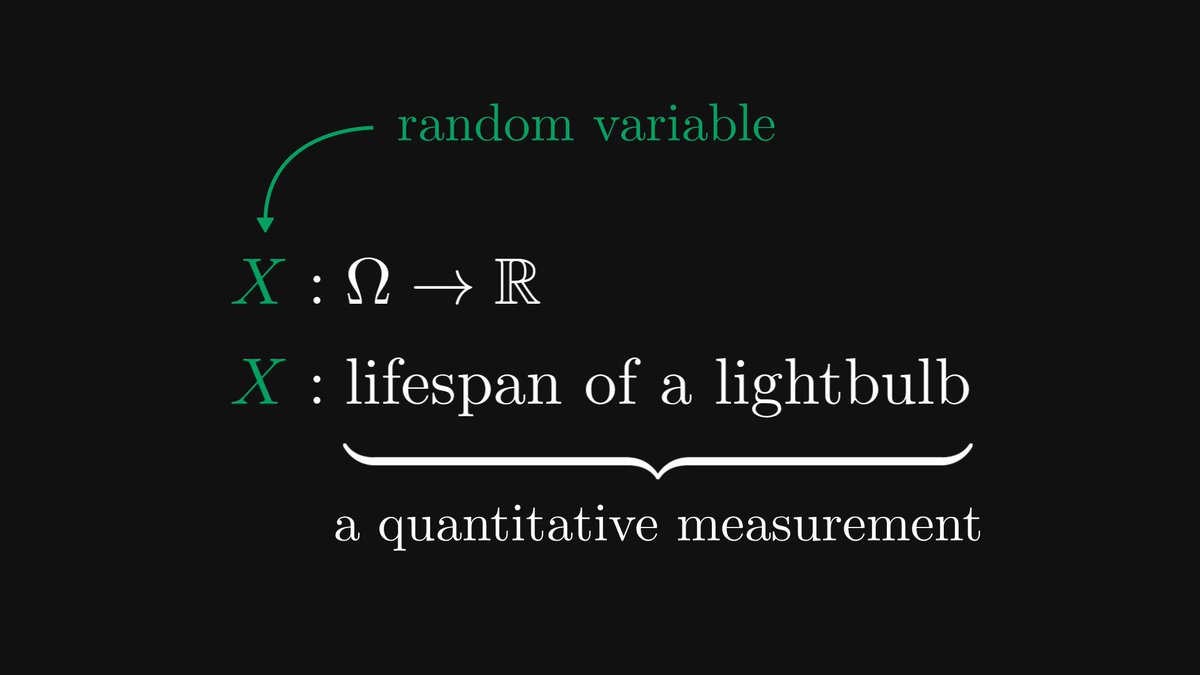
Mathematically, a random variable is a function that maps the sample space Ω to the set of real numbers.
If you are having trouble imagining this, here is an illustration for you.
If you are having trouble imagining this, here is an illustration for you.
6
There is a serious issue with this definition: sample spaces and random variables are way too abstract to be directly used in practice.
For instance, “lifespan of the lightbulb“ is not an exact mathematical formula, and thus, we can’t perform a quantitative analysis with it.
For instance, “lifespan of the lightbulb“ is not an exact mathematical formula, and thus, we can’t perform a quantitative analysis with it.
7
Most often, we are interested in questions like the probability of X falling into a given range, say, my lightbulb will live less than a year.
As it turns out, these are all we need to study a random variable.
To be precise, we are looking at the so-called level sets.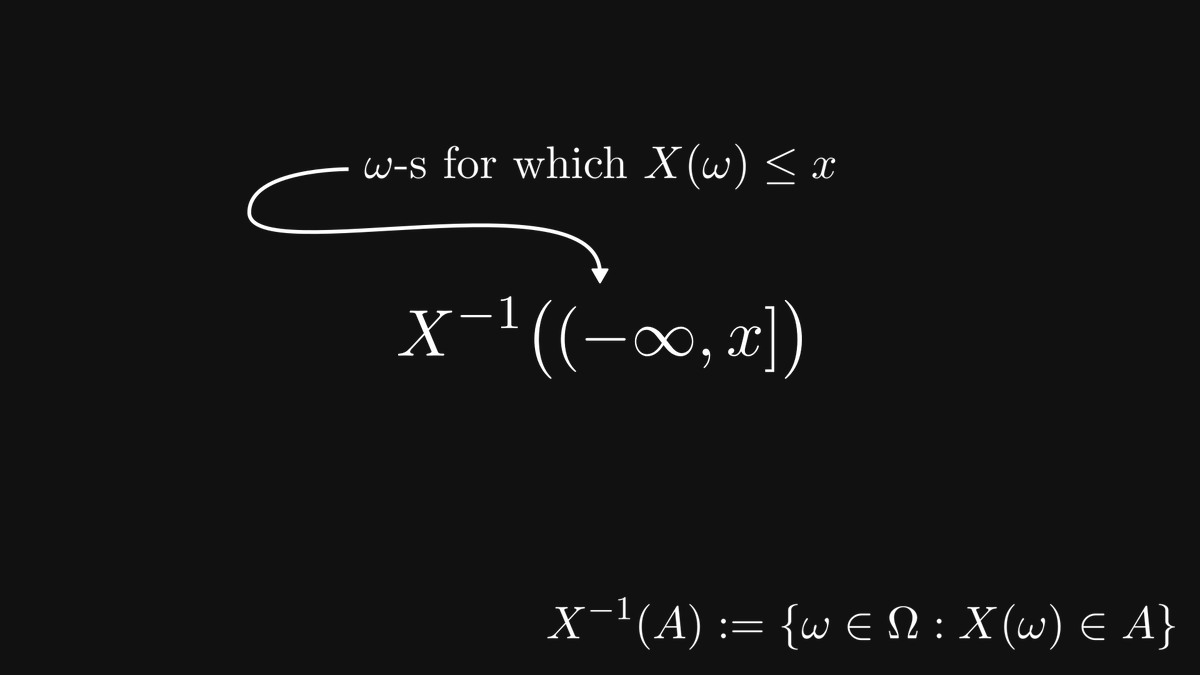
As it turns out, these are all we need to study a random variable.
To be precise, we are looking at the so-called level sets.
8
I know, this is hard to even look at, let alone understand. So, here is a visualization for you.

9
The probabilities of the level sets encode all relevant information about the random variable. If we view x as a variable, these quantities can be used to define a real function.
This function is called the cumulative distribution function (or CDF in short).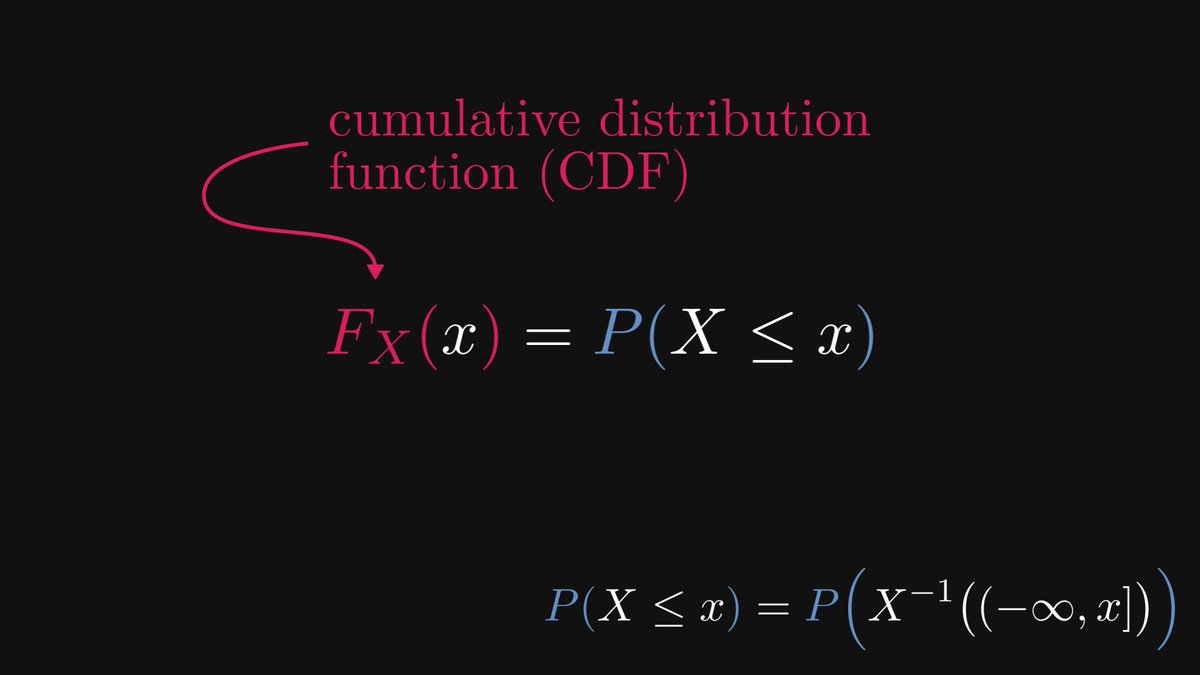
This function is called the cumulative distribution function (or CDF in short).
10
For instance, the lifespan of a lightbulb is said to be exponentially distributed, with the following CDF.
(The λ is a parameter of the distribution.)
(The λ is a parameter of the distribution.)
11
Now, what is the probability that the lightbulb goes out exactly after x seconds? In other words, we are looking for the quantity P(X = x).
A brief calculation shows that it is actually zero, which is quite surprising.
A brief calculation shows that it is actually zero, which is quite surprising.
12
In other words, the probability of each outcome is zero. Yet, the exponentially distributed X is far from that boring.
Isn’t it strange?
There is an explanation. We can express the probability of X falling into the segment (a, b] with the increments of the CDF.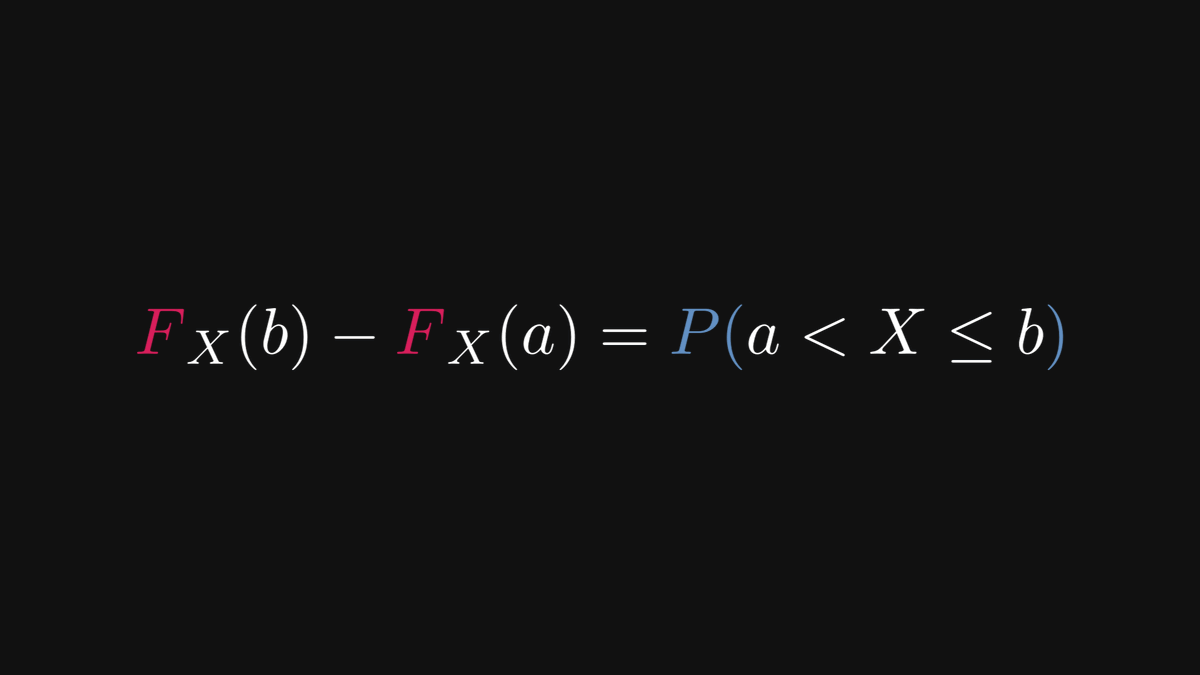
Isn’t it strange?
There is an explanation. We can express the probability of X falling into the segment (a, b] with the increments of the CDF.
13
Increments of the CDF on the left, the probability of X falling into the segment (a, b] on the right.
Does this look familiar?
Does this look familiar?
14
Upon closer inspection, this formula shows a close resemblance with the fundamental theorem of calculus.
Increments of the function F on the left, integral of its derivative on the right.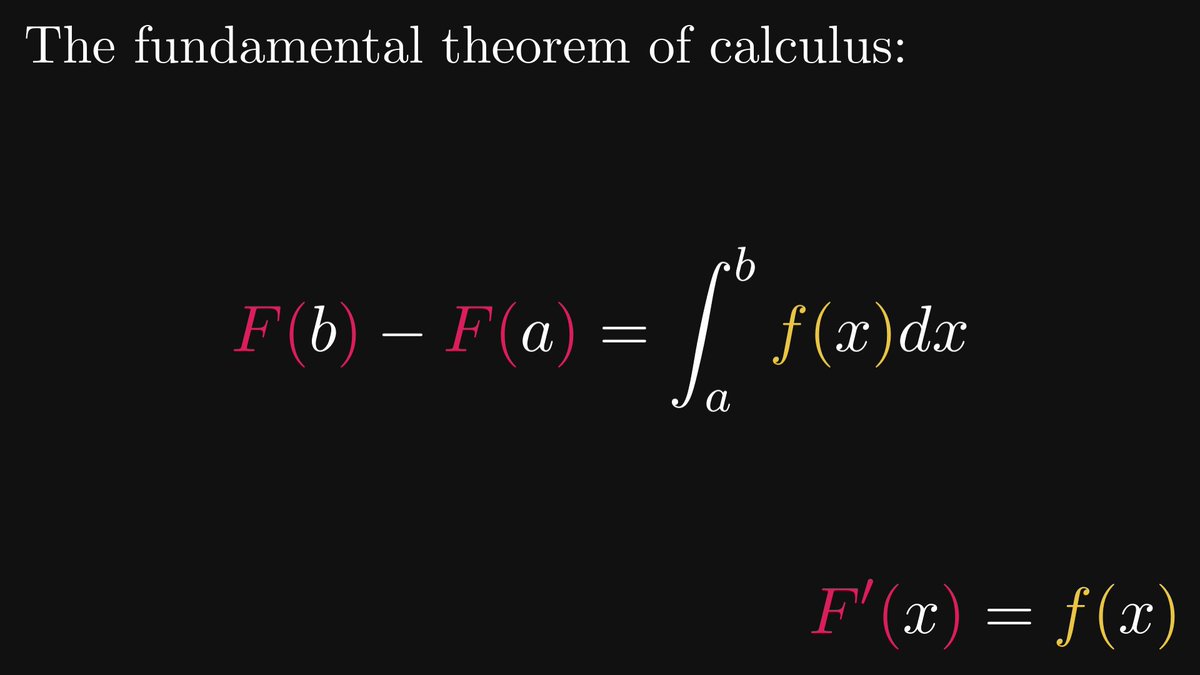
Increments of the function F on the left, integral of its derivative on the right.
15
Applying this to the CDF, we get the probability density function.
The precise definition goes like this. If there exists a function such that its integral over [a, b] equals the increment of the cumulative distribution function there, then it is called a density function of X.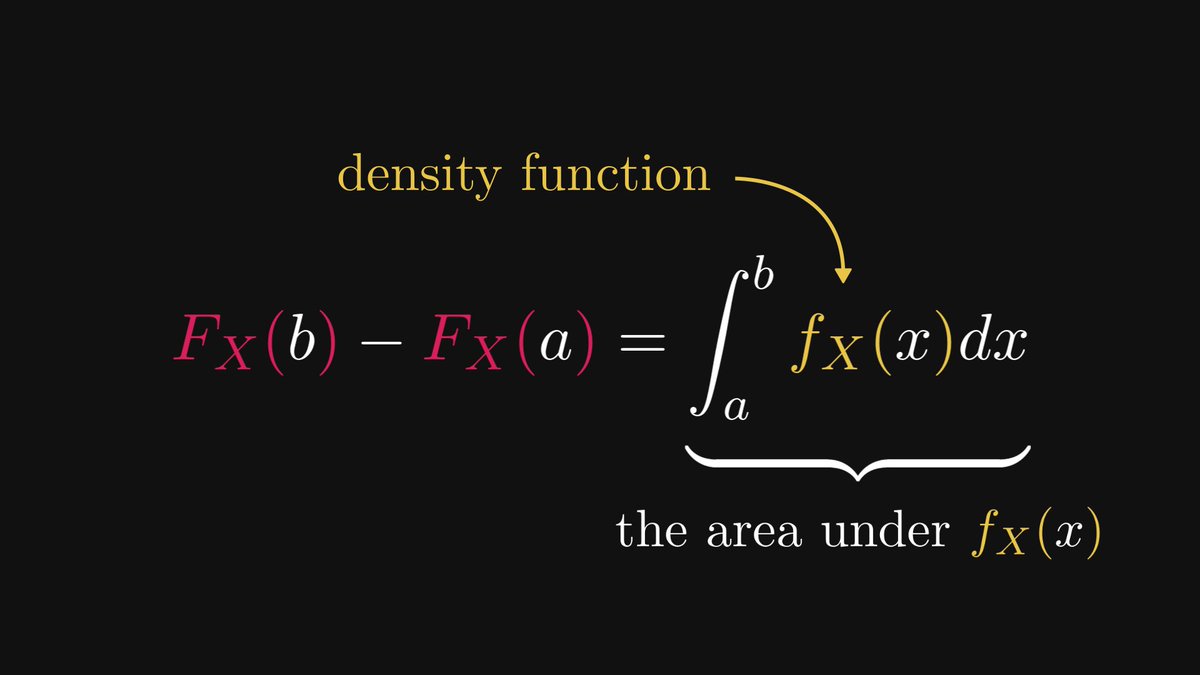
The precise definition goes like this. If there exists a function such that its integral over [a, b] equals the increment of the cumulative distribution function there, then it is called a density function of X.
16
If the CDF is differentiable, its derivative is a density function.

17
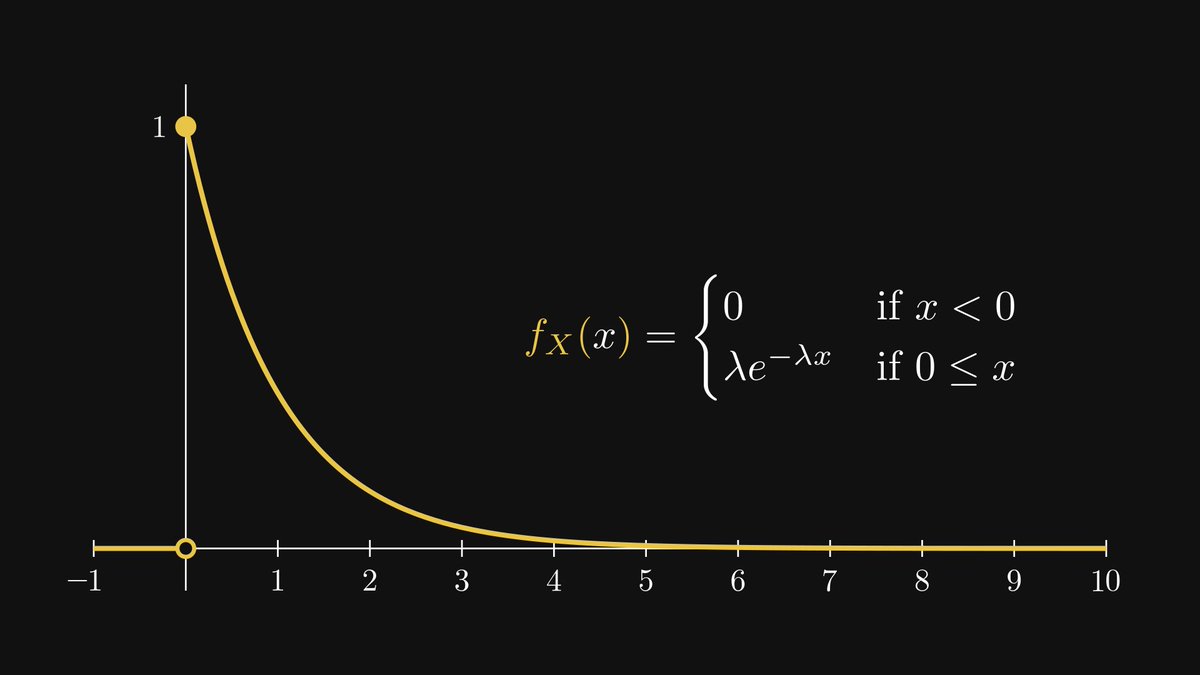
To see some examples, here is the density function of our recurring example, the exponential distribution.
18
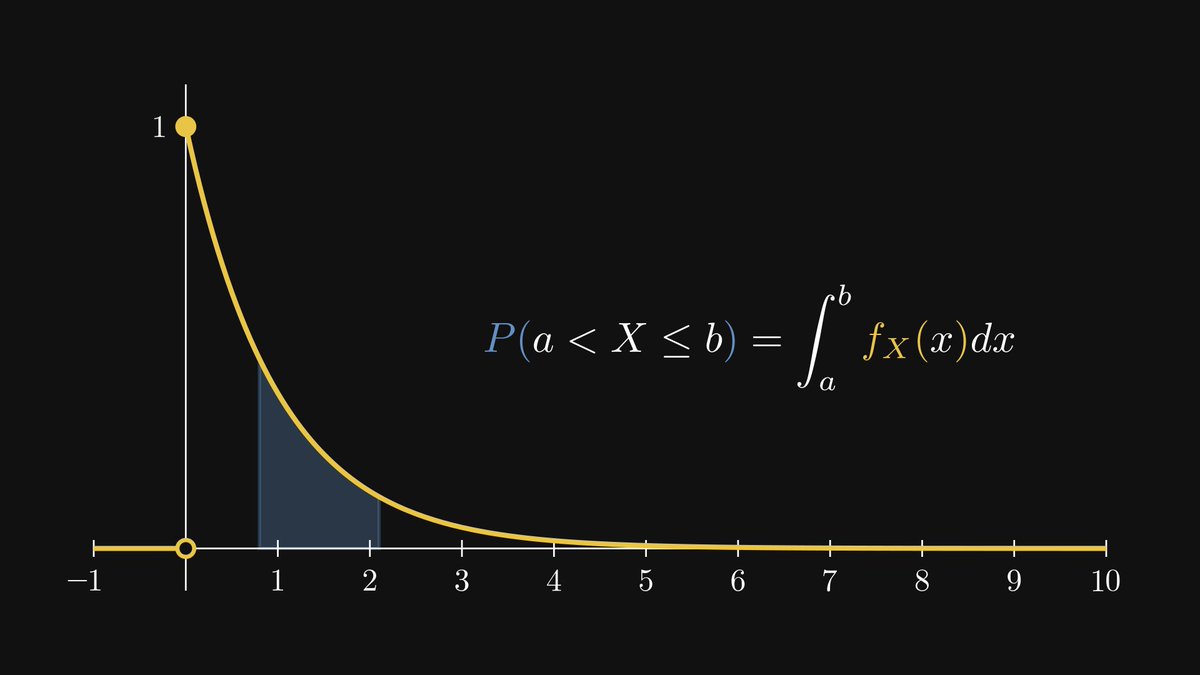
As the value of the integral corresponds to the area under the curve, this gives a new interpretation of the probabilities.
19
Now, back to our starting point: the bell curve.
This is known as the density of the standard normal (or Gaussian) distribution.
This is known as the density of the standard normal (or Gaussian) distribution.
20
Its density is concentrated around zero, and it vanishes as we move farther from it.
One thing is for sure: it is definitely not a probability. It is the CDF's rate of change.
One thing is for sure: it is definitely not a probability. It is the CDF's rate of change.
21
This thread is a condensed version of my latest post, available on Substack.
If you are interested in the (much) more detailed explanations, check it out!
thepalindrome.substack.com/p/probabilitie…
If you are interested in the (much) more detailed explanations, check it out!
thepalindrome.substack.com/p/probabilitie…
22
If you have enjoyed this thread, follow me, and subscribe to my newsletter!
Mathematics is fantastic, and I regularly post deep-dive explanations about seemingly complex concepts from mathematics and machine learning.
thepalindrome.substack.com
Mathematics is fantastic, and I regularly post deep-dive explanations about seemingly complex concepts from mathematics and machine learning.
thepalindrome.substack.com