🧵on the AI audit of Saez and Zucman and by implication Piketty (or...

Phil Magness@PhilWMagness
13 views
Oct 29, 2026
~10 min read
Advertisement
1
🧵on the AI audit of Saez and Zucman and by implication Piketty (or PSZ together):
Since some are objecting to what the computer found, here's a list of biases in this trio's work that were found by humans over the last decade.
Since some are objecting to what the computer found, here's a list of biases in this trio's work that were found by humans over the last decade.
2
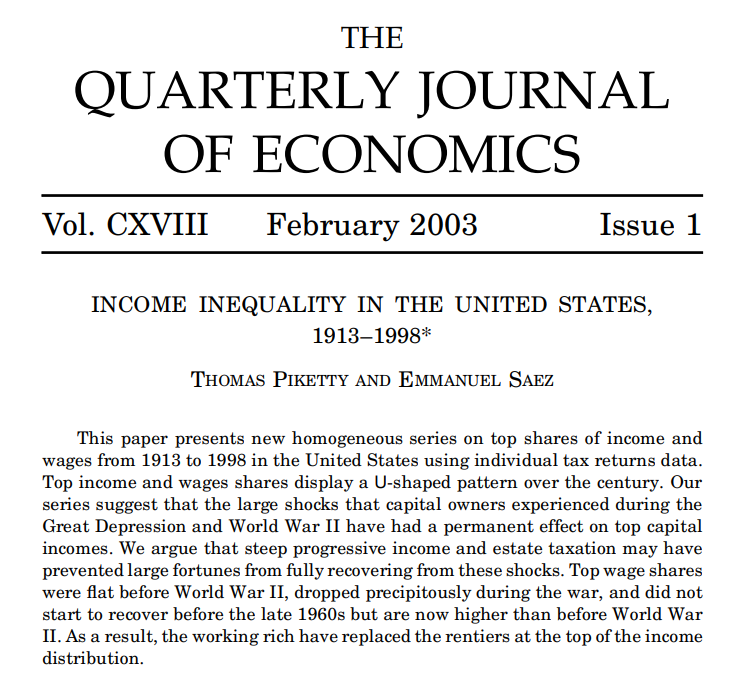
We'll start with Piketty-Saez 2003, the famous income concentration paper that put them on the map and started it all.
3
PS 2003 is famous because of this chart, the U-Curve of inequality that shows high income concentration in the early 20th century, a leveling around WW2, and a rebound after 1980, which Piketty and Saez attribute to tax cuts.
There are substantial problems with their numbers.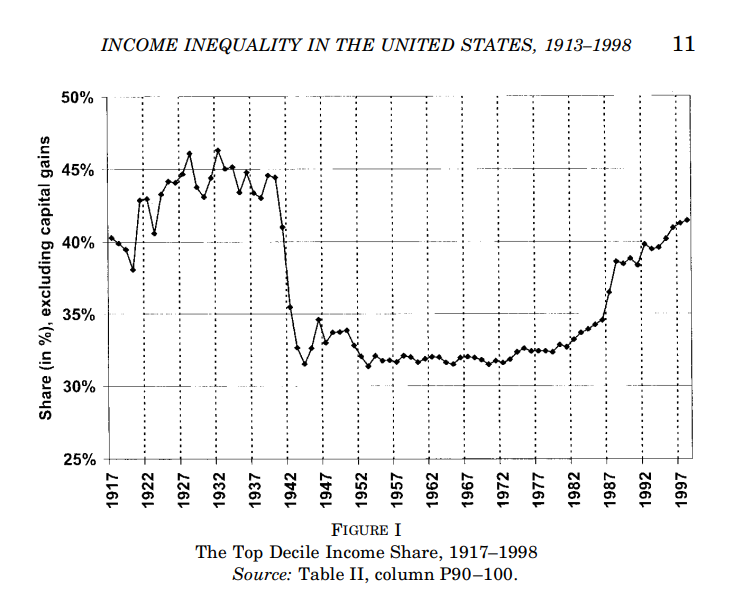
There are substantial problems with their numbers.
4
In 2022, @VincentGeloso, myself, and 2 coauthors who are not on X published a study in EJ that replicated and corrected the first half of PS 2003 data (1917-1960). We found it was riddled with errors - a few big, many small, but all in the same direction. academic.oup.com/ej/article-abs…
5
The first issue concerned how they handled tax deductions prior to 1943 when the IRS standardized its accounting around the Adjusted Gross Income concept. To harmonize with post-1943 data you need to tabulate equivalent deductions that are part of AGI and adjust the reported "Net Income" figure used before 1943 to include them.
Piketty and Saez did not do that though. Instead, they just applied a set of fixed and guesstimated multipliers that scaled up based on your income level, i.e. the more you made, the higher your assumed deductions (the first chart below). Yet we know this is wrong by comparing 1943 and 1944 before and after the switch (chart 2 below). Deduction patterns are more gradual by income group, with a noticeable dip from the right then spike in middle-to-upper incomes.
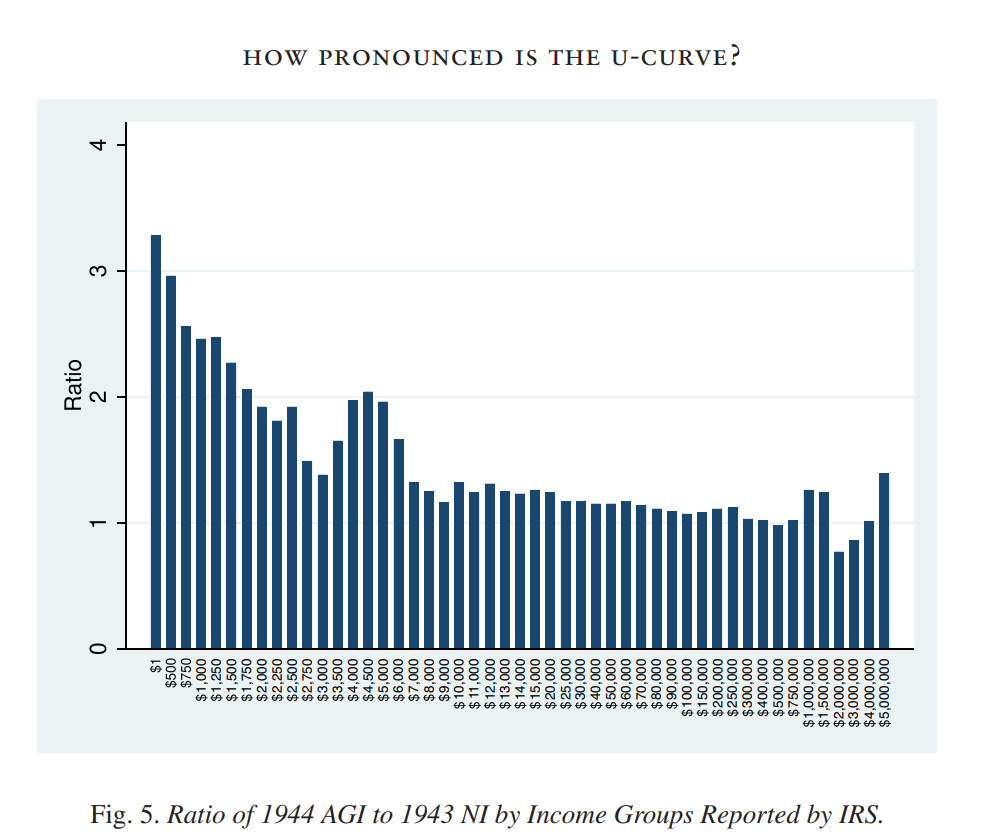
Piketty and Saez did not do that though. Instead, they just applied a set of fixed and guesstimated multipliers that scaled up based on your income level, i.e. the more you made, the higher your assumed deductions (the first chart below). Yet we know this is wrong by comparing 1943 and 1944 before and after the switch (chart 2 below). Deduction patterns are more gradual by income group, with a noticeable dip from the right then spike in middle-to-upper incomes.
6
PS 2003's fixed multiplier is a classic example of where a data assumption by them resulted in a substantial and fairly uniform increase in inequality in the affected years. It was also overlaid with another error.
Due to differences in the tax eligibility threshold for married vs. single filers prior to 1940, PS 2003 has to simultaneously estimate a "missing filer" adjustment that estimates unreported income as a result of the differing thresholds.
The problem though: PS picked the wrong year to estimate their ratios for the adjustment. They used 1942 - a wartime year with substantial disruptions to the US labor force, and particularly young single males - to estimate pre-war patterns. And to compound that, they misread the underlying IRS sample used to estimate it. As we document:
7
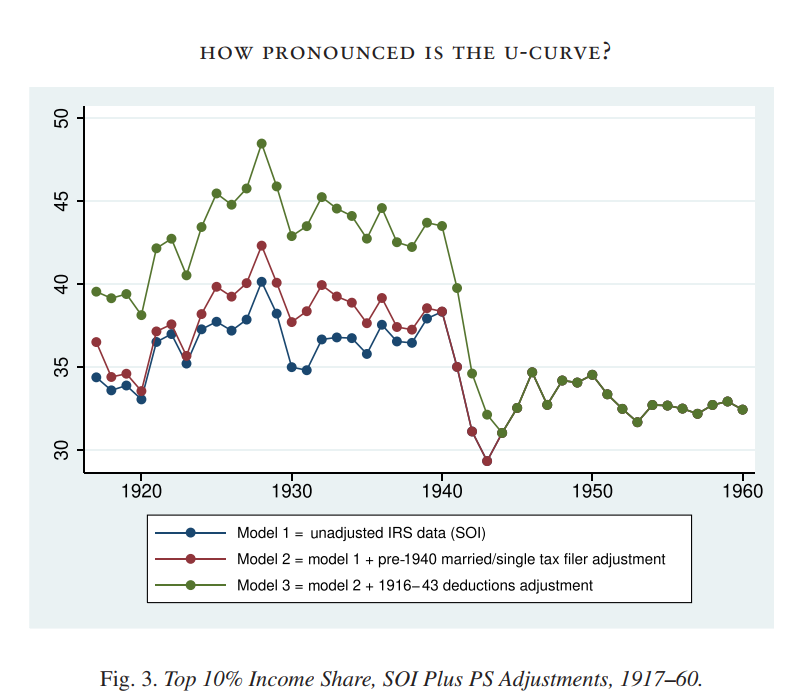
So what was the cumulative effect of PS's decisions in these two adjustments? Both raised their measurements of inequality in the affected years, and pretty uniformly at that. The green line = the cumulative effects vs. unadjusted figures (blue).
8
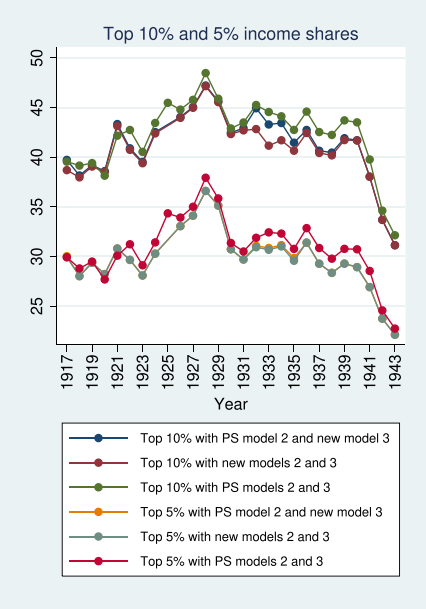
My coauthors and I corrected all this, as well as a bunch of smaller issues in PS 2003 ranging from typos to accidentally omitting income data from a special new 1040 form introduced in some years and reported separately by the IRS. The cumulative effect of our corrections lowered inequality in all affected years, and changed the patterns in subtle but important ways:
9
But that's not all. PS 2003 contains dozens of other errors, big and small. One pretty comical example:
Alaska and Hawaii did not become states until 1959. PS did not properly account for this, and as a result they had a mismatch between their numerator data (which included the territories) and their denominator and their tax unit calculations (which did not in several affected years)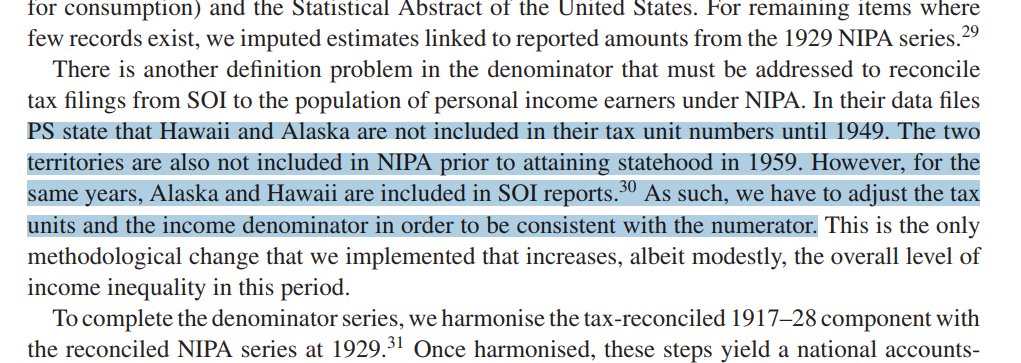
Alaska and Hawaii did not become states until 1959. PS did not properly account for this, and as a result they had a mismatch between their numerator data (which included the territories) and their denominator and their tax unit calculations (which did not in several affected years)
10
In another case, PS did not realize that state and local public employees enjoyed generous exemptions from federal income tax liability before 1939, and were accordingly missing from their data. We adjusted for that and added them back in.

11
There was also a more severe error in Piketty and Saez's denominator: there's a severe discontinuity in the calculation methods they chose to estimate total income earnings before and after 1943, and again after 1947. And the assumptions they make around each have tons of problems. Take one basic error for example:
To bridge 1943 with 1947 they had to do a back of the envelope imputation. Except the ratio they claimed they used in the paper was different from the ratios found in their spreadsheets. And this mattered, because the spreadsheet ratios made the bridge smoother than the ones stated in the paper, which in turn obscured a deeper problem with the denominator discontinuities.
To bridge 1943 with 1947 they had to do a back of the envelope imputation. Except the ratio they claimed they used in the paper was different from the ratios found in their spreadsheets. And this mattered, because the spreadsheet ratios made the bridge smoother than the ones stated in the paper, which in turn obscured a deeper problem with the denominator discontinuities.
12
Turning to the denominator itself, Piketty-Saez 2003 applied two distinct approaches (pre-1943 and post-1947) that were both based on sloppy assumptions, and both augmented inequality in the years that fit their political story. The details are complex and we cover them in the paper, but the gist is this:
Their pre-1943 denominator is estimated from national accounts using an incorrect fixed adjustment. In most years that denominator is too small, which = higher inequality. The post-1947 denominator switches to a different method based on estimating non-filers and adding them to tax data, but it too is inaccurate in a different way that manifests in the comparatively stable mid-century trough.
Their pre-1943 denominator is estimated from national accounts using an incorrect fixed adjustment. In most years that denominator is too small, which = higher inequality. The post-1947 denominator switches to a different method based on estimating non-filers and adding them to tax data, but it too is inaccurate in a different way that manifests in the comparatively stable mid-century trough.
13
We corrected their denominators using a single consistent approach, calculated directly from US national accounts data. The results (combined with the numerator corrections above): Piketty-Saez overstate inequality in almost every single affected year, but at different levels.

14
The changes are already pretty substantial. Here's a table that explains the cumulative effects of the major corrections:

15
And then we compiled all the corrections together and extended them to 1960. They result? A new top income concentration series that is (a) substantially lower than PS and (b) shows a very different pattern of the early 20th century leveling effects.

16
That's just one paper from the Piketty-Saez (and later Zucman) canon, and it shows a pattern that is common to all of their collective works:
They make dozens of small (and a few larger) data assumptions that affect the directions and levels of their "raw" input data. And all of these assumptions (some discretionary, some outright sloppy errors) go in the same direction: exaggerating measured inequality in the years their political story claims that inequality was a problem.
They make dozens of small (and a few larger) data assumptions that affect the directions and levels of their "raw" input data. And all of these assumptions (some discretionary, some outright sloppy errors) go in the same direction: exaggerating measured inequality in the years their political story claims that inequality was a problem.
17
But let's turn to their other works. In 2015 @BobMurphyEcon and I did a deep dive into Piketty's famous book Capital in the Twenty First Century.
What did we find? More of the same types of biases. Lot's more.
journal.apee.org/Private.Enterp…
What did we find? More of the same types of biases. Lot's more.
journal.apee.org/Private.Enterp…
18
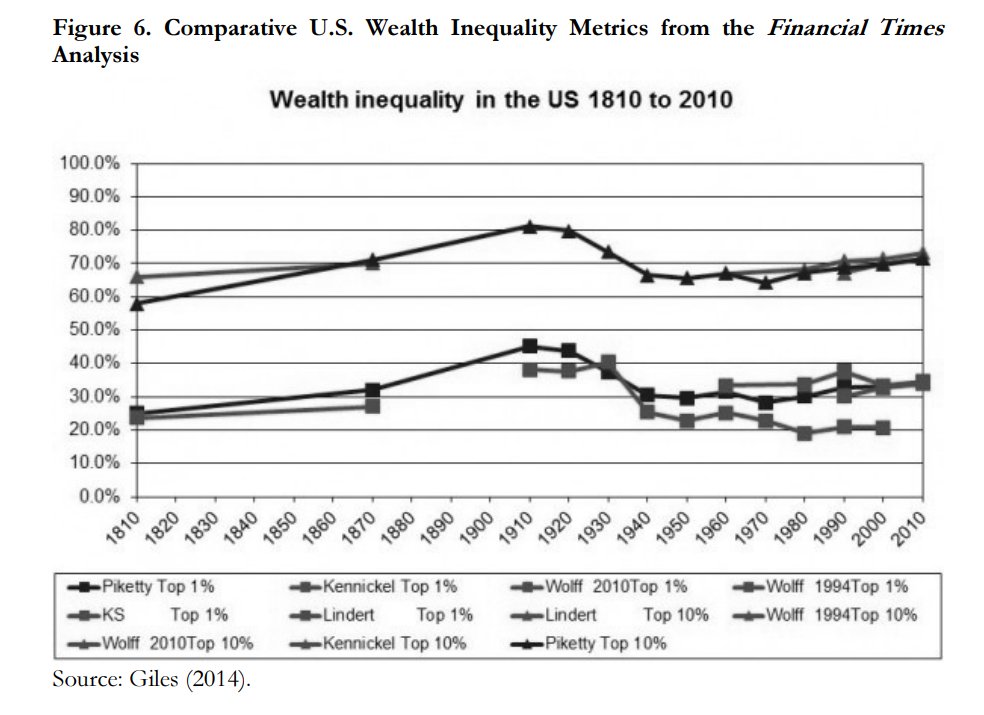
One of the issues concerned how Piketty measured wealth inequality in the US. We reconstructed his sources and found they were a hodgepodge of cherrypicked numbers from different papers that all used dramatically different estimation techniques. We called the result the Frankenstein Chart, because it seemed to select the respective decade's estimates based on whether or not that paper aligned with Piketty's story of rising wealth inequality since the 1970s.

19
Yet when you compared all those estimates to Piketty, the raw data - especially for the top 10% - diverged from the story that Piketty was trying to tell.
20
There was another problem in Piketty's book. He showed an estimate of the worldwide capital-to-income ratio, which purported to demonstrate his famous r > g formula and showed a leveling followed by a worldwide rebound.

21
But that curve also had a problem. Its mid-century trough was an artificial construct of sloppy and just plain bad data decisions.
You see, Piketty did not have accurate private capital stock data for most of the world in this period. So what did he do? He just guesstimated with nice round numbers.
And the guesstimates all conveniently reinforced the existence of a mid-century trough and late 20th century rebound in the capital stock, or what his theory expected to find.
22
It gets worse though. Piketty's guesstimates are not even plausible in some years. A telling example: how he treated the Soviet Union and other communist bloc countries.
There's no good data on the capital stock for most of these countries under communism. So instead Piketty just accepted the Marxist line that private ownership had been abolished, therefore under communism the capital stock just magically leveled out to meet income.
Piketty's worldwide "trough" was in fact the result of hard-baked estimates for the communist countries that dragged it down in those same years, and that all rebounded after 1989-91.
23
Again, this is just a small sample of dozens of similar errors and suspect claims that Murphy and I documented in Piketty's book. We weren't alone though.
24
Here's another paper from 2017 by the late Richard Sutch, one of the most distinguished economic historians of the last half-century. Sutch also attempted to replicate Piketty's wealth concentration stats for the US. They were riddled with errors and bias
cambridge.org/core/journals/…
cambridge.org/core/journals/…
25
Here's a 2019 paper where I replicated Piketty's wealth U-curve for the United Kingdom to see if the same problems played out in other countries. Turns out they did, and once again Piketty made a ton of biased discretionary calls that biased his post-1980 rebound well above both the replication of his described techniques and above the raw source data.
onlinelibrary.wiley.com/doi/full/10.11…

onlinelibrary.wiley.com/doi/full/10.11…
26
We haven't even gotten to Zucman yet, but suffice to say there are problems with his work as well. I discuss them at length in this 2025 article.
independent.org/wp-content/upl…
independent.org/wp-content/upl…
27
One of the big ones? In 2019 I caught Zucman altering his previously-published stats from a 2018 Quarterly Journal of Economics article where he estimated the average total tax rates paid by the top 0.001%
The 2018 article showed that this rate declined between the 1960s and today, but only slightly - which ran counter to Zucman's causal story that 1980s era tax cuts had caused an inequality crisis of top income concentrations spiraling out of control.
So what did Zucman do? He dramatically altered the way he estimated top 0.001% tax rates, and released it to the New York Times and Washington Post as a headline-grabbing claim.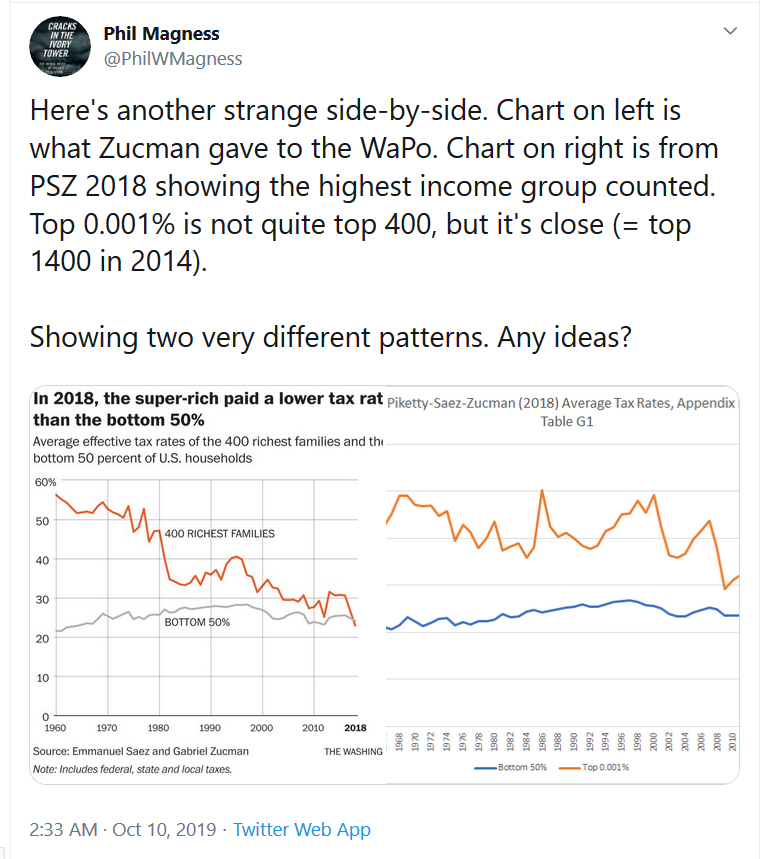
The 2018 article showed that this rate declined between the 1960s and today, but only slightly - which ran counter to Zucman's causal story that 1980s era tax cuts had caused an inequality crisis of top income concentrations spiraling out of control.
So what did Zucman do? He dramatically altered the way he estimated top 0.001% tax rates, and released it to the New York Times and Washington Post as a headline-grabbing claim.
28
Except Zucman's old and new numbers did not align, and he did not have any explanation for why.
A deeper dive revealed the two major distortions. First, Zucman had switched to an extremely heterodox assumption about how corporate tax incidence is incurred and shifted it onto shareholders in contravention of the mainstream literature. Doing so distorted the average tax rate paid by the ultra-rich by hard-baking changes in US corporate tax rates into their stock portfolios.
That creates an illusion where their tax rate was much higher in the 1960s and has dropped to much lower today.
29
Second, Zucman made another strange assumption with how he calculated the tax rate of the bottom 50%. He removed anti-poverty tax credits like the Earned Income Tax Credit (EITC) and Child Tax Credit from his calculation of the estimated rates, even though both are part of the tax code and are reported by the IRS as part of their rate calculations.
Zucman reclassified them as "transfers" and removed their offsetting credits. The result? The bottom quintile of earners appears to pay an overall average tax rate of about 24% in Zucman's numbers. But in reality when you include the EITC etc., their average tax rate is about half that at 10-15% (mostly depending on the state and local taxes they pay). Zucman just made that disappear.
Zucman reclassified them as "transfers" and removed their offsetting credits. The result? The bottom quintile of earners appears to pay an overall average tax rate of about 24% in Zucman's numbers. But in reality when you include the EITC etc., their average tax rate is about half that at 10-15% (mostly depending on the state and local taxes they pay). Zucman just made that disappear.
30
It wasn't the only thing Zucman disappeared. He also briefly tried to hide his old 2018 dataset by scrubbing it from his website and swapping in the new one...until a few of us caught this and called him out til he restored it.
By chance, I happened to have downloaded the old 2018 files a few weeks before Zucman did this and had a copy to compare it to.

By chance, I happened to have downloaded the old 2018 files a few weeks before Zucman did this and had a copy to compare it to.
31
Zucman responded by blocking me.

32
The original PS 2003 saga also continues with problems in the second half of their chart (1960-present). A few months ago Vincent and I released a replication and update of their full series, which found more denominator problems in the PS original - especially after 1986.
As with their other work, these errors exaggerated inequality levels from the 1980s-present.
As with their other work, these errors exaggerated inequality levels from the 1980s-present.
33
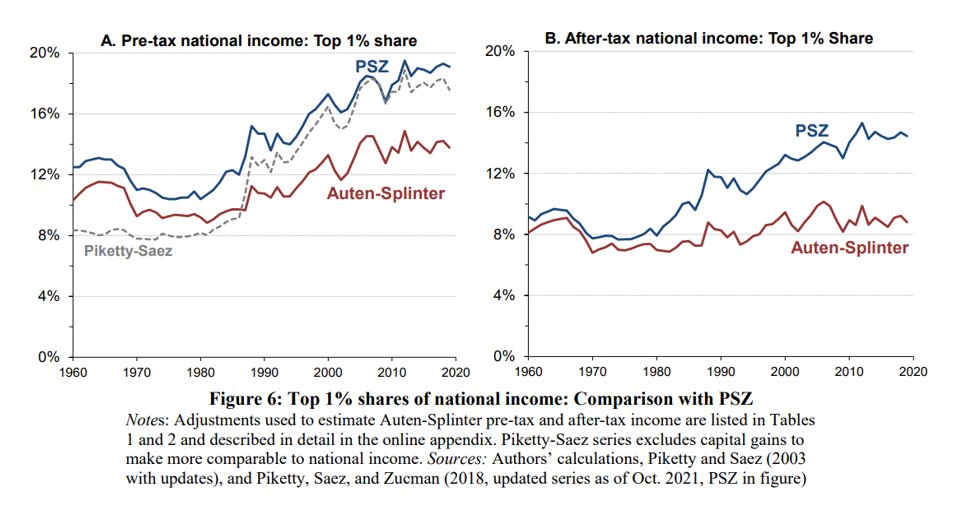
And then there's the whole literature about the national accounts approach to measuring income concentration, involving an ongoing debate between Auten-Splinter and PSZ.
I won't rehash the particulars here, but I will say this: Auten-Splinter are much more even handed than PSZ in how they handle discretionary calls and assumptions about missing or imputed data.
journals.uchicago.edu/doi/10.1086/72…
I won't rehash the particulars here, but I will say this: Auten-Splinter are much more even handed than PSZ in how they handle discretionary calls and assumptions about missing or imputed data.
journals.uchicago.edu/doi/10.1086/72…
34
PSZ, by contrast, almost always choose the path that augments or exaggerates inequality. Here's a comparison showing the effects:
35
cc @ATabarrok @tylercowen
