Jev + graphical models: a paradigm shift?

Could Jev + graphical models fundamentally change how we build systems that reason under uncertainty? Unless you've been off the grid this week, you now know that Jev is @typesafeai’s new model for structured decisions: give it a question and a set of possible outcomes, and it returns probabilities for those outcomes. That ability combined with graphical models (my neck of the woods!) strikes me as potentially revolutionary.

In particular, Jev could provide zero-shot probabilistic factors for any graphical model reasoning engine, including GTSAM! While GTSAM is best known as a continuous optimization library for robotics and computer vision, we also have discrete and hybrid inference built in. It can even solve Sudoku puzzles! Jev gives us a way to supply those factors from knowledge expressed in language.
When I introduce Bayes networks in a class, I usually explain three ways to obtain their conditional probability tables (CPTs): our own judgment, interviews with experts, or estimation from data. Even when the inference machinery is ready, assembling that knowledge can be a substantial undertaking.
With some help from Astra, I ran two experiments using Jev+GTSAM that I think are very cool! And they only cost me a total of 3/100th of a cent! In the first experiment, one Jev request gave me every conditional probability table in an eight-variable network. GTSAM then used those tables to answer new evidence queries. In the second experiment, I used Jev to elucidate the Bayes net topology itself: it proposed relationships from variable descriptions, and came remarkably close to the example I used. Both experiments are zero-shot: they draw on knowledge already available in the model, without expert interviews or a dedicated training dataset.
A quick AI-assisted literature search also turned up quite some prior work on using language models to build probabilistic models. I’ve collected some papers at the end, but should note I have not (yet) read them carefully - and this is not quite my home turf.
Bayesian Networks

Figure 1. A Bayes network and one CPT. The arrows specify the dependencies, while CPTs specify a conditional probability distribution for each parent assignment. A CPT can also be seen as a factor in factor graph, which is how GTSAM treats them. In my first experiment, Jev supplies the probabilities for the classic Asia/Chest Clinic graph.
A Bayesian network represents uncertain quantities through a graph of local dependencies. I’ll use the classic Asia/Chest Clinic network (Lauritzen & Spiegelhalter, 1988), a historical (and deliberately over-simplified) benchmark with eight variables covering travel history, smoking, diseases, and symptoms. Every variable is binary: true or false. An arrow identifies a parent whose value is an input to the child's conditional probability table.
CAVEAT: This particular example is very well known in the literature, is present in many textbooks, including in GTSAM's own example, and presumably also in Jev's training data. So all of the results below are in a sense potentially tainted.
A conditional probability table (CPT) gives a distribution for every assignment of a variable’s parents. For tuberculosis, this graph uses just one parent: whether the patient visited Asia. The table therefore has two rows. With no Asia visit, the Jev table assigns 97% probability to tuberculosis being absent and 3% to it being present. An Asia visit gives 68% and 32%. Each row sums to one.
Multiplying all local CPTs defines a joint distribution over all 256 binary assignments in this example. The sparsity induced by the graph let us specify that distribution with only 18 CPT rows. The dependency structure makes that compact representation possible. Inference in Bayes nets lets us predict symptoms from diseases and update disease probabilities from observed symptoms.
The “Jev” opportunity
Jev’s Choice interface is exactly what we want to query for the outcome probabilities needed in each CPT row: we define the options, and it returns a probability for each. Here those options are false and true, and each question describes one child variable under one parent assignment.

Figure 2. Jev supplies eight CPTs from 18 questions in one API request. Teal shows P(true); the remainder is P(false). Each condition identifies a particular row, and the graph in Figure 1 defines the variable letters.
I used this notebook to demonstrate the idea: each CPT row becomes a language question about a child variable, given a specific parent assignment. For example, the notebook asks whether the patient has tuberculosis under the condition that it is false that the patient recently visited Asia. Shared instructions specify the population and say to treat unspecified facts as unknown. We repeat this for every required parent assignment.
One API request supplied all 18 CPT rows, without example tables or task-specific training data. I just provided the graph and variable descriptions; Jev supplied the numbers. That is zero-shot CPT generation for the entire network.
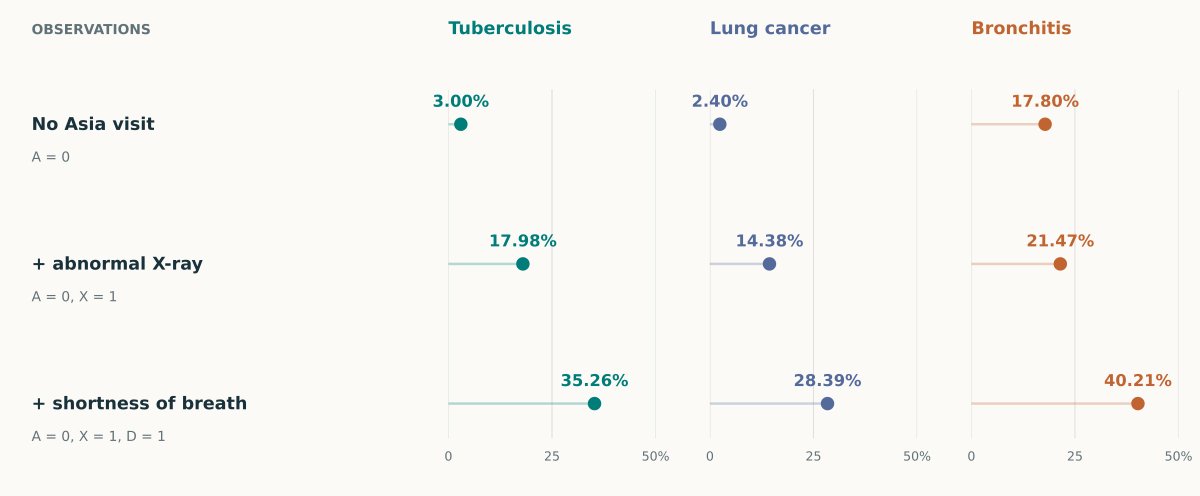
Figure 3. Add no Asia visit, then an abnormal X-ray, then shortness of breath. Each row accumulates the listed observations. The three disease columns share the same 0–50% scale; other variables remain unknown and are summed over.
The graph computes these joint evidence updates from local distributions, without sending the combined questions to Jev. In my case, I used GTSAM with Jev’s tables to compute new posteriors - without any further model calls! The same tables support a whole family of queries.
For example, with Asia held fixed at False, the tuberculosis posterior rises 3.00% → 17.98% → 35.26%, as we add an abnormal X-ray and then shortness of breath. Lung cancer goes from 2.40% → 14.38% → 28.39%, and bronchitis from 17.80% → 21.47% → 40.21%. This is nothing new: inference in Bayes nets is very well established.
What is new (although see related work at end), and a potential paradigm shift, is turning Jev's pretrained knowledge into the explicit, reusable components of a graphical model.
Can Jev give us the Bayes Net itself?
Yes !!! Jev can also propose the graph itself: in a second experiment I supplied only the variable meanings, and asked about all 28 unordered pairs, again in one API request. Each question now offered three possibilities: an edge in either direction, or no direct edge. Hence, the prompt asked Jev to account for relationships mediated by the other variables. I then combined those answers into an acyclic graph, scoring their log probabilities, with a penalty per edge to favor a sparse structure.

Figure 4. The recovered graph contains 11 edges: all eight reference directions and three extras, with no missing or reversed edges. That is 72.7% directed precision and 100% recall. Dashed orange edges mark the additional dependencies.
The figure above shows the result: Compared to the Asia network, Jev wants to add three extra edges, connecting diseases directly to symptoms that the reference graph reaches through “either disease.” They are lung cancer → abnormal X-ray, tuberculosis → abnormal X-ray, and tuberculosis → shortness of breath.
The notebook’s exhaustive graph search has factorial complexity, but machine learning offers a substantial literature on more scalable alternatives. For eight variables, though, checking all 8! = 40,320 orderings is quite doable: it only took 38 ms on my MacBook Air 😃.
Discussion
Graphical models give Jev’s judgments a life beyond the API call.
The sentence above was was AI generated, but I like it! A generated CPT becomes part of an explicit graphical model that can use new evidence, supports new queries, and even the sparse graphical structure can be inferred, at an incredibly low cost. That must mean something !
Next Steps and Quick Lit Search
Try this yourself with the notebook I provided. It should install everything that's needed, and does not need a Jev API key, unless you want to modify the example or re-query Jev.
Careful science still needs to be done. This includes evaluation on unfamiliar networks, probability calibration (which Jev explicitly was trained for), and measuring how modeling errors affect inference. These examples use a familiar benchmark, and I also cheated a bit by selecting a nice edge penalty in the structure recovery example.
The main ideas above -- using language models to supply the structure of probabilistic models, and using them to supply the probabilities themselves -- have already been explored in a number of recent papers. I’m not an expert in this literature, and I found these using a quick AI-assisted literature search. So, don't yell at me for missing your work 😃. Summaries below are entirely AI:
The last paper is interesting, and in a way motivates the others: we should have the language model supply local semantic knowledge. After that, a conventional graphical-model engine does the inference.
@jatingargiitk *respects d-separation