KIMI K3 + GRAPH ENGINEERING: THE FIVE STAGES BETWEEN 300 AGENTS AND ONE MAP

The Swarm Is the Muscle. The Graph Is What You Keep. Here is the architecture, the folder layout that makes it compound, and the work it already pays for

Moonshot shipped the thing every research workflow has been missing. Not a bigger model, though K3 is that too - it went from #18 to #1 on the Frontend Code Arena in a single July update, leading six of the seven frontend domains.
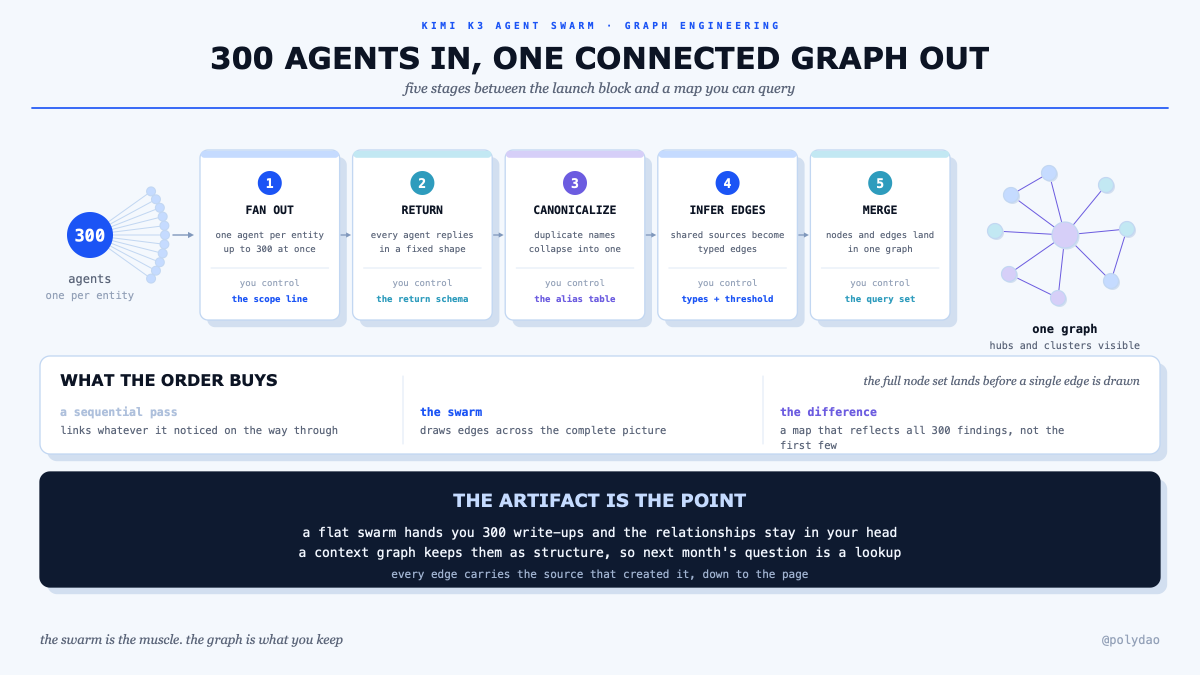
The part that changes how work gets done is Agent Swarm: up to three hundred agents pointed at one problem at the same time, and a context graph that keeps what they find connected instead of scattered.
Parallel research is impressive on its own. Parallel research that leaves behind a queryable artifact is a different category of tool.
This piece is the architecture of that artifact: the five stages a swarm run passes through, the folder layout that lets one graph outlive the run that built it, and the work people are already selling with it.
1/ What Three Hundred Parallel Agents Actually Buy
A single agent researching a hundred companies works down a list. By company ninety it has forgotten what company four looked like, and the write-up reflects whatever it saw most recently.
Three hundred agents working at once changes two things at the same time.
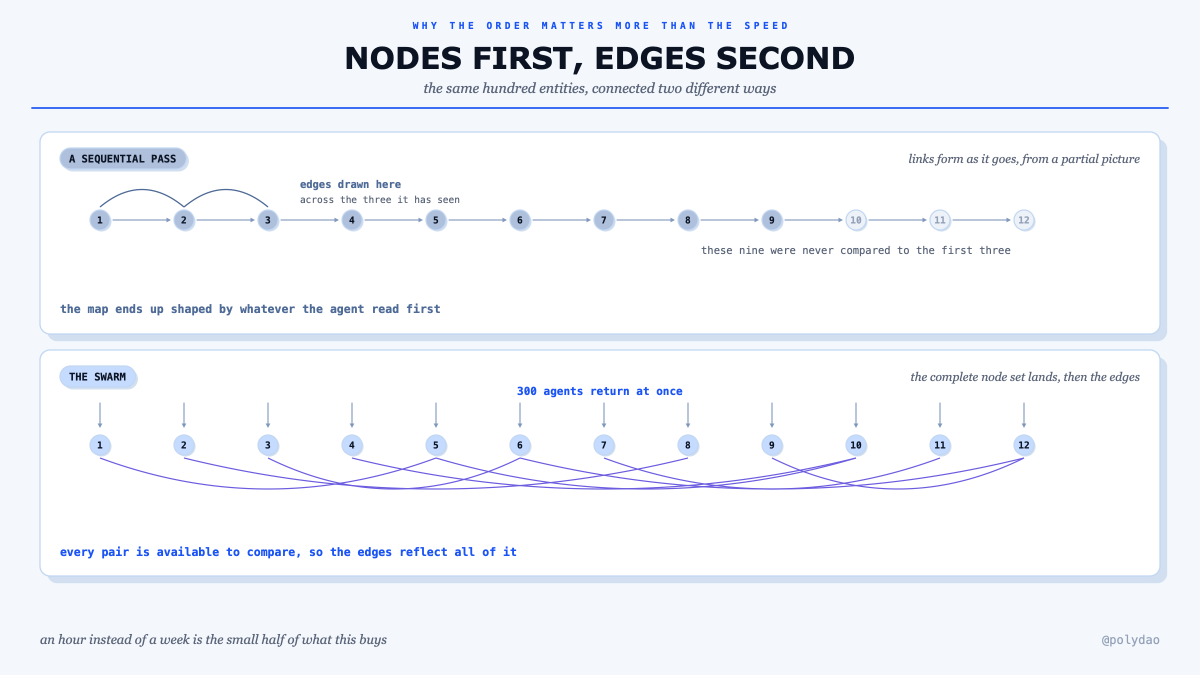
The obvious one is wall-clock time: an hour instead of a week. The one that matters more is that the full picture lands before any conclusions get drawn.
Every entity gets researched with equal attention, by an agent that had nothing else in its window, and only then does the system start looking for connections.
That ordering is what makes the output trustworthy. A sequential tool finds the links it happens to notice on the way through and biases the whole map toward whatever it saw first. The swarm materializes the complete node set, then draws edges across all of it.
2/ The Architecture: Five Stages
Graph engineering is what happens between the launch block and the answer. Five stages, and each one has a job you can name.
Stage three is where most graphs are won or lost.
| Stage | What happens | What you control |
|---|---|---|
| 1 · Fan out | One agent per entity, up to 300 in parallel | The scope line: 40 nodes needs 40 agents, not 300 |
| 2 · Return | Every agent replies in a fixed shape | The return schema, so the merge is deterministic |
| 3 · Canonicalize | Duplicate names collapse into one node | The alias table, written before the run |
| 4 · Infer edges | Shared sources, vendors and filings become typed edges | The edge types and the relevance threshold |
| 5 · Merge and query | Nodes and edges land in the graph, structural questions get answered | The query set, which grows over time |
"Block", "Square" and "Block Inc" arriving as three separate nodes splits one cluster into three, and every downstream query inherits the error. An alias table written the day before the launch costs ten minutes and saves the run.
The return schema in stage two is the other line that pays for itself.
Three hundred agents replying in prose overflows any orchestrator; three hundred agents replying in a fixed shape merge deterministically and cost a fraction of the tokens:
RETURN (per agent, nothing else):
  node_id · label · type
  sources: [max 3, url + date]
  candidate_edges: [target label + relation type + evidence line]
  confidence: 0-1
And the edge that comes out of stage four is worth defending in front of a client:
{ "from": "n041", "to": "n077", "type": "shared_processor",
  "evidence": "sec:0001 p.14", "confidence": 0.86 }
The evidence field is the difference between a map somebody has to trust and a map you can walk them through. Every connection traces back to the document that created it, down to the page.
3/ Where This Pays
The same five stages point at very different work depending on what you call a node.
| Use case | The node | The edge | The question it answers in one step |
|---|---|---|---|
| Competitive map | A company | Shared investor, processor or filing | Which vendor does a third of this market depend on |
| Supply-chain exposure | A supplier | A component both buyers source | Which two customers go down together |
| Regulatory surface | A filing or rule | The entities it touches | Who else gets hit when this rule changes |
| Talent map | A person or team | Shared employer, paper or repo | Where does the expertise for this build actually sit |
| Content and topic map | A claim or source | Citation, contradiction, supersession | Which claim is load-bearing across everything I published |
| Protocol dependency map | A protocol | Shared oracle, bridge or custodian | What single failure takes several of these down |
The pattern under all six: the value sits in relationships nobody wrote down, in a volume where a person cannot hold them in their head. Ten sources you can connect by hand. A hundred nodes carry thousands of possible relationships, which is exactly the point where a human gives up and a graph starts earning.
4/ The Folder Layout That Makes It Compound
A swarm run that writes into a chat window is a one-time answer. A swarm run that writes into a structured workspace is an asset that gets bigger every launch.
graph-workspace/
├── SKILL.md              you write it   · the procedure the swarm loads first
├── CONSTRAINTS.md        you write it   · corrections carried from past runs
├── SCHEMA.md             you write it   · node types, edge types, thresholds
├── aliases.csv           you write it   · canonical names, checked before merge
│
├── 00-launches/          you write it   · one launch block per question
│   ├── mobile-payments.md
│   └── ev-supply-chain.md
│
├── 10-returns/           the swarm writes · raw per-agent returns, one file per node
│   └── 2026-08-24/
│
├── 20-graph/             the swarm writes · the merged artifact
│   ├── nodes.jsonl
│   ├── edges.jsonl
│   └── graph.md          · human-readable index with wikilinks
│
├── 30-queries/           you ask, the swarm answers · saved structural questions
│   └── hubs.md
│
└── 40-runs/              append only    · one record per launch, never overwritten
    └── 2026-08-24T09-12.md
The four rules make this layout work rather than just look tidy.

SCHEMA.md deserves its own line, because it is the file that makes runs comparable:
# SCHEMA.md
NODE TYPES:  company · person · filing · vendor · protocol
EDGE TYPES:  shared_investor · shared_vendor · shared_filing
             supersedes · contradicts · depends_on
THRESHOLD:   drop candidate edges below 0.6 confidence
VERIFIED:    a node counts once it has 2 independent sources
Write it once and every launch against every market produces graphs that can be compared, merged and queried the same way.
5/ How the Second Run Beats the First
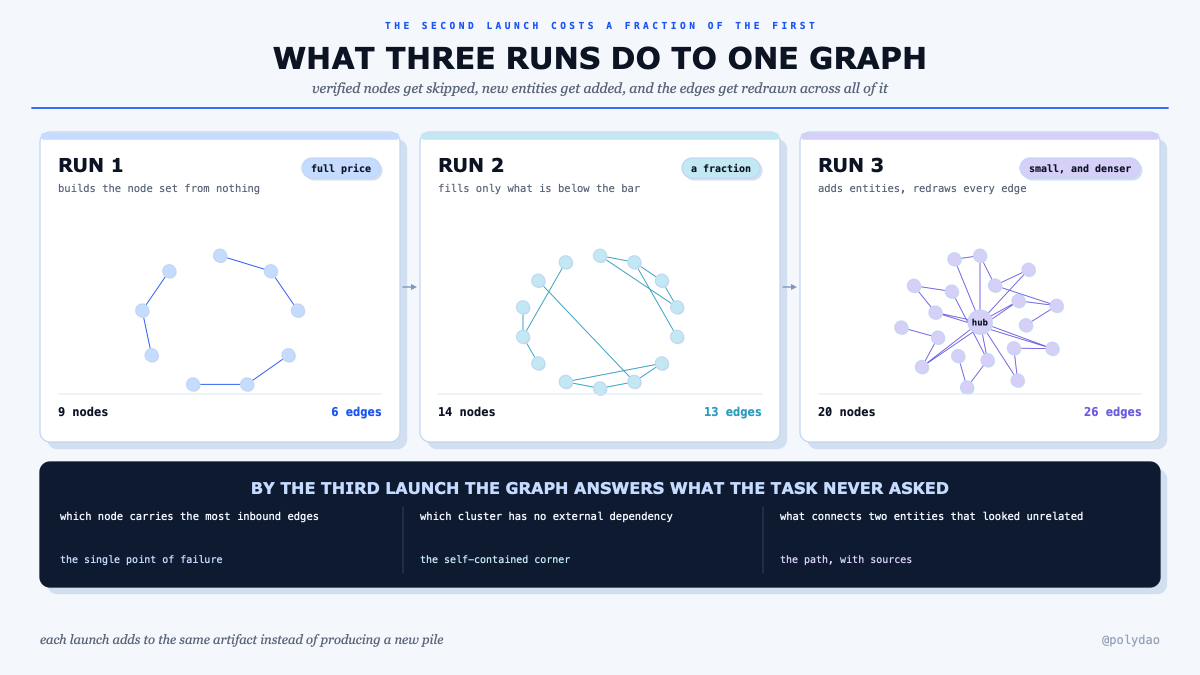
The first launch on a market is research. Everything after that is compounding, and it works because the workspace remembers.
| Run | What it does | What it costs |
|---|---|---|
| First | Builds the node set from nothing, draws the first edges | Full price |
| Second | Reuses verified nodes, fills only what is below the bar | A fraction, because verified work is skipped |
| Third and after | Adds new entities, redraws edges across the larger set | Small, and the graph gets denser each time |
By the third launch the graph answers questions the original task never mentioned. Which node carries the most inbound edges. Which cluster has no external dependency. What connects two entities that looked unrelated. Each of those is a lookup against structure that already exists, not a new research run.
What This Is Worth
| Channel | What it pays | What you need first |
|---|---|---|
| A competitive map sold as a deliverable | Replaces an analyst contract that runs into four figures, delivered in an afternoon | One graph of a market you know, built end to end |
| Retainer on a live graph | Monthly fee to re-run the launch, flag new edges and re-verify what changed | The first client's graph already standing |
| The workspace as a product | The layout above, packaged with SCHEMA, CONSTRAINTS and launch blocks for someone else's domain | This structure, tested on two different markets |
The third one is the interesting business. The five stages are the same in every domain; what changes is the schema and the alias table. Anyone who has built two graphs can build the third for someone else in a morning.
The Short Version
Three hundred agents is the part that gets posted about. The graph is the part that is still there next month, and the folder layout is what decides whether it survives the run that made it.
Write the schema, write the alias table, keep one author per directory, and let 40-runs grow. Then the second launch costs a fraction of the first and answers more.

