- Google Maps uses graph ML to predict ETA - Netflix uses graph ML...

Avi Chawla@_avichawla
76 views
Dec 12, 2025
~2 min read
Advertisement
1
- Google Maps uses graph ML to predict ETA
- Netflix uses graph ML in recommendation
- Spotify uses graph ML in recommendation
- Pinterest uses graph ML in recommendation
Here are 6 must-know ways for graph feature engineering (with code):
- Netflix uses graph ML in recommendation
- Spotify uses graph ML in recommendation
- Pinterest uses graph ML in recommendation
Here are 6 must-know ways for graph feature engineering (with code):
2
Like images, text, and tabular datasets have features, so do graph datasets.
This means when building models on graph datasets, we can engineer these features to achieve better performance.
Let's discuss some feature engineering techniques below!
This means when building models on graph datasets, we can engineer these features to achieve better performance.
Let's discuss some feature engineering techniques below!
3
First, let’s create a dummy social networking graph dataset with accounts and followers (which will also be accounts).
We create the two DataFrames shown below, an accounts DataFrame and a followers DataFrame.
Check this code👇
We create the two DataFrames shown below, an accounts DataFrame and a followers DataFrame.
Check this code👇
4
The above data is tabular, but we need to convert this into a graph format.
To do this, we use the networkx framework as follows:
• Initialize a graph G.
• Add nodes from the accounts DF.
• Added edges between the nodes using the followers' DF.
Here's the code👇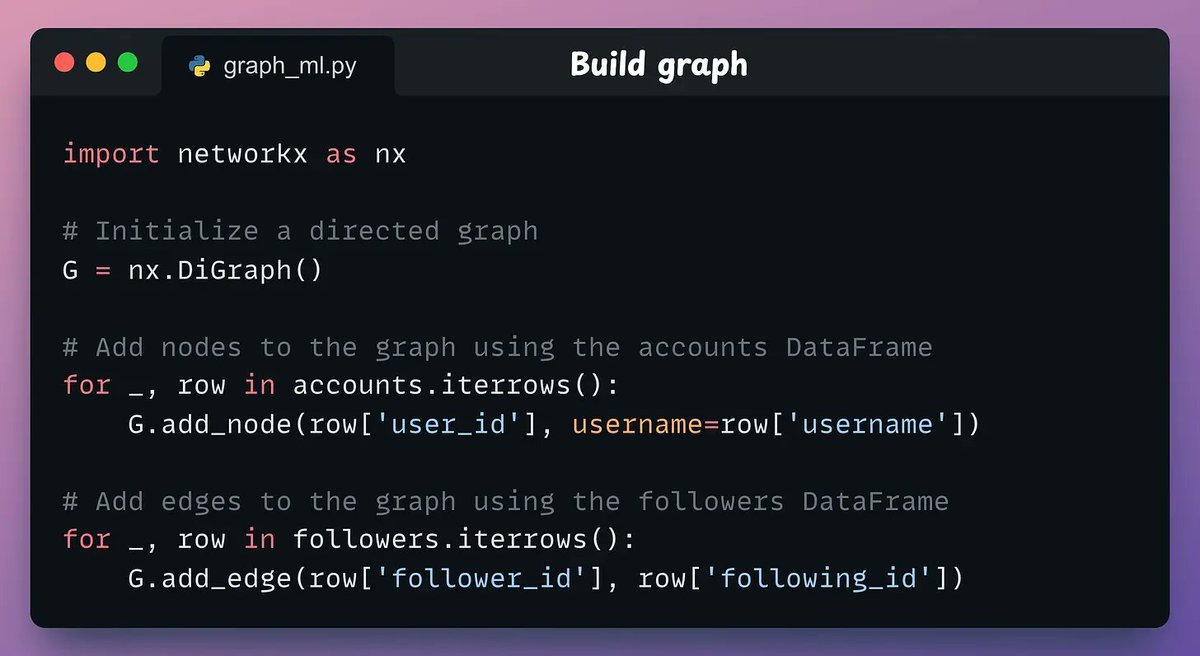
To do this, we use the networkx framework as follows:
• Initialize a graph G.
• Add nodes from the accounts DF.
• Added edges between the nodes using the followers' DF.
Here's the code👇
5
This produces the following graph.
Next, let's cover the 6 graph feature engineering techniques.
Next, let's cover the 6 graph feature engineering techniques.
6
1-3) Node degree
In a directed graph, there are two types of degrees:
• In-Degree: The number of incoming edges (followers) a node has.
• Out-Degree: The number of outgoing edges (followings) a node has.
In a directed graph, there are two types of degrees:
• In-Degree: The number of incoming edges (followers) a node has.
• Out-Degree: The number of outgoing edges (followings) a node has.
7
Here’s how we can compute them using NetworkX:
• in_degree(x) counts edges directed toward the node x.
• out_degree(x) counts edges directed away from the node x.
• degree(x) is the sum of the in-degree and out-degree of node x.
Check this code👇
• in_degree(x) counts edges directed toward the node x.
• out_degree(x) counts edges directed away from the node x.
• degree(x) is the sum of the in-degree and out-degree of node x.
Check this code👇
8
These features are now part of the accounts DataFrame.
Check this👇
Check this👇
9
4-6) Node centrality
Node degree features capture connectedness but fail to capture the influence of those connections.
For instance, a user can have many online friends just because they send friend requests to everyone.
Centrality features handle this.
Node degree features capture connectedness but fail to capture the influence of those connections.
For instance, a user can have many online friends just because they send friend requests to everyone.
Centrality features handle this.
10
4) Betweenness centrality
This measures how often a node appears on the shortest paths between other nodes.
If a node often acts as a “bridge” between other nodes, it plays a key role in facilitating information flow.
Here's the code👇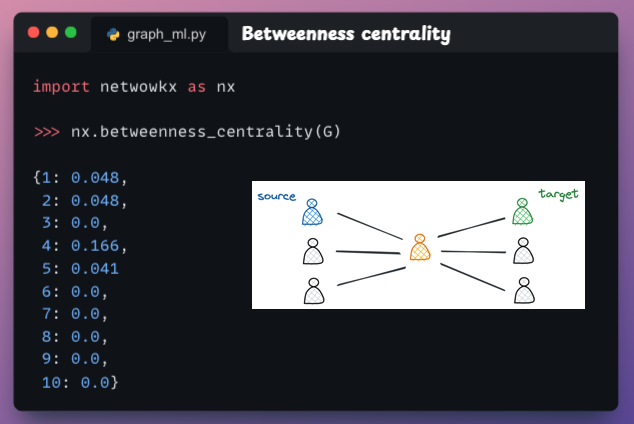
This measures how often a node appears on the shortest paths between other nodes.
If a node often acts as a “bridge” between other nodes, it plays a key role in facilitating information flow.
Here's the code👇
11
5) Closeness centrality
This indicates how close a node is to all other nodes in the network based on the shortest paths.
To compute closeness centrality for a node v, we sum the shortest path length from v to all other nodes and take its reciprocal.
Here's the code👇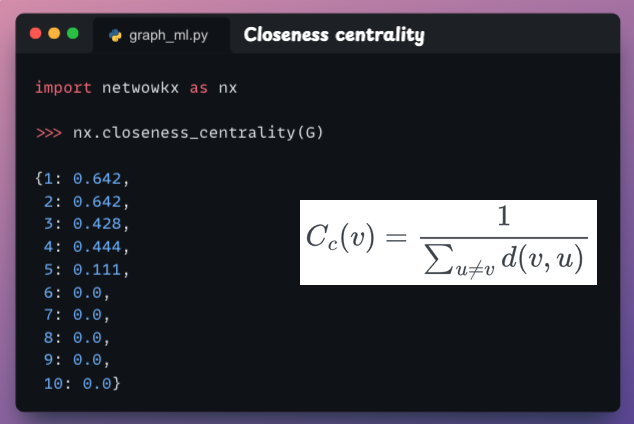
This indicates how close a node is to all other nodes in the network based on the shortest paths.
To compute closeness centrality for a node v, we sum the shortest path length from v to all other nodes and take its reciprocal.
Here's the code👇
12
6) Eigenvector centrality
If a node is connected to other influential nodes, it amplifies its own influence.
It helps identify nodes that are influential not only due to their direct ties but also due to their connections with other influential nodes.
Here's the code👇
If a node is connected to other influential nodes, it amplifies its own influence.
It helps identify nodes that are influential not only due to their direct ties but also due to their connections with other influential nodes.
Here's the code👇
13
PyTorch Geometric is a PyTorch extension specifically developed for building graph-based neural networks.
It has an intuitive API that facilitates inspecting and analyzing graphs and building ML models on graph-based datasets.
Open-source with 22k+ stars!
It has an intuitive API that facilitates inspecting and analyzing graphs and building ML models on graph-based datasets.
Open-source with 22k+ stars!
14
If you found it insightful, reshare it with your network.
Find me → @_avichawla
Every day, I share tutorials and insights on DS, ML, LLMs, and RAGs.
Find me → @_avichawla
Every day, I share tutorials and insights on DS, ML, LLMs, and RAGs.
Avi Chawla@_avichawla
- Google Maps uses graph ML to predict ETA
- Netflix uses graph ML in recommendation
- Spotify uses graph ML in recommendation
- Pinterest uses graph ML in recommendation
Here are 6 must-know ways for graph feature engineering (with code):
- Netflix uses graph ML in recommendation
- Spotify uses graph ML in recommendation
- Pinterest uses graph ML in recommendation
Here are 6 must-know ways for graph feature engineering (with code):