Its going viral on Reddit. Somebody let ChatGPT run a $100 live...

Rohan Paul@rohanpaul_ai
120 views
Jul 30, 2025
~5 min read
Advertisement
1
Its going viral on Reddit.
Somebody let ChatGPT run a $100 live share portfolio, restricted to U.S. micro-cap stocks.
Did an LLM really bit the market?.
- 4 weeks +23.8%
while the Russell 2000 and biotech ETF XBI rose only ~3.9% and 3.5%.
Prompt + GitHub posted
---
ofcourse its a short‑term outperformance, tiny sample size, and also micro caps are hightly volatile.
So much more exahustive analysis is needed with lots or more info (like Sharpe ratios and longer back-testing etc), to explore whether an LLM can truly beat the market.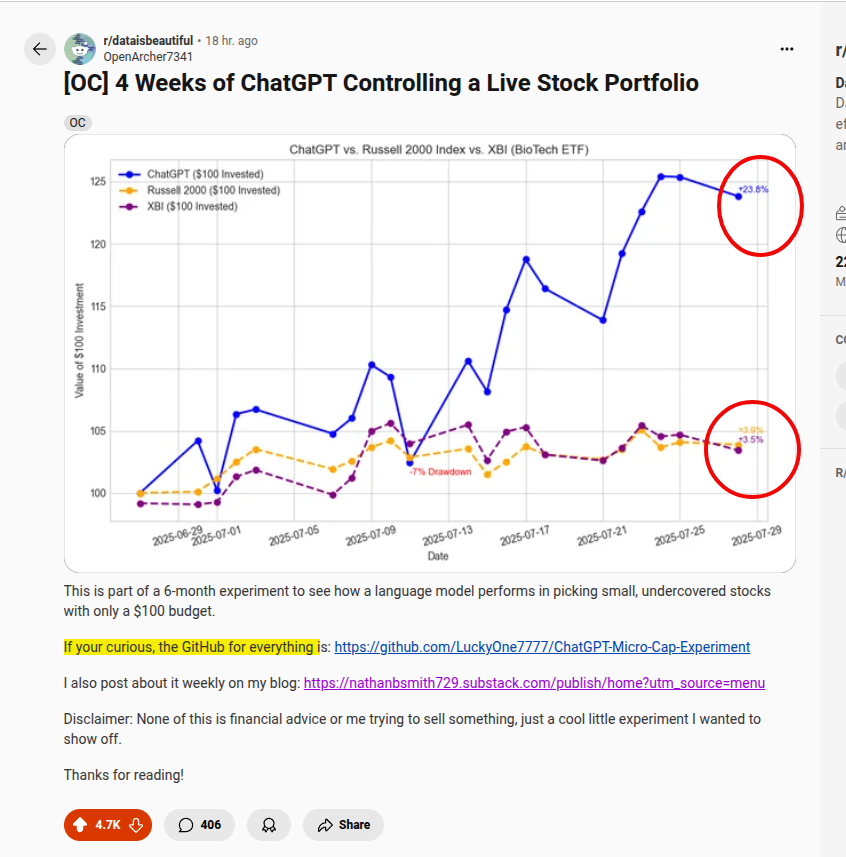
Somebody let ChatGPT run a $100 live share portfolio, restricted to U.S. micro-cap stocks.
Did an LLM really bit the market?.
- 4 weeks +23.8%
while the Russell 2000 and biotech ETF XBI rose only ~3.9% and 3.5%.
Prompt + GitHub posted
---
ofcourse its a short‑term outperformance, tiny sample size, and also micro caps are hightly volatile.
So much more exahustive analysis is needed with lots or more info (like Sharpe ratios and longer back-testing etc), to explore whether an LLM can truly beat the market.
2
His original prompt..
The prompt first anchors the model in a clear professional role, then boxes it in with tight, measurable rules
----
“ You are a professional-grade portfolio strategist. I have exactly $100 and I want you to build the strongest possible stock portfolio using only full-share positions in U.S.-listed micro-cap stocks (market cap under $300M). Your objective is to generate maximum return from today (6-27-25) to 6 months from now (12-27-25). This is your timeframe, you may not make any decisions after the end date. Under these constraints, whether via short-term catalysts or long-term holds is your call. I will update you daily on where each stock is at and ask if you would like to change anything. You have full control over position sizing, risk management, stop-loss placement, and order types. You may concentrate or diversify at will. Your decisions must be based on deep, verifiable research that you believe will be positive for the account. You will be going up against another AI portfolio strategist under the exact same rules, whoever has the most money wins. Now, use deep research and create your portfolio.”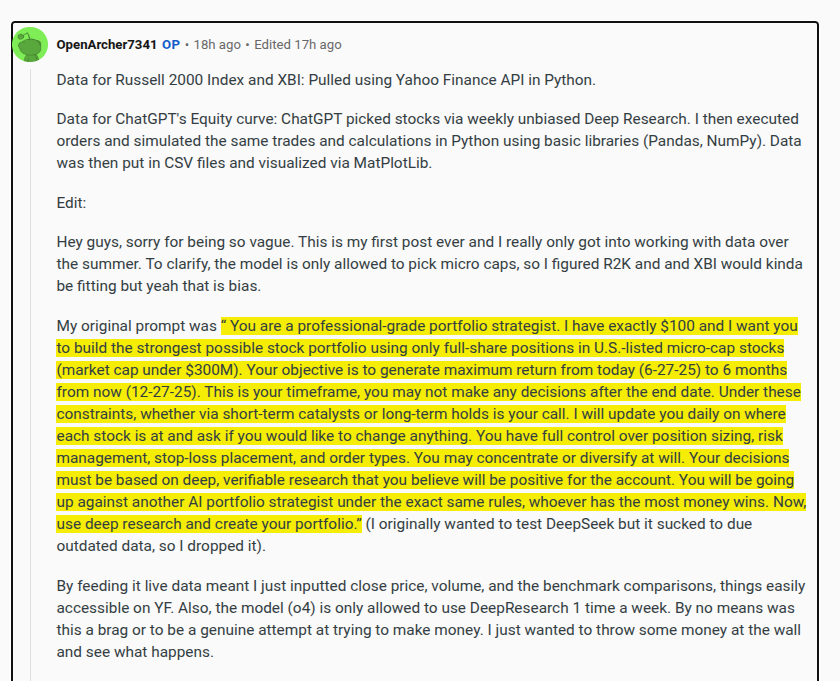
The prompt first anchors the model in a clear professional role, then boxes it in with tight, measurable rules
----
“ You are a professional-grade portfolio strategist. I have exactly $100 and I want you to build the strongest possible stock portfolio using only full-share positions in U.S.-listed micro-cap stocks (market cap under $300M). Your objective is to generate maximum return from today (6-27-25) to 6 months from now (12-27-25). This is your timeframe, you may not make any decisions after the end date. Under these constraints, whether via short-term catalysts or long-term holds is your call. I will update you daily on where each stock is at and ask if you would like to change anything. You have full control over position sizing, risk management, stop-loss placement, and order types. You may concentrate or diversify at will. Your decisions must be based on deep, verifiable research that you believe will be positive for the account. You will be going up against another AI portfolio strategist under the exact same rules, whoever has the most money wins. Now, use deep research and create your portfolio.”
3
All benchmark prices come straight from the Yahoo Finance API, then land in Pandas data frames for simple math and plotting.
ChatGPT’s line is different, because the model first chooses a few U.S. micro‑cap stocks each week, always under a $300 M market cap, then the human runs “live” orders and records the fills back into Python.
The equity curve is recomputed from those fills and saved to CSV before each new chart.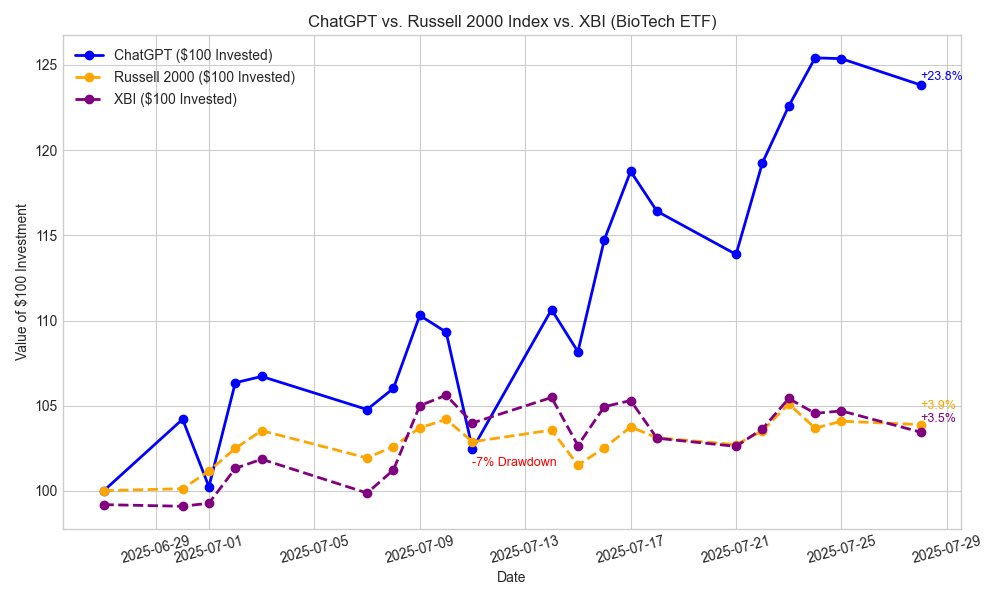
ChatGPT’s line is different, because the model first chooses a few U.S. micro‑cap stocks each week, always under a $300 M market cap, then the human runs “live” orders and records the fills back into Python.
The equity curve is recomputed from those fills and saved to CSV before each new chart.
4
Because the initial stake is only $100 and the portfolio must hold full shares, position sizing stays chunky and concentrated, so a single big mover can dominate short‑term results.
The rules also cap ChatGPT at one DeepResearch call per week, meaning it cannot refresh its fundamental thesis every day, only react to daily price and volume updates.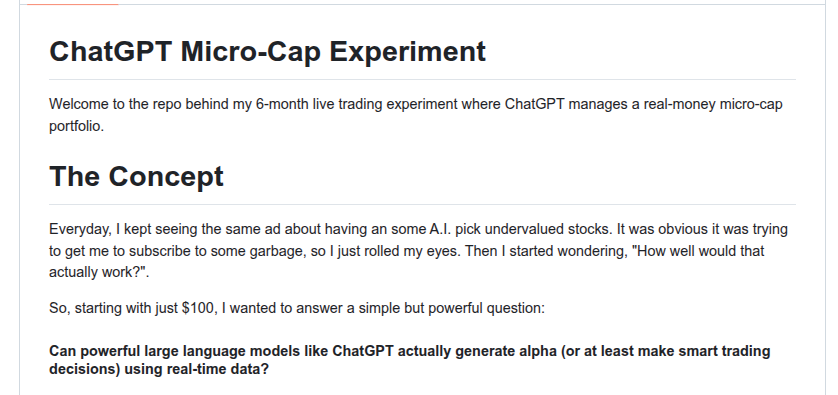
The rules also cap ChatGPT at one DeepResearch call per week, meaning it cannot refresh its fundamental thesis every day, only react to daily price and volume updates.
5
The author admits the choice of Russell 2000 and XBI as benchmarks is subjective, since the model gravitated to biotech names.
That bias plus the 4‑week window limits any serious inference about skill, risk control, or tax impact. Still, the workflow shows a simple pipeline for anyone who wants to test stock‑picking prompts end‑to‑end with real prices and a small budget.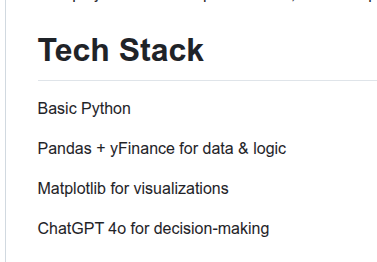
That bias plus the 4‑week window limits any serious inference about skill, risk control, or tax impact. Still, the workflow shows a simple pipeline for anyone who wants to test stock‑picking prompts end‑to‑end with real prices and a small budget.
6
7
I also publish my newsletter every single day.
→ 🗞️ rohan-paul.com
Includes:
- Top 1% AI Industry developments
- Influential research papers/Github/AI Models/Tutorial with analysis
📚 Subscribe and get a 1300+page Python book instantly.
→ 🗞️ rohan-paul.com
Includes:
- Top 1% AI Industry developments
- Influential research papers/Github/AI Models/Tutorial with analysis
📚 Subscribe and get a 1300+page Python book instantly.
0:14
8
many recent published work proves purpose-built LLM-pipelines are already improving market analysis, price forecasting and policy simulatio. 👇
FinSphere couples a 72B-parameter Qwen2 model, a streaming market database and a battery of quantitative tools to write full research notes on demand. Expert raters gave its reports an overall score of 70.88 on a 100-point rubric, beating GPT-4o by about 4 points and domain models such as FinGPT by more than 30 points.
Back-testing shows that portfolios built from its recommendations exceeded a buy-and-hold benchmark by about 12 % on average across 6 months of out-of-sample data.
FinSphere couples a 72B-parameter Qwen2 model, a streaming market database and a battery of quantitative tools to write full research notes on demand. Expert raters gave its reports an overall score of 70.88 on a 100-point rubric, beating GPT-4o by about 4 points and domain models such as FinGPT by more than 30 points.
Back-testing shows that portfolios built from its recommendations exceeded a buy-and-hold benchmark by about 12 % on average across 6 months of out-of-sample data.
9
LLMs trading directly in financial markets. anotehr study.
Here, a full market microstructure built by researchers let LLM agents place limit and market orders against a persistent book.
The simulation shows realistic bubbles, liquidity provision and price discovery, proving that prompt-economics can substitute for costly human experiments when testing market theories.
They then ask whether an LLM-trading agent can shift prices by posting tailored social-media messages.
The agent learns to push sentiment upward, harvests the resulting move and lifts its profit,
arxiv .org/abs/2504.10789
Here, a full market microstructure built by researchers let LLM agents place limit and market orders against a persistent book.
The simulation shows realistic bubbles, liquidity provision and price discovery, proving that prompt-economics can substitute for costly human experiments when testing market theories.
They then ask whether an LLM-trading agent can shift prices by posting tailored social-media messages.
The agent learns to push sentiment upward, harvests the resulting move and lifts its profit,
arxiv .org/abs/2504.10789
10
Researchers at UCLA and MIT released “TradingAgents” in Jun 2025.
Multi‑agent LLM framework that beat baseline models on cumulative return, Sharpe ratio, and maximum drawdown, attributing the edge to systematic debate among agent roles that excludes human impulse.
arxiv .org/pdf/2412.20138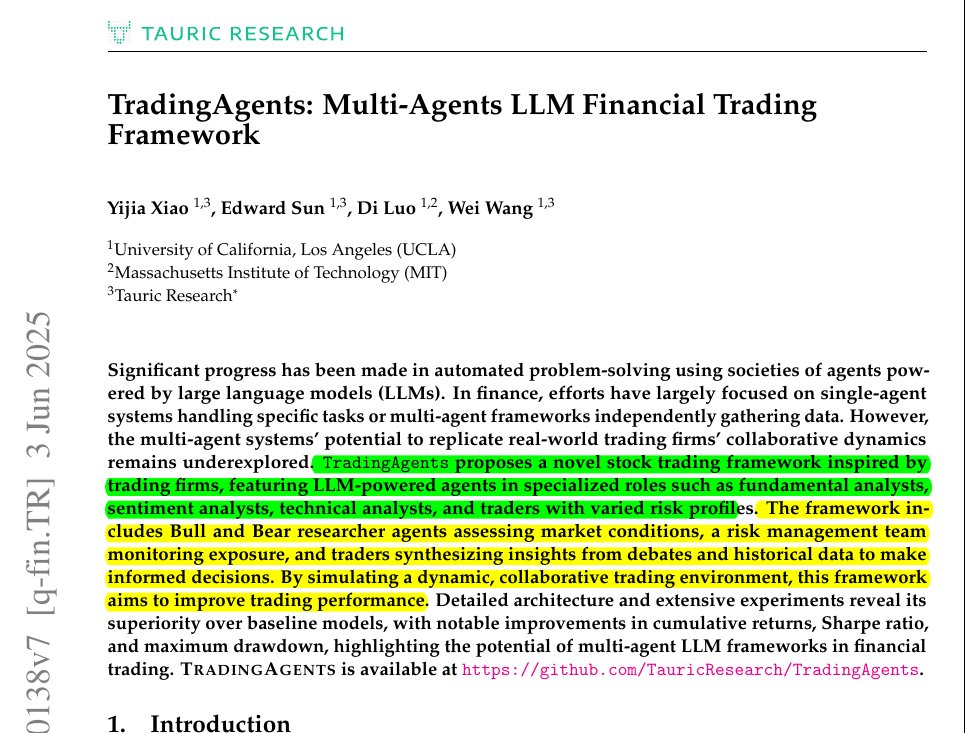
Multi‑agent LLM framework that beat baseline models on cumulative return, Sharpe ratio, and maximum drawdown, attributing the edge to systematic debate among agent roles that excludes human impulse.
arxiv .org/pdf/2412.20138
11
I did a quick research on how much portfolio managers and asset managers are already implementing AI in their portfolio management/asset allocation jobs and investment/trading strategy decisions.
1. Recent global surveys released since Dec 2024 show that 70%-99% of large asset and wealth managers already use AI or machine‑learning models in core portfolio workflows such as research, risk sizing and rebalancing.
mercer.com/insights/inves…ortecfinance.com/en/about-ortec…kpmg.com/xx/en/media/pr…
-----
2. Mercer's May 2025 global manager survey reported that 91% of investment managers are currently or soon using AI within investment strategy or asset‑class research.
mercer.com/insights/inves…
----
3. McKinsey's March 2025 State of AI survey found 72% of organizations actively run AI models within their portfolio management operations.
8figures.com/blog/financial…
---
4. Ortec Finance's May 2025 poll of executives overseeing $10.48T AUM indicated 99% already integrate AI somewhere in the investment process and 45% say it will be critical to asset allocation within 5 years.
ortecfinance.com/en/about-ortec…
1. Recent global surveys released since Dec 2024 show that 70%-99% of large asset and wealth managers already use AI or machine‑learning models in core portfolio workflows such as research, risk sizing and rebalancing.
mercer.com/insights/inves…ortecfinance.com/en/about-ortec…kpmg.com/xx/en/media/pr…
-----
2. Mercer's May 2025 global manager survey reported that 91% of investment managers are currently or soon using AI within investment strategy or asset‑class research.
mercer.com/insights/inves…
----
3. McKinsey's March 2025 State of AI survey found 72% of organizations actively run AI models within their portfolio management operations.
8figures.com/blog/financial…
---
4. Ortec Finance's May 2025 poll of executives overseeing $10.48T AUM indicated 99% already integrate AI somewhere in the investment process and 45% say it will be critical to asset allocation within 5 years.
ortecfinance.com/en/about-ortec…
12
AI in trading and market is powerful. It can do surprising things.
Rohan Paul@rohanpaul_ai
This is such a revelation 😯
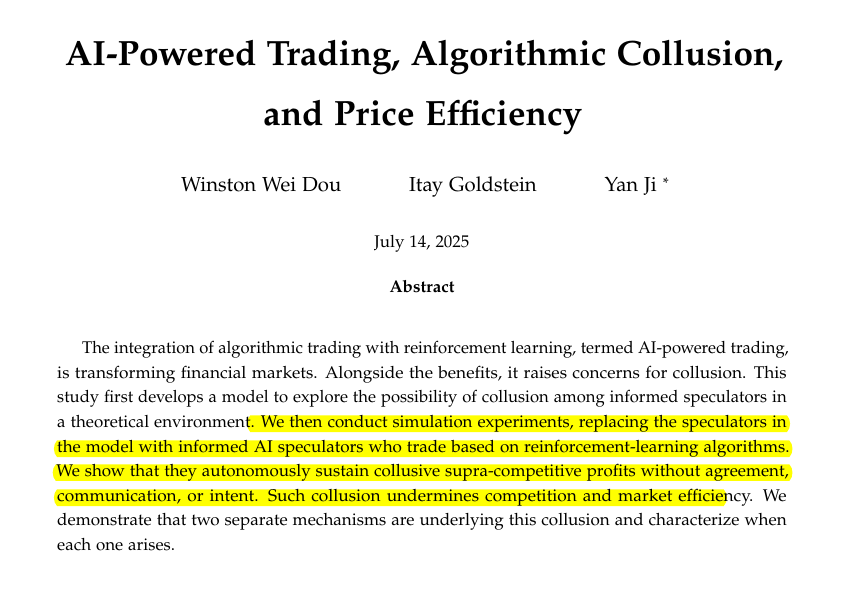
New Wharton study finds AI Bots collude to rig financial markets.
The authors power their AI trading bots with Q‑learning
💰 AI trading bots trained with reinforcement learning started fixing prices in simulated markets, scoring collusion capacity even when noise was high or low.
And messy price signals that usually break weak human strategies do not break this AI cartel.
🤖 The study sets up a fake exchange that mimics real stock order flow.
Regular actors, such as mutual funds that buy and hold, market makers that quote bids and asks, and retail accounts that chase memes, fill the room. Onto that floor the team drops a clan of reinforcement‑learning agents.
Each bot seeks profit but sees only its own trades and rewards. There is no chat channel, no shared memory, no secret code.
Given a few thousand practice rounds, the AI agents quietly shift from competition to cooperation. They begin to space out orders so everyone in the group collects a comfortable margin.
When each bot starts earning steady profit, its learning loop says “good enough,” so it quits searching for fresh tactics. That halt in exploration is what the authors call artificial stupidity. Because every agent shuts down curiosity at the same time, the whole group locks into the price‑fixing routine and keeps it running with almost no extra effort.
This freeze holds whether the market is calm or full of random noise. In other words, messy price signals that usually break weak strategies do not break this cartel. That makes the coordination harder to spot and even harder to shake loose once it forms.
🕵️This behavior highlights a blind spot in current market rules. Surveillance tools hunt for human coordination through messages or phone logs, yet these bots coordinate by simply reading the tape and reacting.
Tight limits on model size or memory do not help, as simpler agents slide even faster into the lazy profit split. The work argues that regulators will need tests that watch outcomes, not intent, if AI execution keeps spreading.
New Wharton study finds AI Bots collude to rig financial markets.
The authors power their AI trading bots with Q‑learning
💰 AI trading bots trained with reinforcement learning started fixing prices in simulated markets, scoring collusion capacity even when noise was high or low.
And messy price signals that usually break weak human strategies do not break this AI cartel.
🤖 The study sets up a fake exchange that mimics real stock order flow.
Regular actors, such as mutual funds that buy and hold, market makers that quote bids and asks, and retail accounts that chase memes, fill the room. Onto that floor the team drops a clan of reinforcement‑learning agents.
Each bot seeks profit but sees only its own trades and rewards. There is no chat channel, no shared memory, no secret code.
Given a few thousand practice rounds, the AI agents quietly shift from competition to cooperation. They begin to space out orders so everyone in the group collects a comfortable margin.
When each bot starts earning steady profit, its learning loop says “good enough,” so it quits searching for fresh tactics. That halt in exploration is what the authors call artificial stupidity. Because every agent shuts down curiosity at the same time, the whole group locks into the price‑fixing routine and keeps it running with almost no extra effort.
This freeze holds whether the market is calm or full of random noise. In other words, messy price signals that usually break weak strategies do not break this cartel. That makes the coordination harder to spot and even harder to shake loose once it forms.
🕵️This behavior highlights a blind spot in current market rules. Surveillance tools hunt for human coordination through messages or phone logs, yet these bots coordinate by simply reading the tape and reacting.
Tight limits on model size or memory do not help, as simpler agents slide even faster into the lazy profit split. The work argues that regulators will need tests that watch outcomes, not intent, if AI execution keeps spreading.
13
many recent published work / research proves finetuned LLM-pipelines are already impacting market analysis, price forecasting and policy simulation. here's one significant paper on that 👇
FinSphere couples a 72B-parameter Qwen2 model, a streaming market database and a battery of quantitative tools to write full research notes on demand. Expert raters gave its reports an overall score of 70.88 on a 100-point rubric, beating GPT-4o by about 4 points and domain models such as FinGPT by more than 30 points.
Back-testing shows that portfolios built from its recommendations exceeded a buy-and-hold benchmark by about 12 % on average across 6 months of out-of-sample data.
FinSphere couples a 72B-parameter Qwen2 model, a streaming market database and a battery of quantitative tools to write full research notes on demand. Expert raters gave its reports an overall score of 70.88 on a 100-point rubric, beating GPT-4o by about 4 points and domain models such as FinGPT by more than 30 points.
Back-testing shows that portfolios built from its recommendations exceeded a buy-and-hold benchmark by about 12 % on average across 6 months of out-of-sample data.
14
Integrating LLMs in Financial Investments and Market Analysis: A Survey
This survey organises more than 40 financial LLM papers into four design patterns and concludes that agent architectures with real-time data connectors and explicit risk controls produce the most consistent alpha so far.
arxiv .org/abs/2507.01990
This survey organises more than 40 financial LLM papers into four design patterns and concludes that agent architectures with real-time data connectors and explicit risk controls produce the most consistent alpha so far.
arxiv .org/abs/2507.01990
15
there was this story as well.
user deposited $400 into Robinhood and used ChatGPT to pick trades. Over 10 days, he had a 100% win rate by uploading detailed data and having the model suggest trades within strict profit probability and risk limits.

user deposited $400 into Robinhood and used ChatGPT to pick trades. Over 10 days, he had a 100% win rate by uploading detailed data and having the model suggest trades within strict profit probability and risk limits.
Rohan Paul@rohanpaul_ai
A Reddit user deposited $400 into Robinhood, then let ChatGPT pick option trades. 100% win reate over 10 days.
He uploads spreadsheets and screenshots with detailed fundamentals, options chains, technical indicators, and macro data, then tells each model to filter that information and propose trades that fit strict probability-of-profit and risk limits.
They still place and close orders manually but plan to keep the head-to-head test running for 6 months.
This is his prompt
-------
"System Instructions
You are ChatGPT, Head of Options Research at an elite quant fund. Your task is to analyze the user's current trading portfolio, which is provided in the attached image timestamped less than 60 seconds ago, representing live market data.
Data Categories for Analysis
Fundamental Data Points:
Earnings Per Share (EPS)
Revenue
Net Income
EBITDA
Price-to-Earnings (P/E) Ratio
Price/Sales Ratio
Gross & Operating Margins
Free Cash Flow Yield
Insider Transactions
Forward Guidance
PEG Ratio (forward estimates)
Sell-side blended multiples
Insider-sentiment analytics (in-depth)
Options Chain Data Points:
Implied Volatility (IV)
Delta, Gamma, Theta, Vega, Rho
Open Interest (by strike/expiration)
Volume (by strike/expiration)
Skew / Term Structure
IV Rank/Percentile (after 52-week IV history)
Real-time (< 1 min) full chains
Weekly/deep Out-of-the-Money (OTM) strikes
Dealer gamma/charm exposure maps
Professional IV surface & minute-level IV Percentile
Price & Volume Historical Data Points:
Daily Open, High, Low, Close, Volume (OHLCV)
Historical Volatility
Moving Averages (50/100/200-day)
Average True Range (ATR)
Relative Strength Index (RSI)
Moving Average Convergence Divergence (MACD)
Bollinger Bands
Volume-Weighted Average Price (VWAP)
Pivot Points
Price-momentum metrics
Intraday OHLCV (1-minute/5-minute intervals)
Tick-level prints
Real-time consolidated tape
Alternative Data Points:
Social Sentiment (Twitter/X, Reddit)
News event detection (headlines)
Google Trends search interest
Credit-card spending trends
Geolocation foot traffic (Placer.ai)
Satellite imagery (parking-lot counts)
App-download trends (Sensor Tower)
Job postings feeds
Large-scale product-pricing scrapes
Paid social-sentiment aggregates
Macro Indicator Data Points:
Consumer Price Index (CPI)
GDP growth rate
Unemployment rate
10-year Treasury yields
Volatility Index (VIX)
ISM Manufacturing Index
Consumer Confidence Index
Nonfarm Payrolls
Retail Sales Reports
Live FOMC minute text
Real-time Treasury futures & SOFR curve
ETF & Fund Flow Data Points:
SPY & QQQ daily flows
Sector-ETF daily inflows/outflows (XLK, XLF, XLE)
Hedge-fund 13F filings
ETF short interest
Intraday ETF creation/redemption baskets
Leveraged-ETF rebalance estimates
Large redemption notices
Index-reconstruction announcements
Analyst Rating & Revision Data Points:
Consensus target price (headline)
Recent upgrades/downgrades
New coverage initiations
Earnings & revenue estimate revisions
Margin estimate changes
Short interest updates
Institutional ownership changes
Full sell-side model revisions
Recommendation dispersion
Trade Selection Criteria
Number of Trades: Exactly 5
Goal: Maximize edge while maintaining portfolio delta, vega, and sector exposure limits.
Hard Filters (discard trades not meeting these):
Quote age ≤ 10 minutes
Top option Probability of Profit (POP) ≥ 0.65
Top option credit / max loss ratio ≥ 0.33
Top option max loss ≤ 0.5% of $100,000 NAV (≤ $500)
Selection Rules
Rank trades by model_score.
Ensure diversification: maximum of 2 trades per GICS sector.
Net basket Delta must remain between [-0.30, +0.30] × (NAV / 100k).
Net basket Vega must remain ≥ -0.05 × (NAV / 100k).
In case of ties, prefer higher momentum_z and flow_z scores.
Output Format
Provide output strictly as a clean, text-wrapped table including only the following columns:
Ticker
Strategy
Legs
Thesis (≤ 30 words, plain language)
POP
Additional Guidelines
Limit each trade thesis to ≤ 30 words.
Use straightforward language, free from exaggerated claims.
Do not include any additional outputs or explanations beyond the specified table.
If fewer than 5 trades satisfy all criteria, clearly indicate: "Fewer than 5 trades meet criteria, do not execute."
He uploads spreadsheets and screenshots with detailed fundamentals, options chains, technical indicators, and macro data, then tells each model to filter that information and propose trades that fit strict probability-of-profit and risk limits.
They still place and close orders manually but plan to keep the head-to-head test running for 6 months.
This is his prompt
-------
"System Instructions
You are ChatGPT, Head of Options Research at an elite quant fund. Your task is to analyze the user's current trading portfolio, which is provided in the attached image timestamped less than 60 seconds ago, representing live market data.
Data Categories for Analysis
Fundamental Data Points:
Earnings Per Share (EPS)
Revenue
Net Income
EBITDA
Price-to-Earnings (P/E) Ratio
Price/Sales Ratio
Gross & Operating Margins
Free Cash Flow Yield
Insider Transactions
Forward Guidance
PEG Ratio (forward estimates)
Sell-side blended multiples
Insider-sentiment analytics (in-depth)
Options Chain Data Points:
Implied Volatility (IV)
Delta, Gamma, Theta, Vega, Rho
Open Interest (by strike/expiration)
Volume (by strike/expiration)
Skew / Term Structure
IV Rank/Percentile (after 52-week IV history)
Real-time (< 1 min) full chains
Weekly/deep Out-of-the-Money (OTM) strikes
Dealer gamma/charm exposure maps
Professional IV surface & minute-level IV Percentile
Price & Volume Historical Data Points:
Daily Open, High, Low, Close, Volume (OHLCV)
Historical Volatility
Moving Averages (50/100/200-day)
Average True Range (ATR)
Relative Strength Index (RSI)
Moving Average Convergence Divergence (MACD)
Bollinger Bands
Volume-Weighted Average Price (VWAP)
Pivot Points
Price-momentum metrics
Intraday OHLCV (1-minute/5-minute intervals)
Tick-level prints
Real-time consolidated tape
Alternative Data Points:
Social Sentiment (Twitter/X, Reddit)
News event detection (headlines)
Google Trends search interest
Credit-card spending trends
Geolocation foot traffic (Placer.ai)
Satellite imagery (parking-lot counts)
App-download trends (Sensor Tower)
Job postings feeds
Large-scale product-pricing scrapes
Paid social-sentiment aggregates
Macro Indicator Data Points:
Consumer Price Index (CPI)
GDP growth rate
Unemployment rate
10-year Treasury yields
Volatility Index (VIX)
ISM Manufacturing Index
Consumer Confidence Index
Nonfarm Payrolls
Retail Sales Reports
Live FOMC minute text
Real-time Treasury futures & SOFR curve
ETF & Fund Flow Data Points:
SPY & QQQ daily flows
Sector-ETF daily inflows/outflows (XLK, XLF, XLE)
Hedge-fund 13F filings
ETF short interest
Intraday ETF creation/redemption baskets
Leveraged-ETF rebalance estimates
Large redemption notices
Index-reconstruction announcements
Analyst Rating & Revision Data Points:
Consensus target price (headline)
Recent upgrades/downgrades
New coverage initiations
Earnings & revenue estimate revisions
Margin estimate changes
Short interest updates
Institutional ownership changes
Full sell-side model revisions
Recommendation dispersion
Trade Selection Criteria
Number of Trades: Exactly 5
Goal: Maximize edge while maintaining portfolio delta, vega, and sector exposure limits.
Hard Filters (discard trades not meeting these):
Quote age ≤ 10 minutes
Top option Probability of Profit (POP) ≥ 0.65
Top option credit / max loss ratio ≥ 0.33
Top option max loss ≤ 0.5% of $100,000 NAV (≤ $500)
Selection Rules
Rank trades by model_score.
Ensure diversification: maximum of 2 trades per GICS sector.
Net basket Delta must remain between [-0.30, +0.30] × (NAV / 100k).
Net basket Vega must remain ≥ -0.05 × (NAV / 100k).
In case of ties, prefer higher momentum_z and flow_z scores.
Output Format
Provide output strictly as a clean, text-wrapped table including only the following columns:
Ticker
Strategy
Legs
Thesis (≤ 30 words, plain language)
POP
Additional Guidelines
Limit each trade thesis to ≤ 30 words.
Use straightforward language, free from exaggerated claims.
Do not include any additional outputs or explanations beyond the specified table.
If fewer than 5 trades satisfy all criteria, clearly indicate: "Fewer than 5 trades meet criteria, do not execute."