Morgan Stanley just released a fantastic 52 page deck on the state...

Boring_Business@BoringBiz_
36 views
Jun 09, 2025
~1 min read
1
Morgan Stanley just released a fantastic 52 page deck on the state of markets and their asset allocation framework for June 2025
Some charts that caught my eye
🧵
1/ Indicators have recently diverged between actual economic activity and sentiment
Some charts that caught my eye
🧵
1/ Indicators have recently diverged between actual economic activity and sentiment
2
2/ Tariffs currently trending towards de-escalation...

3
3/ ...leading to more risk-on behavior in markets

4
4/ Public sector employment has exploded since 2022 and the private sector has not kept up

5
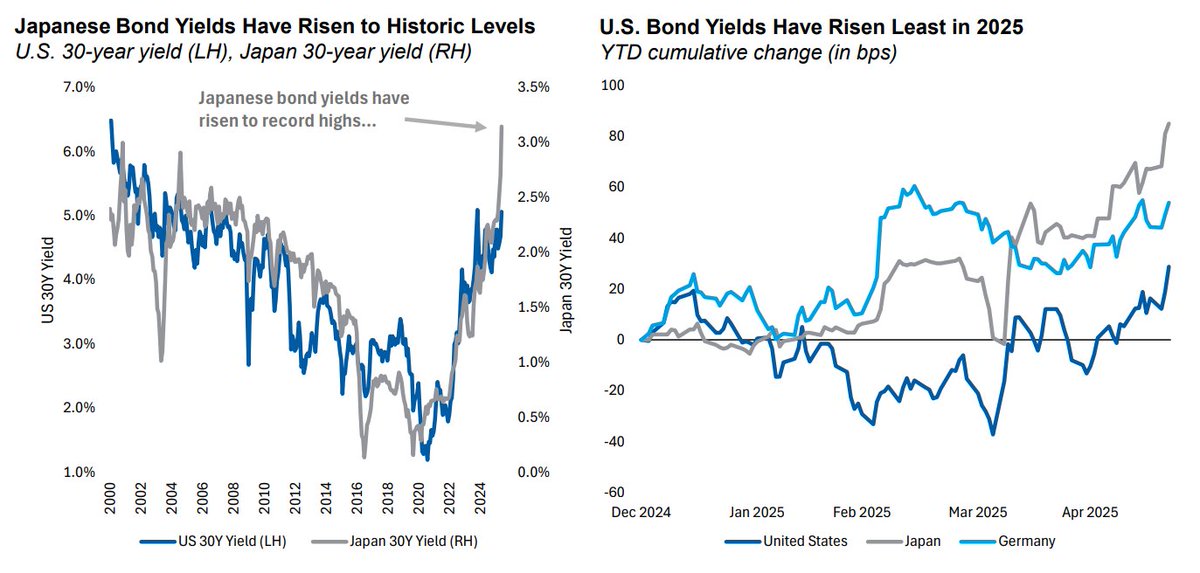
5/ Global bond yields are currently on the rise
6
6/ Muni over treasury yield ratios have moved higher since the end of last year

7
7/ European HY currently offering the highest yield across the bond market on a currency hedged basis

8
8/ Reserve bank of India recently shifted towards easing of financial conditions, which has historically been a positive for their stock market

9
9/ Floating rate loans have a negative 10yr correlation to US treasuries

10
10/ The real estate market has started to stabilize

11
11/ Asset allocation and positioning framework, according to Morgan Stanley

12
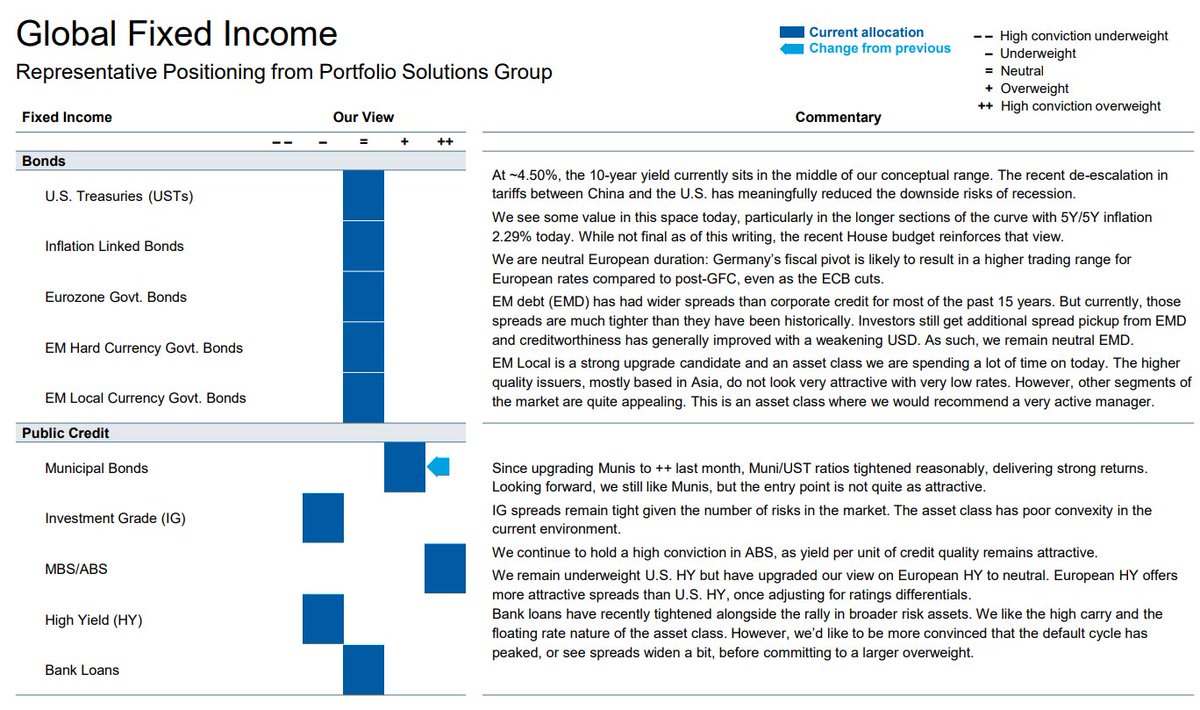
12/ Fixed income positioning framework, according to Morgan Stanley
13
13/ Equities positioning framework, according to Morgan Stanley

14
14/ Bond yields across developed and emerging markets

15
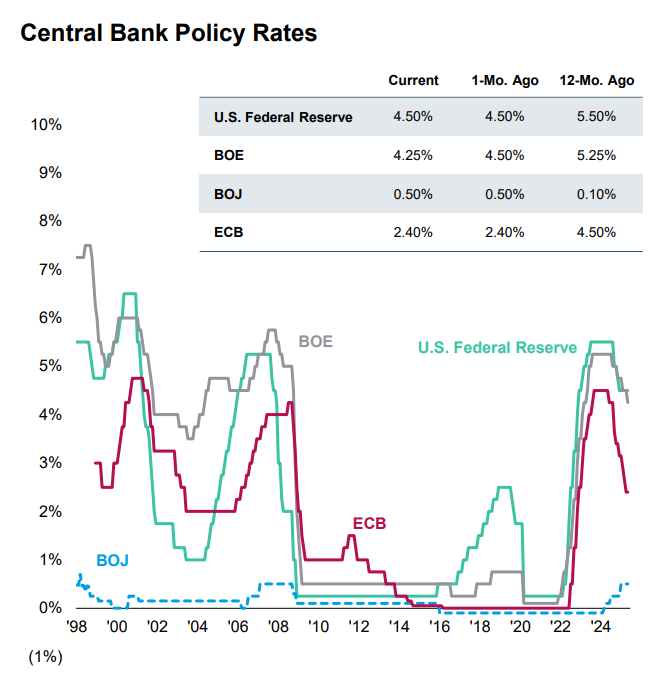
15/ Central bank policy rates, current vs 1m ago and 12m ago
16
16/ Treasury yields and performance

17
17/ Spreads across fixed income instruments

18
18/ Corporate bond market performance

19
19/ Default rates across HY corporate and loans

20
20/ Muni bond market update

21
21/ EM bond market update

22
22/ Fixed income asset class returns

23
23/ Current NTM P/E vs 10yr high/low and average in equities

24
24/ Current NTM P/E vs 10yr high/low and average across S&P sectors

25
25/ Corporate earnings growth across indices and S&P 500 sectors
