Understanding Funding Rate Why funding is positive or negative? Why...

exitpump@exitpumpBTC
15 views
Apr 25, 2025
~1 min read
Advertisement
1
Understanding Funding Rate
Why funding is positive or negative? Why it increases or decreases?
Let's break it down.
The funding rate is a periodic payment exchanged between traders who hold long and short positions in perpetual futures contracts. It is designed to ensure that the contract price stays close to the underlying asset's spot price.
Funding in trading usually is combined with Open Interest and I recommend checking out my post about it if you haven't -
I won't go into details of every CEX's funding design, you can dig into them on their websites if you want.
I made an illustrated picture with explanations and descriptions where you can see Price, Funding and Open Interest charts in order to understand how change in Funding actually happens. Enjoy!
If you want to learn more about orderflow and trade execution based on Funding and OI, feel free to join my Discord for more: discord.gg/mGPMcFVTRe

Why funding is positive or negative? Why it increases or decreases?
Let's break it down.
The funding rate is a periodic payment exchanged between traders who hold long and short positions in perpetual futures contracts. It is designed to ensure that the contract price stays close to the underlying asset's spot price.
Funding in trading usually is combined with Open Interest and I recommend checking out my post about it if you haven't -
I won't go into details of every CEX's funding design, you can dig into them on their websites if you want.
I made an illustrated picture with explanations and descriptions where you can see Price, Funding and Open Interest charts in order to understand how change in Funding actually happens. Enjoy!
If you want to learn more about orderflow and trade execution based on Funding and OI, feel free to join my Discord for more: discord.gg/mGPMcFVTRe
exitpump@exitpumpBTC
Understanding Open Interest (OI)
Why OI Increases? Who’s Aggressive? Who’s Passive?
Let's break it down.
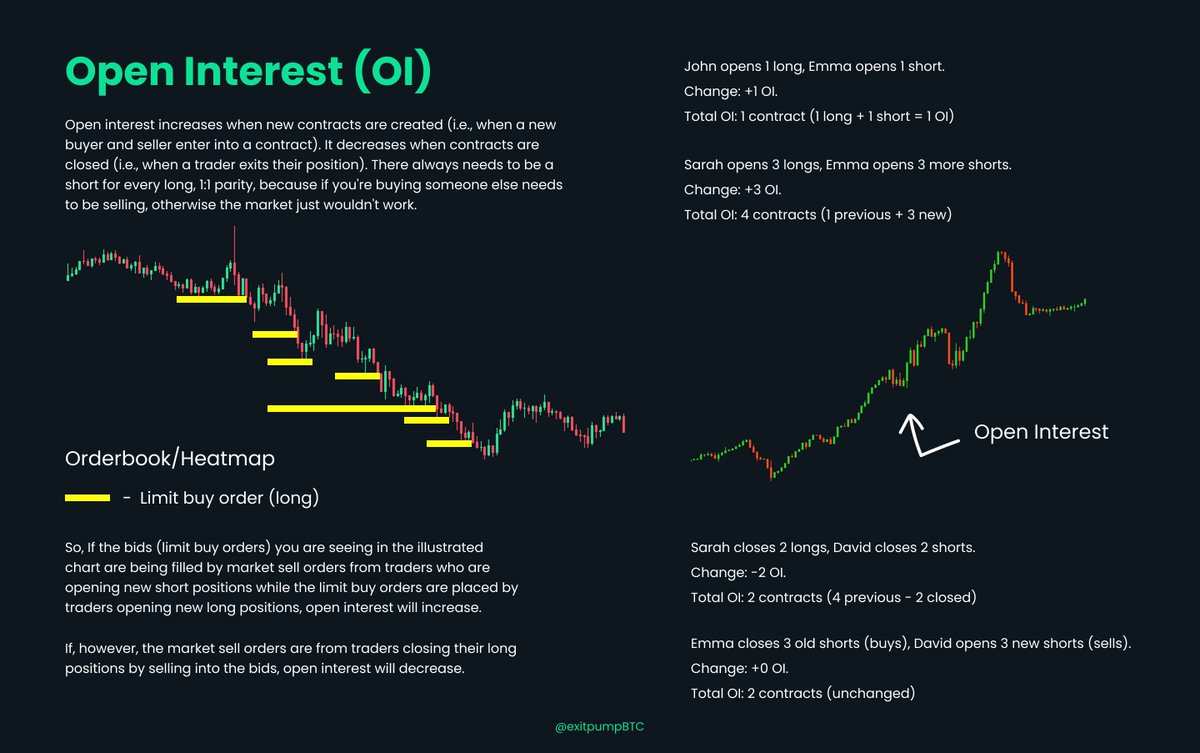
OI represents the total number of open contracts (futures/options) in the market. But, there is a big misconception. When OI increases, it DOESN’T mean only longs are entering. For every new long, there’s a new short.
Simply, when you chose market order and hit a red button you are an aggressive short, when you chose market order hit a green button you are an aggressive long.
Aggressive Longs → Market buys into passive limit sell orders
Aggressive Shorts → Market sells into passive limit buy orders
Passive Liquidity → Sitting limit orders absorbing the aggressors
📈 OI Up + Price Up → Longs are the aggressors, shorts are passive
📉 OI Up + Price Down → Shorts are the aggressors, longs are passive
📊 OI Up + No Major Price Move → Heavy battle, liquidity absorbing
Watching OI alone isn’t enough—tape & order book matter.
I made an illustrated picture with descriptions where you can see an Orderbook/Heatmap and Open Interest charts side by side in order to understand how increase in OI actually happens. Enjoy!
If you want to learn more about orderflow and dive into my trading using OI and Orderbook, feel free to join my Discord for more: discord.gg/mGPMcFVTRe
Why OI Increases? Who’s Aggressive? Who’s Passive?
Let's break it down.
OI represents the total number of open contracts (futures/options) in the market. But, there is a big misconception. When OI increases, it DOESN’T mean only longs are entering. For every new long, there’s a new short.
Simply, when you chose market order and hit a red button you are an aggressive short, when you chose market order hit a green button you are an aggressive long.
Aggressive Longs → Market buys into passive limit sell orders
Aggressive Shorts → Market sells into passive limit buy orders
Passive Liquidity → Sitting limit orders absorbing the aggressors
📈 OI Up + Price Up → Longs are the aggressors, shorts are passive
📉 OI Up + Price Down → Shorts are the aggressors, longs are passive
📊 OI Up + No Major Price Move → Heavy battle, liquidity absorbing
Watching OI alone isn’t enough—tape & order book matter.
I made an illustrated picture with descriptions where you can see an Orderbook/Heatmap and Open Interest charts side by side in order to understand how increase in OI actually happens. Enjoy!
If you want to learn more about orderflow and dive into my trading using OI and Orderbook, feel free to join my Discord for more: discord.gg/mGPMcFVTRe