I spent years struggling to execute properly. Here are my favoured...

Luckshury@Luckshuryy
24 views
Apr 23, 2025
~4 min read
Advertisement
1
I spent years struggling to execute properly.
Here are my favoured entry patterns for intra-day trades.
Entry patterns - a complete thread 🧵
Here are my favoured entry patterns for intra-day trades.
Entry patterns - a complete thread 🧵
2
Structure Change
I use range charts in my trading career to reduce the noise found in time-based charts when tracking structure.
The range chart you choose depends on your asset. For BTC/USDT, I use the following:
- 500
- 750
- 1000
- 1500
- 2000
- 2500
The specific range depends on current volatility, aiming to see a new range candle printing every 2-5 minutes.
If you are using a time-based chart, I highly suggest the Williams Fractal Indicator to identify swing highs/lows.
More important is how to execute from a structure change. I only trade a structure change if the new major pivot created from it meets the following criteria:
- No poor high/low (a buying/selling tail)
- A spike in volume
- Preferably not within the London session
- Has seen general market aggression.
here is an example using range chart ↓
I use range charts in my trading career to reduce the noise found in time-based charts when tracking structure.
The range chart you choose depends on your asset. For BTC/USDT, I use the following:
- 500
- 750
- 1000
- 1500
- 2000
- 2500
The specific range depends on current volatility, aiming to see a new range candle printing every 2-5 minutes.
If you are using a time-based chart, I highly suggest the Williams Fractal Indicator to identify swing highs/lows.
More important is how to execute from a structure change. I only trade a structure change if the new major pivot created from it meets the following criteria:
- No poor high/low (a buying/selling tail)
- A spike in volume
- Preferably not within the London session
- Has seen general market aggression.
here is an example using range chart ↓
3
Trapped traders
To identify trapped traders, which comes through a combination of both open interest + delta.
Recognising trapped traders inherently comes through new positions opening, thus an increase in open interest.
Using lower time frames such as 5m or 15m, I identify candles in which see new positions opening with coinciding delta. For example:
at lows → positive oi + negative delta = new shorts
at highs → positive oi + positive delta = new longs
Once these candles are identified (at key POIs), I'm then looking for the point/level at which those candles are pushed offside. As once offside, those then-trapped positions would provide fuel for a reversal (closing out their positions).
A candle close or volume acceptance beyond that level is then when I would execute for a reversal trade ↓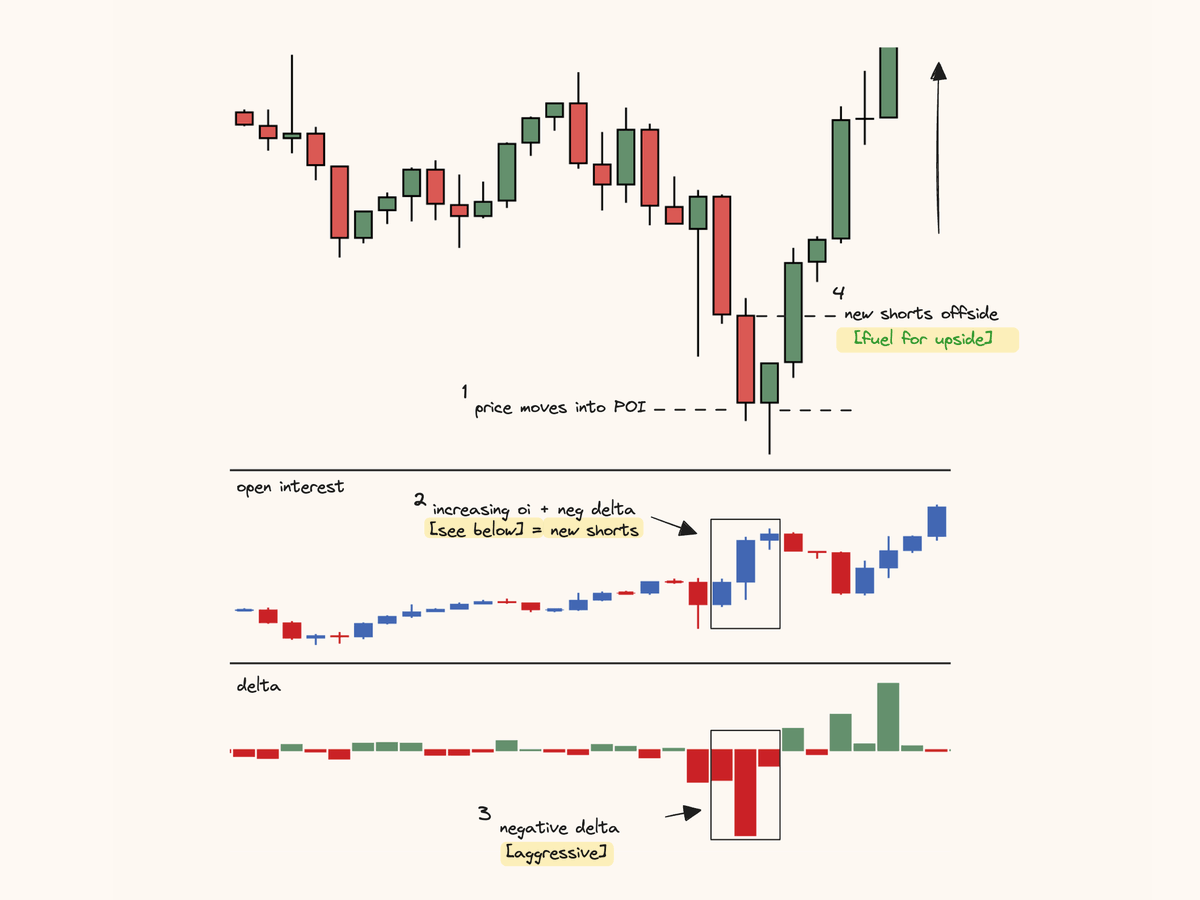
To identify trapped traders, which comes through a combination of both open interest + delta.
Recognising trapped traders inherently comes through new positions opening, thus an increase in open interest.
Using lower time frames such as 5m or 15m, I identify candles in which see new positions opening with coinciding delta. For example:
at lows → positive oi + negative delta = new shorts
at highs → positive oi + positive delta = new longs
Once these candles are identified (at key POIs), I'm then looking for the point/level at which those candles are pushed offside. As once offside, those then-trapped positions would provide fuel for a reversal (closing out their positions).
A candle close or volume acceptance beyond that level is then when I would execute for a reversal trade ↓
4
Round number liquidity
For Bitcoin, this would be every 1k increment; 60k, 61k, 62k etc. Placing emphasis on the big 10k increment numbers [50k, 60k, 70k].
These levels when untested for a period of time [hours - days] will generate stops above/below them, as well as potential breakout traders beyond their break.
These round numbers also prevent me from taking certain trades:
In many cases, price fronts run these round numbers by a few dollars. This is not where I want to execute. I will wait for a round number to be run through before looking for a reversal rather than executing when the price has front run.
Round numbers from my perspective work best when there are other levels of confluence at the same zone such as - 30m npoc, daily opens etc.
When price runs through these levels, my best executions from these levels are when I see new traders trading the breakout above/below the number.
By nature you will always have stops hit at these levels [oi decrease] but more favoured is seeing excessive traders attempting a breakout before being trapped. That is what offers my favourite setup ↓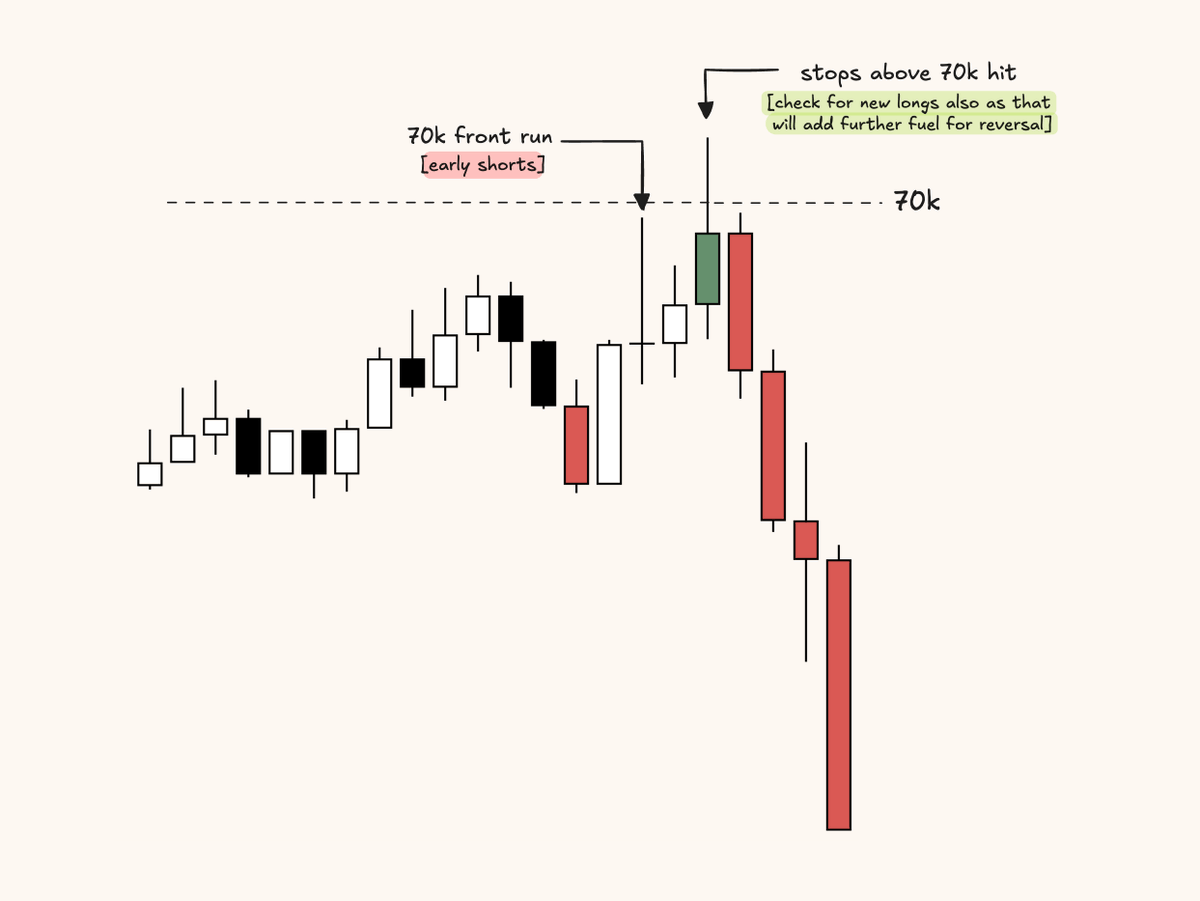
For Bitcoin, this would be every 1k increment; 60k, 61k, 62k etc. Placing emphasis on the big 10k increment numbers [50k, 60k, 70k].
These levels when untested for a period of time [hours - days] will generate stops above/below them, as well as potential breakout traders beyond their break.
These round numbers also prevent me from taking certain trades:
In many cases, price fronts run these round numbers by a few dollars. This is not where I want to execute. I will wait for a round number to be run through before looking for a reversal rather than executing when the price has front run.
Round numbers from my perspective work best when there are other levels of confluence at the same zone such as - 30m npoc, daily opens etc.
When price runs through these levels, my best executions from these levels are when I see new traders trading the breakout above/below the number.
By nature you will always have stops hit at these levels [oi decrease] but more favoured is seeing excessive traders attempting a breakout before being trapped. That is what offers my favourite setup ↓
5
Internal liquidity sweeps
Most commonly, I've seen people look for runs of liquidity in the most obvious regions. For me, monitoring internally from obvious pivots is where my best "sfp" or "liquidity" trades occur.
I use my indicator - pivotal moments [see pinned post on profile]
To identify internal swing pivots, I am mostly looking for consecutive pivots to be run which would have people's stops ran on mainly the 15m and 1h time frame.
These internal pivots catch a lot of traders off guard as most are not looking for them, and are much more prone trapped traders.
Executing from these points is as simple as a swing failure pattern at the furthest away internal pivot once they have been ran.
Note - I do not have to see consecutive internal pivots hit [although preferred] is not a must and there are some single internal pivots that will provide the same setup.
Looking for the execution, I'm using 5m/15m to look for spikes in volume, trapped traders [discussed above] & liquidations.
Example ↓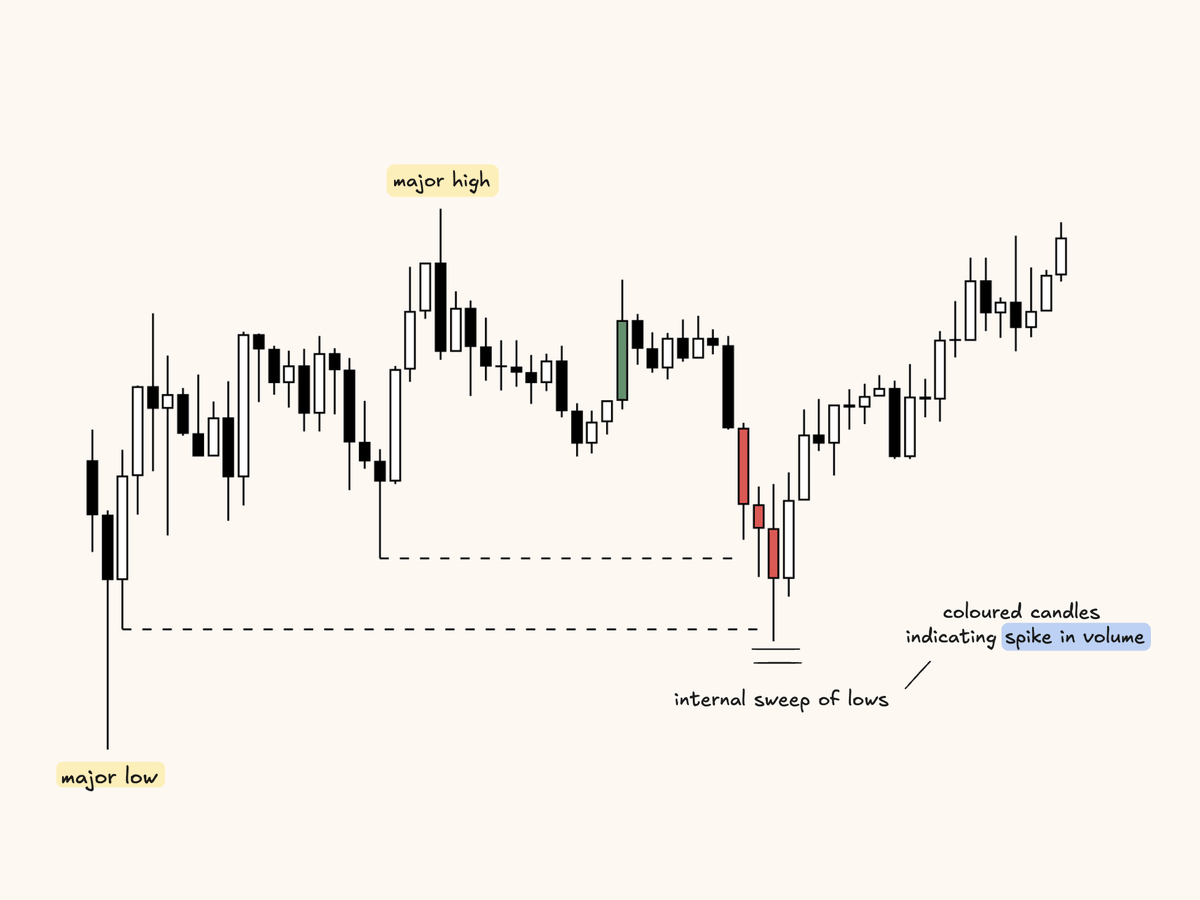
Most commonly, I've seen people look for runs of liquidity in the most obvious regions. For me, monitoring internally from obvious pivots is where my best "sfp" or "liquidity" trades occur.
I use my indicator - pivotal moments [see pinned post on profile]
To identify internal swing pivots, I am mostly looking for consecutive pivots to be run which would have people's stops ran on mainly the 15m and 1h time frame.
These internal pivots catch a lot of traders off guard as most are not looking for them, and are much more prone trapped traders.
Executing from these points is as simple as a swing failure pattern at the furthest away internal pivot once they have been ran.
Note - I do not have to see consecutive internal pivots hit [although preferred] is not a must and there are some single internal pivots that will provide the same setup.
Looking for the execution, I'm using 5m/15m to look for spikes in volume, trapped traders [discussed above] & liquidations.
Example ↓
6
If you found this useful be sure to like the original post and check my pinned post in my profile, for everything I have to offer [it is all free] this includes:
- footprint/tpo templates
- tradingview indicators list
- newsletter
- videos [yt]
thank you again.
- footprint/tpo templates
- tradingview indicators list
- newsletter
- videos [yt]
thank you again.