I've studied and researched reversals a lot, finding they often...

Luckshury@Luckshuryy
28 views
Apr 23, 2025
~3 min read
Advertisement
1
I've studied and researched reversals a lot, finding they often stem from peak local aggression.
[indicators & settings included]
Market Aggression [reversals] - a thread 🧵
[indicators & settings included]
Market Aggression [reversals] - a thread 🧵
2
Relative Volume
tracked using relative volume candles, I look for clear spikes in local volume to determine peak aggression.
important to note that this is most useful for me when monitoring specific POIs only, not just buying/selling off random prints.
Relative volume info:
> 1.8
> 2
> 3.5
threshold calculation type - relative
relative length - 25
indicator - volume suite by Leviathan
tracked using relative volume candles, I look for clear spikes in local volume to determine peak aggression.
important to note that this is most useful for me when monitoring specific POIs only, not just buying/selling off random prints.
Relative volume info:
> 1.8
> 2
> 3.5
threshold calculation type - relative
relative length - 25
indicator - volume suite by Leviathan
3
High volume + small price change
if coinciding with the correct delta, it is a clear sign of absorption.
if price sees little movement with excessive volume, it indicates opposing buyers/sellers are getting orders filled, due to significant volume not being able to push price much further.
settings/info:
V > 2.4
P < 1
indicator - volume suite by Leviathan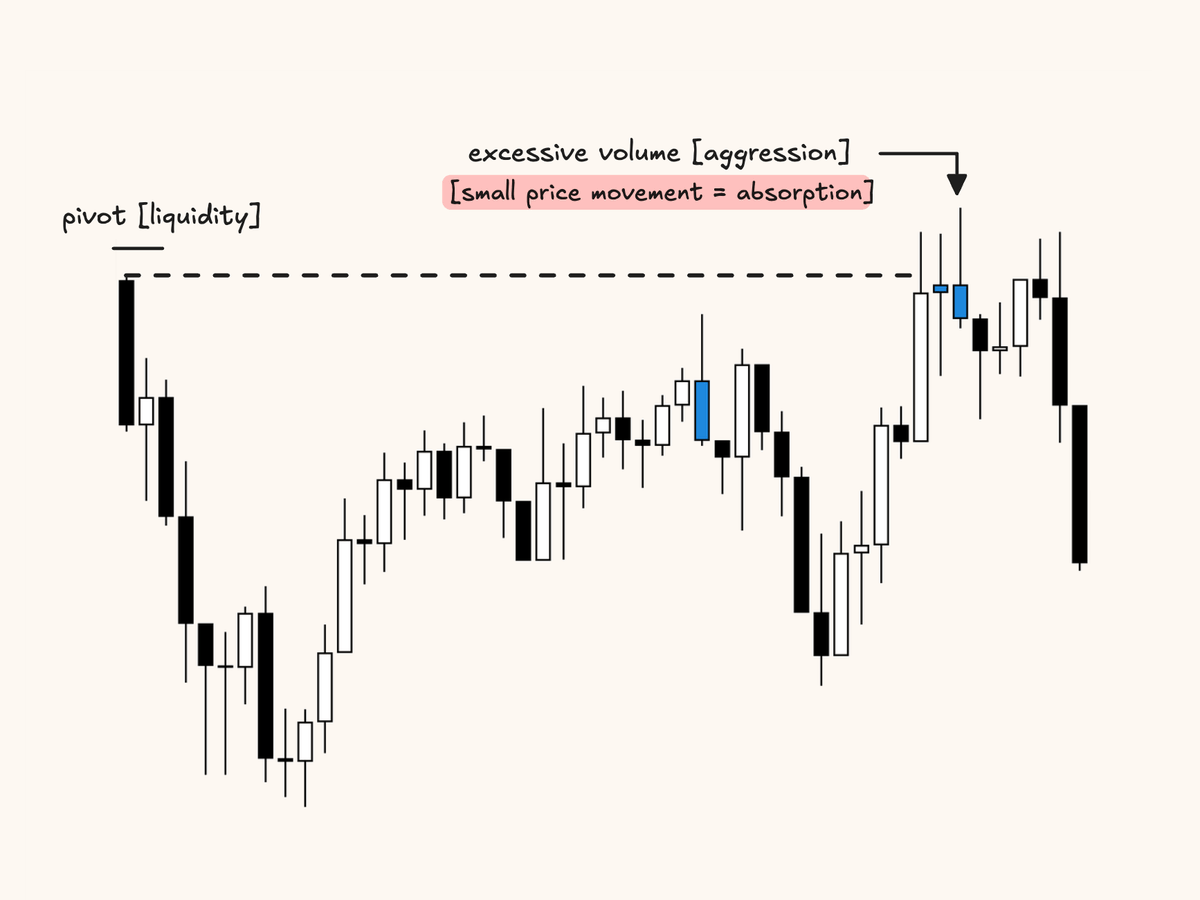
if coinciding with the correct delta, it is a clear sign of absorption.
if price sees little movement with excessive volume, it indicates opposing buyers/sellers are getting orders filled, due to significant volume not being able to push price much further.
settings/info:
V > 2.4
P < 1
indicator - volume suite by Leviathan
4
Market order bubbles
This indicator is based on buy/sell volume and prints according to the aggressiveness of the former.
Using this alongside the relative volume provides a great way to identify spikes in volume and coinciding delta related to large buy/sell volume spikes.
info/settings:
small bubble - 1.6
medium bubble - 2.7
large bubble - 4.3
all other settings - default
indicator - market order bubbles by Leviathan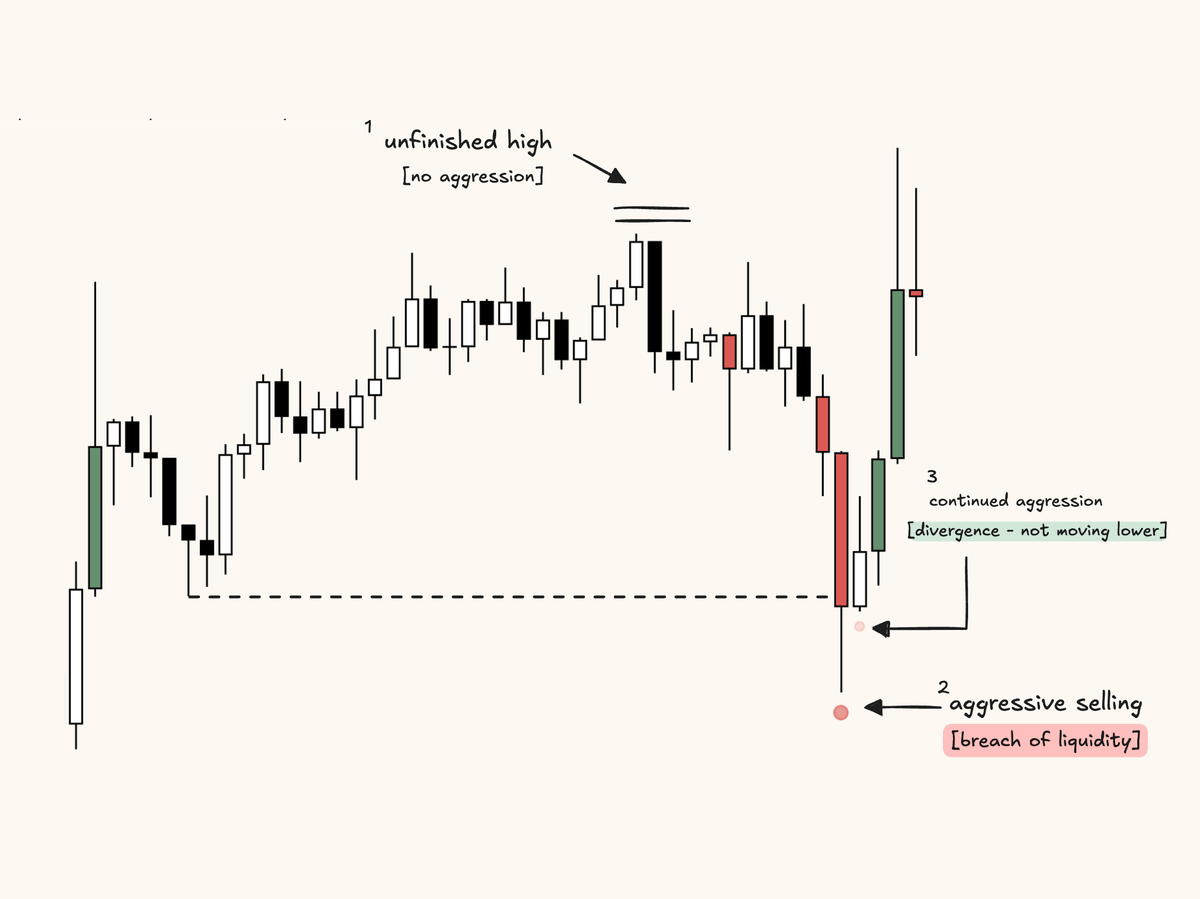
This indicator is based on buy/sell volume and prints according to the aggressiveness of the former.
Using this alongside the relative volume provides a great way to identify spikes in volume and coinciding delta related to large buy/sell volume spikes.
info/settings:
small bubble - 1.6
medium bubble - 2.7
large bubble - 4.3
all other settings - default
indicator - market order bubbles by Leviathan
5
Open interest spikes
Most people look for OI flushes; however, this generally leads to a large wick forming, which my stats show has a high probability of being filled, making it less effective for reversals.
Looking for spikes in open interest will help me identify a large number of new positions. To determine if these new positions may be trapped, I must look at the delta.
For example, at highs, I want to see a spike in OI with positive delta, and at lows, a spike in OI with negative delta.
info:
threshold multiplier - 8
indicator - open interest suite [aggregated] by Leviathan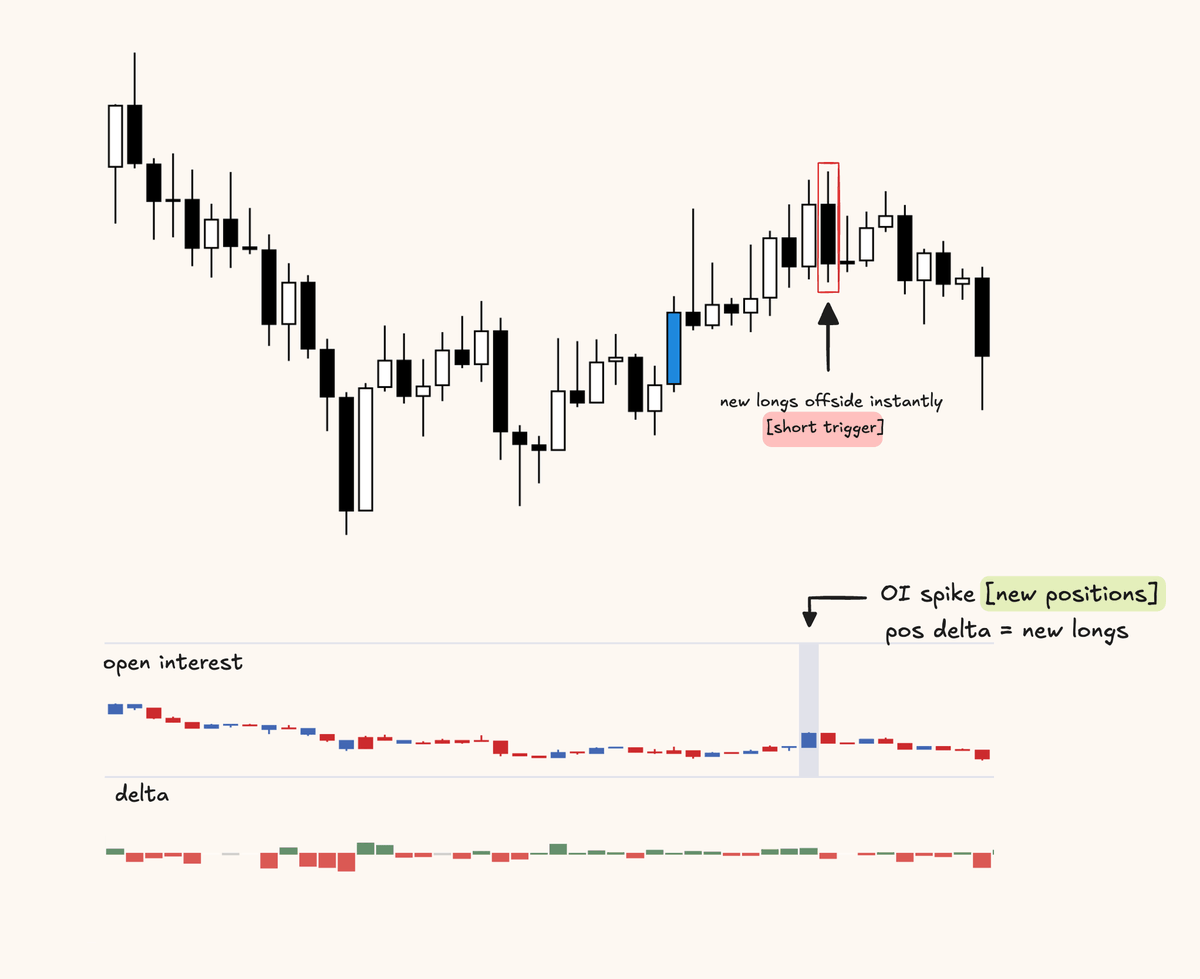
Most people look for OI flushes; however, this generally leads to a large wick forming, which my stats show has a high probability of being filled, making it less effective for reversals.
Looking for spikes in open interest will help me identify a large number of new positions. To determine if these new positions may be trapped, I must look at the delta.
For example, at highs, I want to see a spike in OI with positive delta, and at lows, a spike in OI with negative delta.
info:
threshold multiplier - 8
indicator - open interest suite [aggregated] by Leviathan
6
Liquidations
Markets pivot from significant pain points.
Aggregated liquidations from exchanges like bybit and binance clearly indicate spikes in participants being REKT.
I look for spikes in liquidations relative to local pivots. The below example shows this and can help identify unfinished pivots from more complete ones.
tool - @VeloData [aggregated liquidations]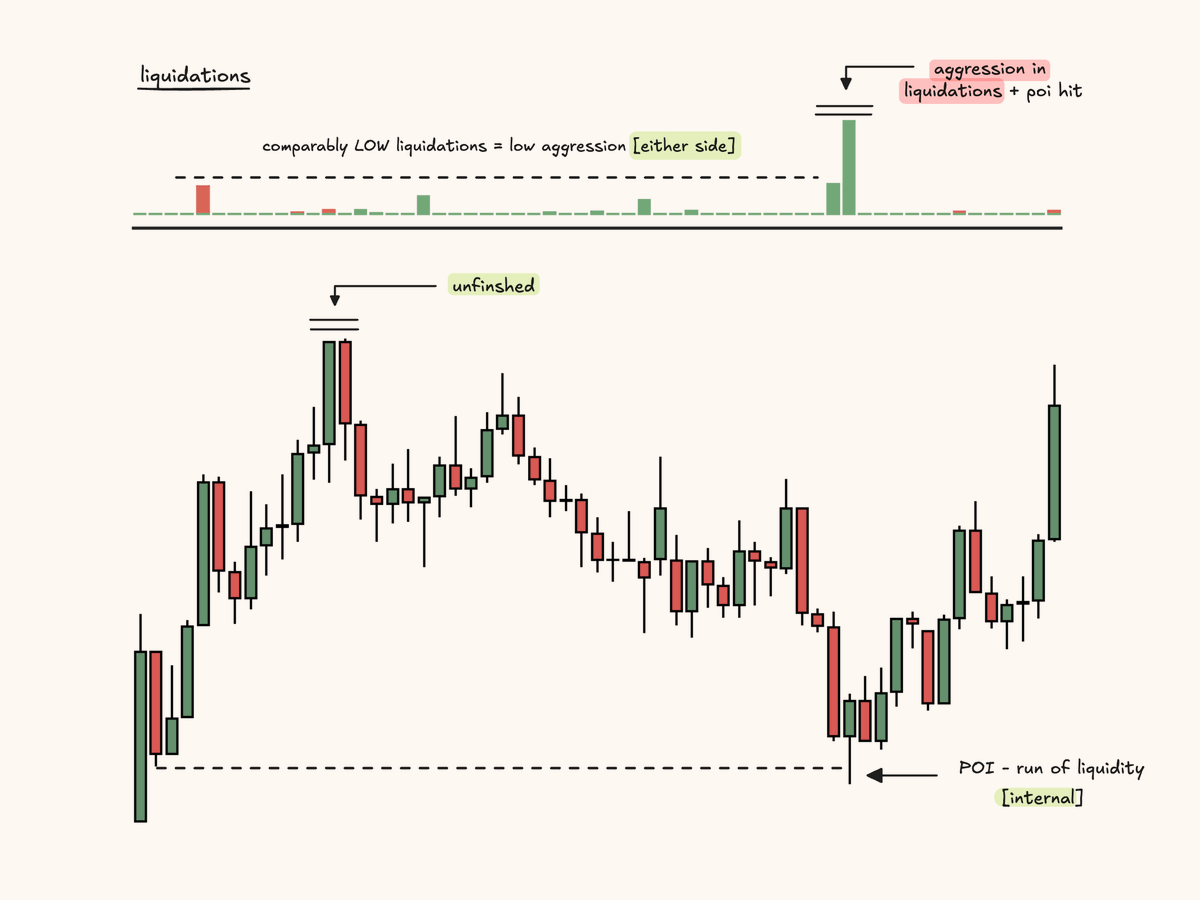
Markets pivot from significant pain points.
Aggregated liquidations from exchanges like bybit and binance clearly indicate spikes in participants being REKT.
I look for spikes in liquidations relative to local pivots. The below example shows this and can help identify unfinished pivots from more complete ones.
tool - @VeloData [aggregated liquidations]
7
Big player participation [footprint]
One of my favoured options is using the footprint to filter out larger orders.
By aggregating footprint data with Bybit and Binance, it provides a clear view of when large orders are matched on the opposing side.
If at a key POI i see excessive large blocks appearing via this footprint it is an indication of larger orders being absorbed, purely by looking at the large order filter via the footprint.
Once large blocks are caught offside it can trigger a reversal trade. Below is an example of this.
tool - @ExochartsC [aggregated footprint / TPO & more]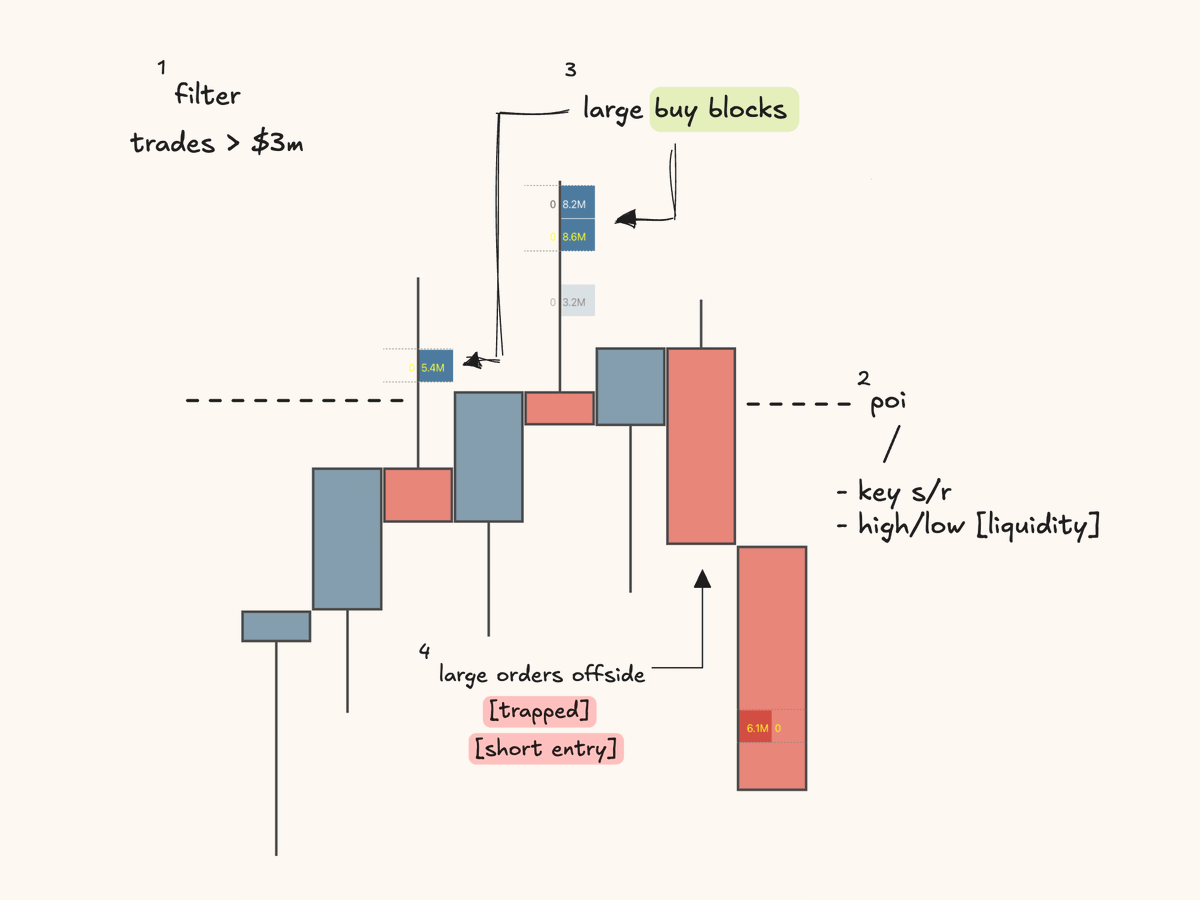
One of my favoured options is using the footprint to filter out larger orders.
By aggregating footprint data with Bybit and Binance, it provides a clear view of when large orders are matched on the opposing side.
If at a key POI i see excessive large blocks appearing via this footprint it is an indication of larger orders being absorbed, purely by looking at the large order filter via the footprint.
Once large blocks are caught offside it can trigger a reversal trade. Below is an example of this.
tool - @ExochartsC [aggregated footprint / TPO & more]
8
All official links to indicators and sites I use are in the pinned post on my profile.
If you found this useful, please like the first post of this thread; it is greatly appreciated.
All likes will be entered for a chance to win 3x 6-month subscriptions to Exocharts.
Winners announced next week.
If you found this useful, please like the first post of this thread; it is greatly appreciated.
All likes will be entered for a chance to win 3x 6-month subscriptions to Exocharts.
Winners announced next week.