Identifying market conditions for day trading: This is just how I...

Luckshury@Luckshuryy
4 views
Sep 30, 2024
~3 min read
1
Identifying market conditions for day trading:
This is just how I do it whilst also incorporating things into my routine.
One-time framing (daily timeframe)
Is where price makes continuous higher lows without breaking any of the previous candle lows. An example of this can be found on $BTC from February 6, 2024, to February 12, 2024. I only consider price to be one-time framing if the candles continue to print in the direction of the trend (price cannot print a red candle in an uptrend to be one-time framing and vice versa).
If price is one-time framing on the daily, I instantly view the day ahead with that as my directional bias. In these cases, my thought process is that there is no need to fight against an ongoing strong trend, which is what one-time framing is...a strong directional trend.
Session high/low of day
If price is NOT one-time framing, then I will look at this.
Which session has put in the current high & low of the day?
Generally speaking on most days I do not expect to see London session (6am - 12pm UTC) to put in either the daily high or low. Therefore, if I start my day by seeing London has put in either one of those pivots, I would look to target that for directional bias, as i know the probabilities of that getting taken out that day is high.
Daily & session poor highs/lows
Poor highs & lows from my testing are great for revisits during the day, in particular session poor highs/lows.
New York session (12pm-8pm UTC), if it creates a developing session poor high/low or finishes the session with a poor high/low, it is a form of directional bias for me. Whether I'm in a trade – in which case I will manage that trade with the poor high/low of NY session in mind – or I'm looking to enter a new trade with that poor high/low as a target.
Daily poor high/low: In these cases I create stats on them being revisited within 3 days rather than that ongoing developing day as i would with sessions. The best chance for a daily poor high/low to be hit (as of my testing & data), would be the following/next day.
Market structure (from open)
I am foremost a day trader, taking trades that last a day at most.
Tracking from the daily open makes the most sense in this case, as I want to know what price is doing and is likely to do for that day going forward.
I track using typically either the 15m or 30m, both are great for tracking from the open and can be done so via the market profile, it also allows for me to remove ALL noise from previous days and just focus on what price is doing that day.
High hit rate levels
This is something really personalised to myself, however they are levels in which reset each day and have a % chance each day of being hit.
An example of this would be session gap fills (I have a thread on this), essentially creating custom session gaps and calculating the % chance that they fill within a certain period of time. This is just 1 of many examples as to how I create high hit rate levels to target for directional bias.
Confluence
The one factor which does not need confluence in my system is the one-time framing; if price is one-time framing regardless of other factors, I will look for price to continue in that direction (I learned this the hard way)
Other than that, ideally having 2 directional bias confluences pointing in the same direction is ideal to be looking for a trade that targets those zones.
Hopefully this makes sense as to how I actually come up and decide which direction I will be trading on any given trading day; it's a crucial part of my daily routine.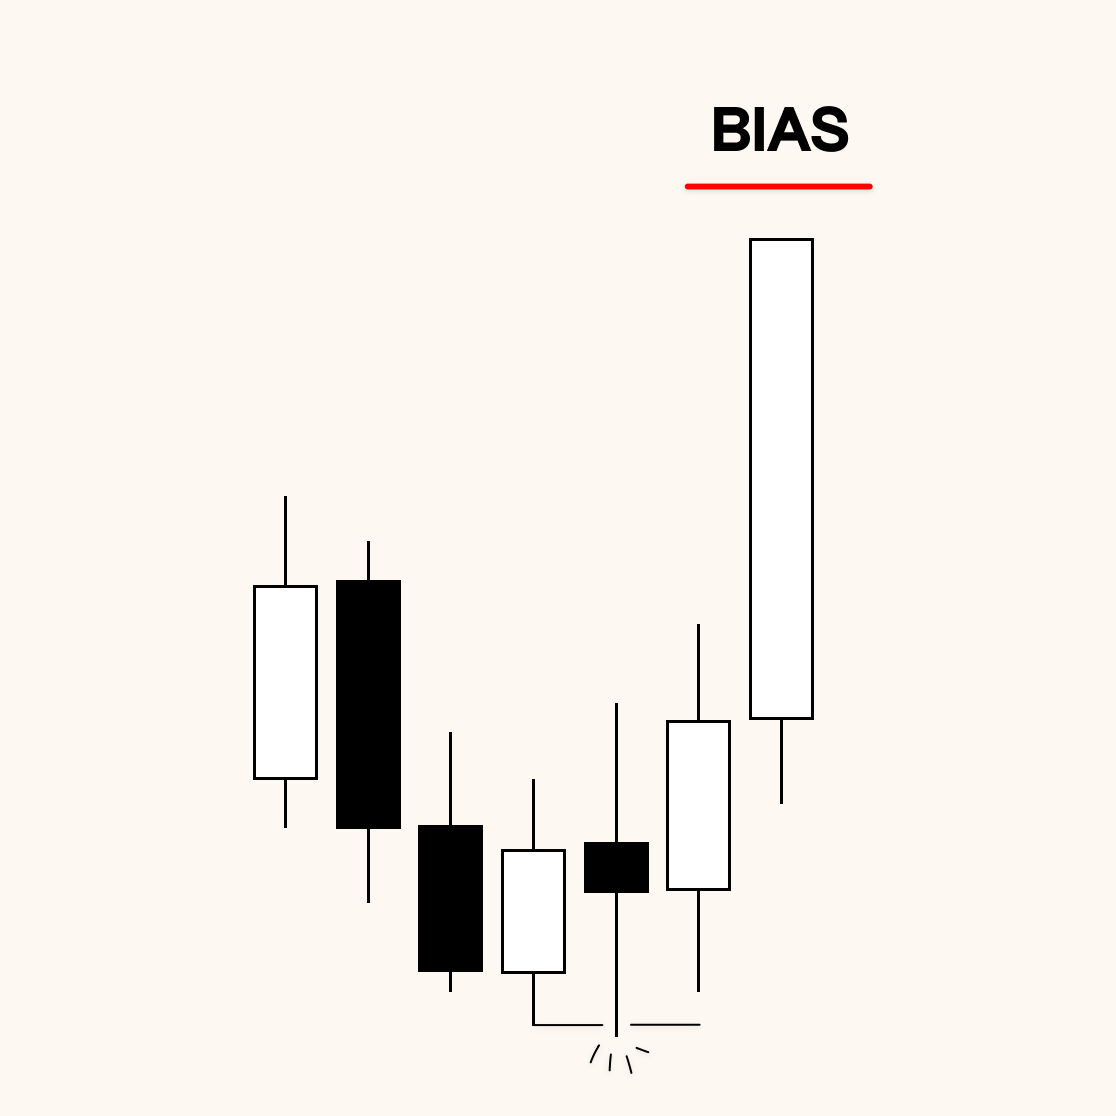
This is just how I do it whilst also incorporating things into my routine.
One-time framing (daily timeframe)
Is where price makes continuous higher lows without breaking any of the previous candle lows. An example of this can be found on $BTC from February 6, 2024, to February 12, 2024. I only consider price to be one-time framing if the candles continue to print in the direction of the trend (price cannot print a red candle in an uptrend to be one-time framing and vice versa).
If price is one-time framing on the daily, I instantly view the day ahead with that as my directional bias. In these cases, my thought process is that there is no need to fight against an ongoing strong trend, which is what one-time framing is...a strong directional trend.
Session high/low of day
If price is NOT one-time framing, then I will look at this.
Which session has put in the current high & low of the day?
Generally speaking on most days I do not expect to see London session (6am - 12pm UTC) to put in either the daily high or low. Therefore, if I start my day by seeing London has put in either one of those pivots, I would look to target that for directional bias, as i know the probabilities of that getting taken out that day is high.
Daily & session poor highs/lows
Poor highs & lows from my testing are great for revisits during the day, in particular session poor highs/lows.
New York session (12pm-8pm UTC), if it creates a developing session poor high/low or finishes the session with a poor high/low, it is a form of directional bias for me. Whether I'm in a trade – in which case I will manage that trade with the poor high/low of NY session in mind – or I'm looking to enter a new trade with that poor high/low as a target.
Daily poor high/low: In these cases I create stats on them being revisited within 3 days rather than that ongoing developing day as i would with sessions. The best chance for a daily poor high/low to be hit (as of my testing & data), would be the following/next day.
Market structure (from open)
I am foremost a day trader, taking trades that last a day at most.
Tracking from the daily open makes the most sense in this case, as I want to know what price is doing and is likely to do for that day going forward.
I track using typically either the 15m or 30m, both are great for tracking from the open and can be done so via the market profile, it also allows for me to remove ALL noise from previous days and just focus on what price is doing that day.
High hit rate levels
This is something really personalised to myself, however they are levels in which reset each day and have a % chance each day of being hit.
An example of this would be session gap fills (I have a thread on this), essentially creating custom session gaps and calculating the % chance that they fill within a certain period of time. This is just 1 of many examples as to how I create high hit rate levels to target for directional bias.
Confluence
The one factor which does not need confluence in my system is the one-time framing; if price is one-time framing regardless of other factors, I will look for price to continue in that direction (I learned this the hard way)
Other than that, ideally having 2 directional bias confluences pointing in the same direction is ideal to be looking for a trade that targets those zones.
Hopefully this makes sense as to how I actually come up and decide which direction I will be trading on any given trading day; it's a crucial part of my daily routine.