How to draw an overview figure? Creating a clear and informative...

Jia-Bin Huang@jbhuang0604
9 views
Oct 15, 2025
~2 min read
Advertisement
1
How to draw an overview figure?
Creating a clear and informative overview figure is crucial for visualizing HOW your method works.
But how? 🤔 Let's deep dive with 🐢
Creating a clear and informative overview figure is crucial for visualizing HOW your method works.
But how? 🤔 Let's deep dive with 🐢
2
*Choose the right level of abstraction*
Simplifying complex procedures helps improve clarity.
Ask yourself what the key message you want to convey. Don't overwhelm your readers with unnecessary details.
Simplifying complex procedures helps improve clarity.
Ask yourself what the key message you want to convey. Don't overwhelm your readers with unnecessary details.
3
*Think in terms of computational graph*
Most methods process some INPUT with some COMPUTATION to produce some OUTPUT.
Visualize the flow with a "computational graph".
• Nodes: Computation
• Arrows: Dependency
Most methods process some INPUT with some COMPUTATION to produce some OUTPUT.
Visualize the flow with a "computational graph".
• Nodes: Computation
• Arrows: Dependency
4
*Use an example*
While your overview figure illustrates an *abstract* workflow, visualizing the intermediate variables/data with a *concrete* example makes it easier to understand.
While your overview figure illustrates an *abstract* workflow, visualizing the intermediate variables/data with a *concrete* example makes it easier to understand.
5
*Follow the left-to-right direction*
Most languages read from left to right. ⏩⏩
Following this direction makes your figure "read" better.
Most languages read from left to right. ⏩⏩
Following this direction makes your figure "read" better.
6
*Apply formatting strategically*
Be purposeful when you use formatting to highlight similarity, grouping, and contrast.
Make sure that you don't overdo it.
Be purposeful when you use formatting to highlight similarity, grouping, and contrast.
Make sure that you don't overdo it.
7
*Use proper font size*
Use consistent and clearly visible font size.
Don't make your overview figure a vision test. 🧐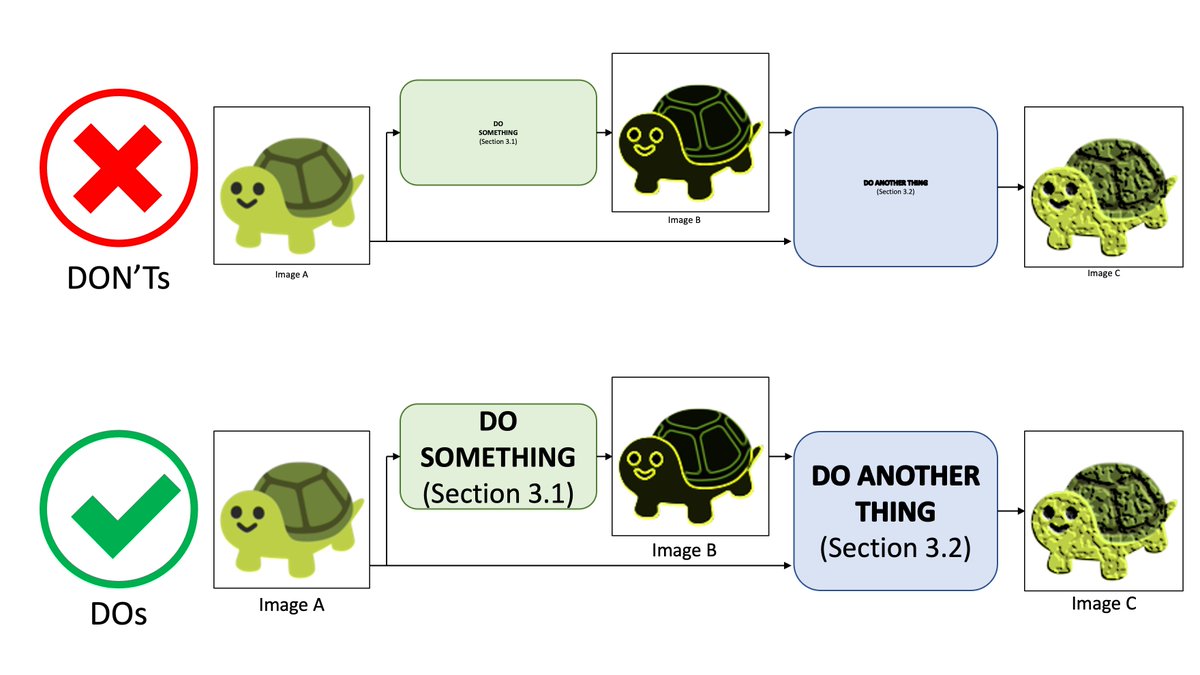
Use consistent and clearly visible font size.
Don't make your overview figure a vision test. 🧐
8
*Use consistent formatting*
• Capitalize the first character for the first word?
• Capitalize the first character for every word?
• All caps?
• All lowercase?
Pick one and stick with it.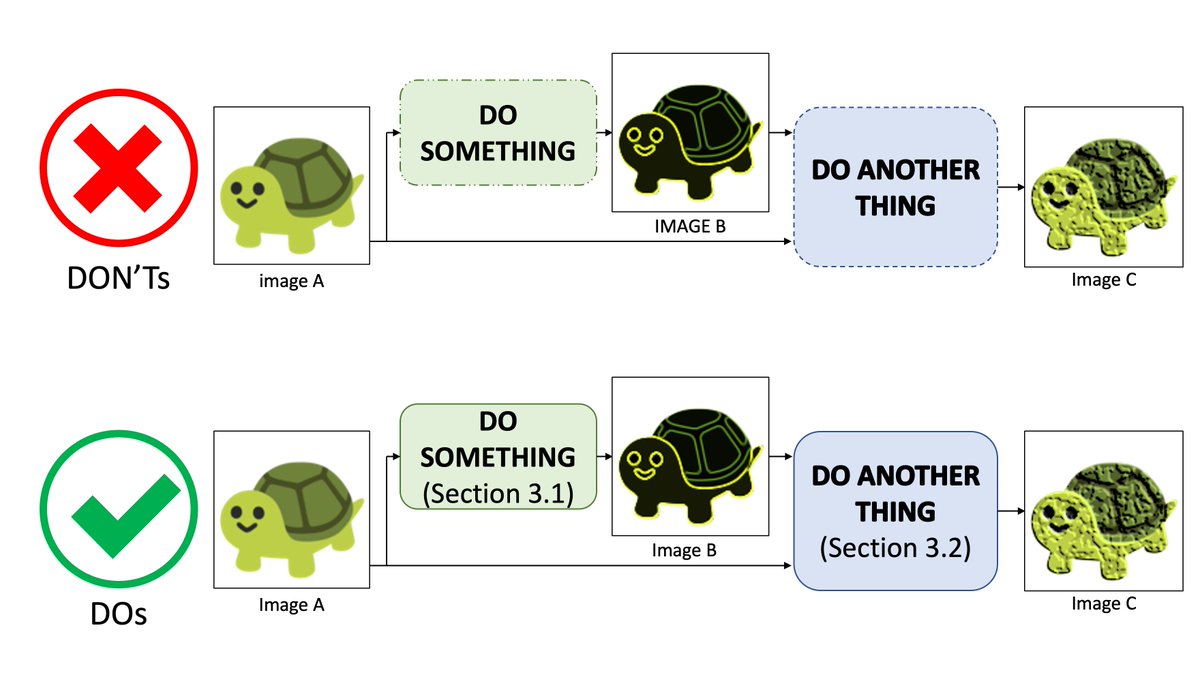
• Capitalize the first character for the first word?
• Capitalize the first character for every word?
• All caps?
• All lowercase?
Pick one and stick with it.
9
*Align everything*
Tiny bits of misalignment here and there distract your readers. (Look how annoying this looks like!)
Align the positions, spacing, and sizes.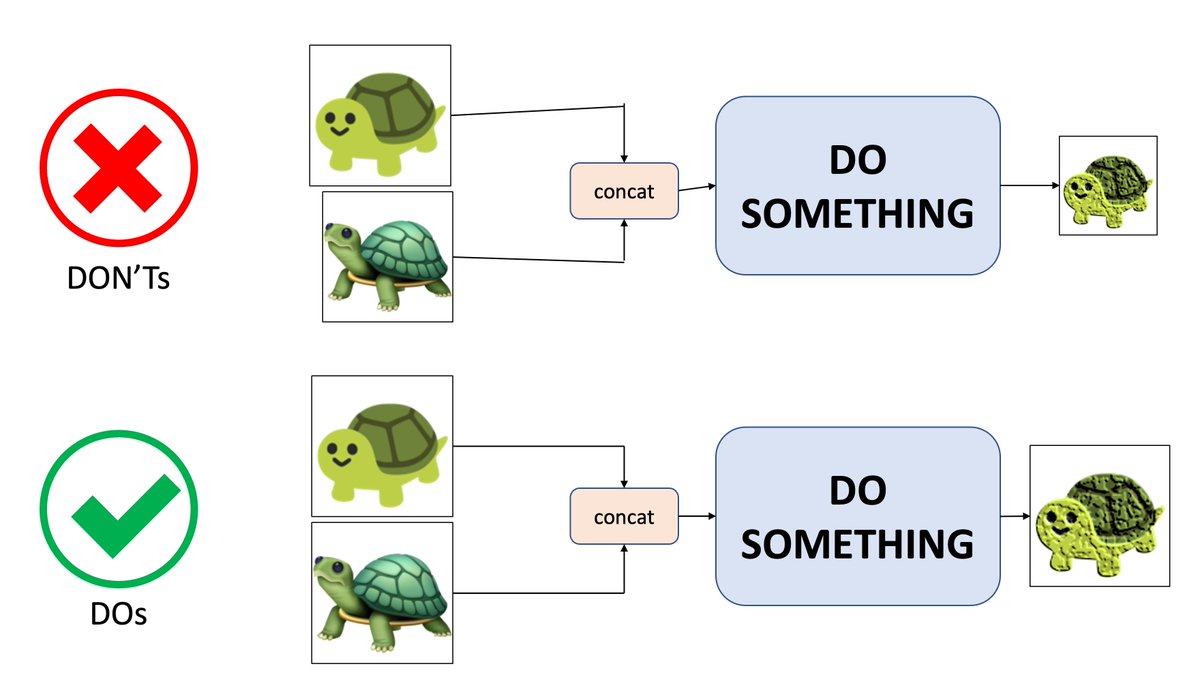
Tiny bits of misalignment here and there distract your readers. (Look how annoying this looks like!)
Align the positions, spacing, and sizes.
10
*Use consistent styles*
Put the label
• below the image?
• above the image?
• within the image?
• to the right of the image?
Pick one and be consistent.
Put the label
• below the image?
• above the image?
• within the image?
• to the right of the image?
Pick one and be consistent.
11
*Provide a roadmap for the paper*
Add labels for sections, equations, and figures to provide a roadmap for the paper.
Add labels for sections, equations, and figures to provide a roadmap for the paper.
12
*Be explicit about the dependency/computation*
When you merge two arrows, it's unclear what happened there.
Did you add/subtract/multiply/max/min/some other things? Or does the DO SOMETHING module take two separate inputs? Make it explicit!
When you merge two arrows, it's unclear what happened there.
Did you add/subtract/multiply/max/min/some other things? Or does the DO SOMETHING module take two separate inputs? Make it explicit!
13
*Avoid overloading the interface*
Here the DO SOMETHING module takes only ONE single input.
The example above obscures this process (it looks like the module takes two inputs simultaneously).
Here the DO SOMETHING module takes only ONE single input.
The example above obscures this process (it looks like the module takes two inputs simultaneously).
14
I am not a designer, but these tips have helped me improve the clarity of my work.
Hope you will find them useful as well!
What are your favorite tips for creating an overview figure?
Hope you will find them useful as well!
What are your favorite tips for creating an overview figure?