How to present a line plot? Line plots are effective for describing...

Jia-Bin Huang@jbhuang0604
11 views
Oct 09, 2025
~1 min read
Advertisement
1
How to present a line plot?
Line plots are effective for describing the relationship between two variables of interests.
Unfortunately, most junior students would simply copy&paste the figure from the paper in their talk and cause much confusion. 😕
Let's break it down ... 🧵
Line plots are effective for describing the relationship between two variables of interests.
Unfortunately, most junior students would simply copy&paste the figure from the paper in their talk and cause much confusion. 😕
Let's break it down ... 🧵
2
*Step 1: Describe the X-axis*
❌ Show the entire plot. Waaaay too much to unpack.
✅ Show *only the X-Y axis* (no lines yet!). Describe what factors you SUSPECT have an impact on the Y-axis, e.g., time, model complexity, dataset size.
❌ Show the entire plot. Waaaay too much to unpack.
✅ Show *only the X-Y axis* (no lines yet!). Describe what factors you SUSPECT have an impact on the Y-axis, e.g., time, model complexity, dataset size.
3
*Step 2: Describe the Y-axis*
Tell us ...
👉 what are we measuring?
👉 is higher or lower number better?
👉 what would a perfect/oracle curve look like?
Tell us ...
👉 what are we measuring?
👉 is higher or lower number better?
👉 what would a perfect/oracle curve look like?
4
*Step 3: Set the stage*
Now that you explain what the plot is about, set the stage by showing the results from
✅ naïve results (e.g., random guess)
✅ baseline methods
✅ competing approaches
Now that you explain what the plot is about, set the stage by showing the results from
✅ naïve results (e.g., random guess)
✅ baseline methods
✅ competing approaches
5
*Step 5: Compare*
Don't just show, relate and compare!
Examples:
⏩ (fixed Y-axis) Ours achieves the same accuracy but runs 100x faster / uses only 5% of the training data
⏩ (fixed X-axis) Under the same model, ours reduces the errors by 30%.
Don't just show, relate and compare!
Examples:
⏩ (fixed Y-axis) Ours achieves the same accuracy but runs 100x faster / uses only 5% of the training data
⏩ (fixed X-axis) Under the same model, ours reduces the errors by 30%.
6
*Step 6: Contextualize your results*
Convert the numbers to something that others can easily relate.
For example,
❌ the code runs one frame per second
✅ for a car running at 90 km/hr, by the time we process the next image, the car has move forward by 25 meters.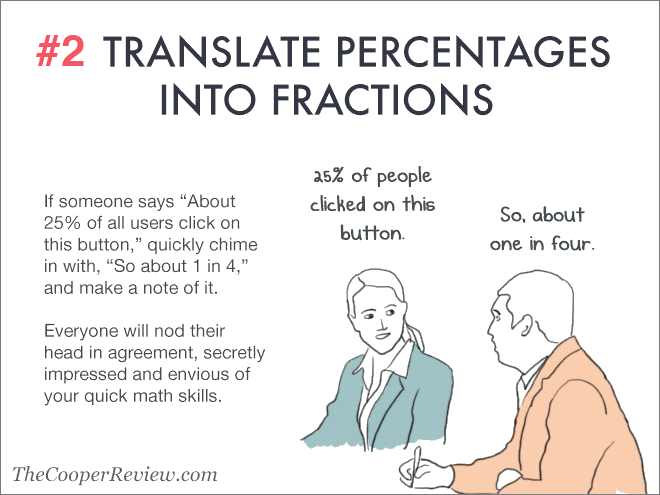
Convert the numbers to something that others can easily relate.
For example,
❌ the code runs one frame per second
✅ for a car running at 90 km/hr, by the time we process the next image, the car has move forward by 25 meters.