April 26, 1991. Today marks the 35th anniversary of the Andover,...

ChaseWithHamz@Ham_BklynWx
13 views
Apr 27, 2026
~4 min read
Advertisement
1
April 26, 1991. Today marks the 35th anniversary of the Andover, Kansas F5 tornado. At its peak, wind speeds were estimated at 268 mph, making it one of the most powerful storms ever documented.
This thread looks at the meteorological data and the historical impact of that day. 🧵👇 #Andover #KSwx
Video credit: USAF McConnell AFBov
This thread looks at the meteorological data and the historical impact of that day. 🧵👇 #Andover #KSwx
Video credit: USAF McConnell AFBov
2
• Path Length: 46 Miles (Clearwater ➡️ El Dorado Lake)
• Peak Intensity: F5 (268 mph)
• Width: Average 1/2 Mile
• Fatalities: 17 (13 at Golden Spur
Mobile Home Park)
• Damage: $300 Million total
Credit: Tornado Talk (2019) / NWS Wichita
• Peak Intensity: F5 (268 mph)
• Width: Average 1/2 Mile
• Fatalities: 17 (13 at Golden Spur
Mobile Home Park)
• Damage: $300 Million total
Credit: Tornado Talk (2019) / NWS Wichita
3
The Safety Myth: This footage became some of the most famous in weather history. While the individuals here survived, this video created a dangerous misconception.
Experts now warn that overpasses are wind tunnels that increase the risk of being struck by debris or blown out from the girders. Never seek shelter under a bridge. Warning ⚠️ 🌪️
Location: Wichita, Kansas
Video credit: KSNW-TV Wichita, Kansas
Photojournalist: Ted Lewis

Experts now warn that overpasses are wind tunnels that increase the risk of being struck by debris or blown out from the girders. Never seek shelter under a bridge. Warning ⚠️ 🌪️
Location: Wichita, Kansas
Video credit: KSNW-TV Wichita, Kansas
Photojournalist: Ted Lewis
4
Eyes on the Storm: While the studio coordinated the warnings, John Wright (Mobile 7) was in the field chasing the F5.
In the field, John Wright (Mobile 7) described a "blue-purple" sky, stating he’d never seen a storm like this.
Location: Butler County, KS
Radio: KFDI-FM (John Wright)
In the field, John Wright (Mobile 7) described a "blue-purple" sky, stating he’d never seen a storm like this.
Location: Butler County, KS
Radio: KFDI-FM (John Wright)
5
The Warning: "This is about as classic a hook echo as you're ever going to see."
Watch Mike Smith on KSNW-TV as he tracks the violent F5 in real-time. He identifies the massive debris signature on radar and issues a direct, desperate warning: the tornado is moving into Andover and hitting the mobile home park.
Location: Wichita/Andover, KS
Video Credit: KSNW-TV (Mike Smith)


Watch Mike Smith on KSNW-TV as he tracks the violent F5 in real-time. He identifies the massive debris signature on radar and issues a direct, desperate warning: the tornado is moving into Andover and hitting the mobile home park.
Location: Wichita/Andover, KS
Video Credit: KSNW-TV (Mike Smith)
6
Surface Analysis - April 26, 1991, 1300 UTC)
The Setup: At 1300 UTC, a low pressure system was in SW Nebraska with a dry line extending into West Texas.
Dew points in the 60s covered Kansas, while air behind the line dropped into the 20s. A warm front stretched SE from the low through Kansas.
The Key: The dry line slowed in the afternoon because winds behind it backed to the south/ southwest instead of staying westerly. This stalled the boundary and kept the moisture locked in place for the Andover F5.
Data: NOAA/NWS Disaster Survey Report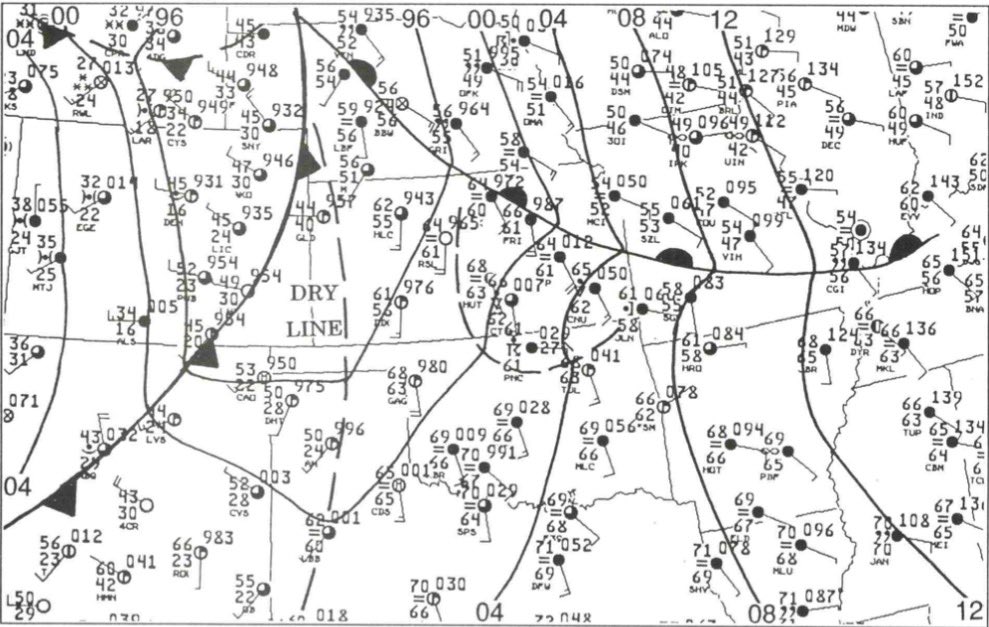
The Setup: At 1300 UTC, a low pressure system was in SW Nebraska with a dry line extending into West Texas.
Dew points in the 60s covered Kansas, while air behind the line dropped into the 20s. A warm front stretched SE from the low through Kansas.
The Key: The dry line slowed in the afternoon because winds behind it backed to the south/ southwest instead of staying westerly. This stalled the boundary and kept the moisture locked in place for the Andover F5.
Data: NOAA/NWS Disaster Survey Report
7
The Atmospheric Profile:
These figures from the NWS report detail the specific environmental conditions at 0000 UTC during the peak of the outbreak.
• Instability (Fig. 10): The Topeka (TOP) sounding recorded CAPE values > 4,000 J/kg. The report identifies this as an extremely unstable environment.
• The Inversion: A significant capping inversion was noted at the 800 mb level.
The NWS states this "cap" inhibited early convection, allowing for greater energy accumulation.
• Kinematics (Fig. 11): The Topeka hodograph showed strong clockwise curvature. The calculated Storm-Relative Helicity (SRH) was 388 m^2/s^2, well above the threshold for violent tornadoes.
• The Dryline: Surface analysis showed a sharp moisture gradient, with dewpoints crashing from 65°F to 30°F across the boundary.
NWS Conclusion:
The report concludes that the combination of 4,000+ CAPE and 388 SRH provided the scientific evidence that a "major, violent outbreak was clearly evident" through the available sounding and hodograph data.
Data: NOAA / NWS Natural Disaster Survey Report

These figures from the NWS report detail the specific environmental conditions at 0000 UTC during the peak of the outbreak.
• Instability (Fig. 10): The Topeka (TOP) sounding recorded CAPE values > 4,000 J/kg. The report identifies this as an extremely unstable environment.
• The Inversion: A significant capping inversion was noted at the 800 mb level.
The NWS states this "cap" inhibited early convection, allowing for greater energy accumulation.
• Kinematics (Fig. 11): The Topeka hodograph showed strong clockwise curvature. The calculated Storm-Relative Helicity (SRH) was 388 m^2/s^2, well above the threshold for violent tornadoes.
• The Dryline: Surface analysis showed a sharp moisture gradient, with dewpoints crashing from 65°F to 30°F across the boundary.
NWS Conclusion:
The report concludes that the combination of 4,000+ CAPE and 388 SRH provided the scientific evidence that a "major, violent outbreak was clearly evident" through the available sounding and hodograph data.
Data: NOAA / NWS Natural Disaster Survey Report
8
Satellite Evolution: The View from Space:
Figures 17a-f. Infrared imagery: Show the approach of the jet streak and the rapid generation of the convection.
Figures 18a-f. One kilometer resolution visible satellite imagery: Show the explosive development of the convection across Oklahoma and Kansas.
The Dry Punch (Figure 18e): A strong dry intrusion (dissipating clouds) can be noted on the 2330 UTC visible image just west of Andover (located by the +). This dry punch is a distinct satellite signature of severe weather.
WSO Wichita did not have any real-time satellite imagery available.
Data and Imagery: NOAA / NWS Natural
Disaster Survey Report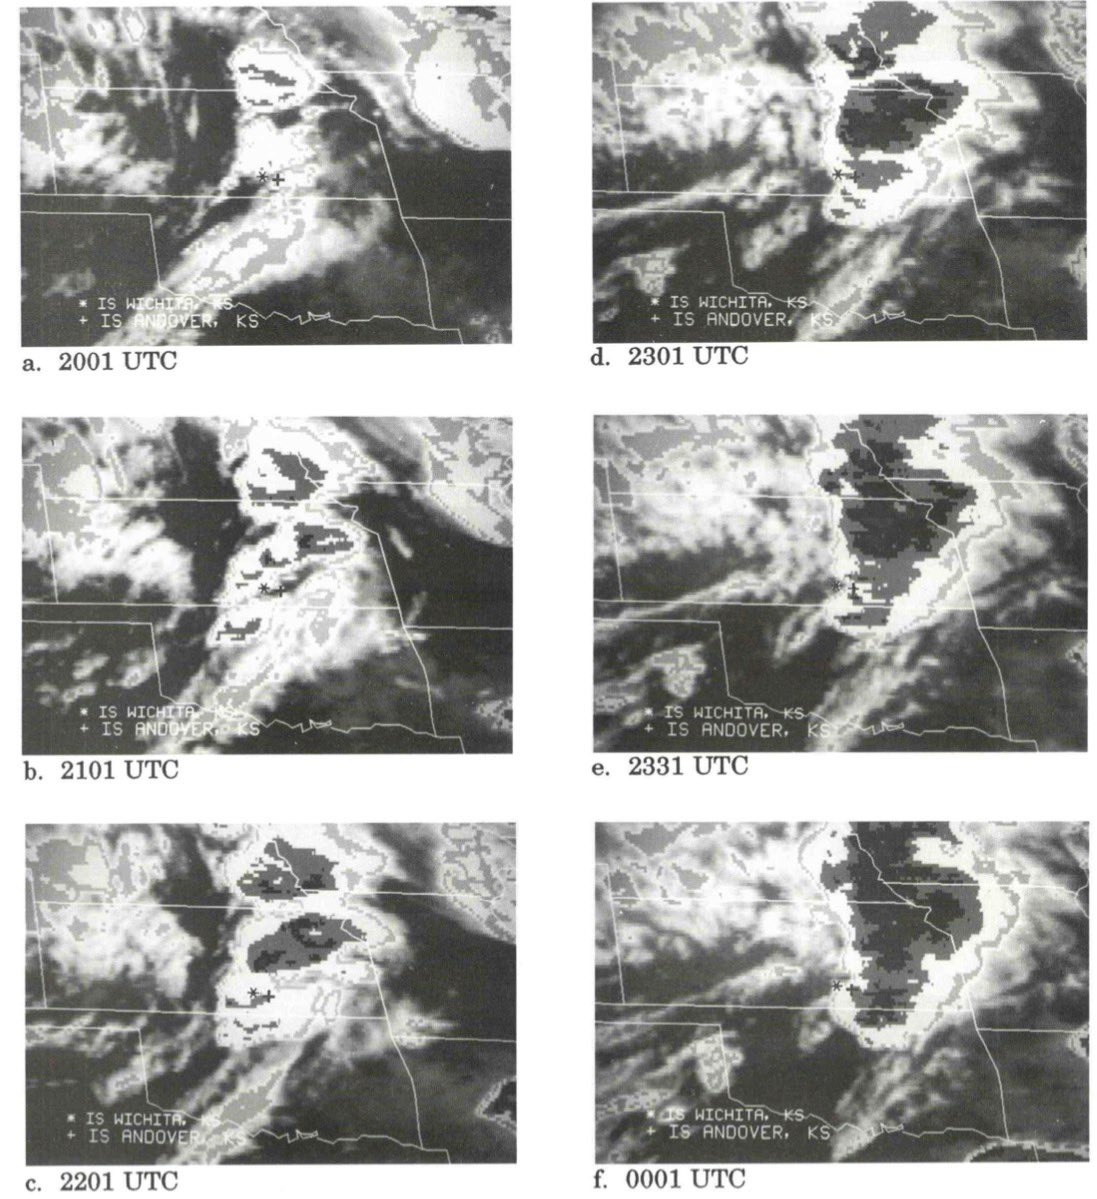

Figures 17a-f. Infrared imagery: Show the approach of the jet streak and the rapid generation of the convection.
Figures 18a-f. One kilometer resolution visible satellite imagery: Show the explosive development of the convection across Oklahoma and Kansas.
The Dry Punch (Figure 18e): A strong dry intrusion (dissipating clouds) can be noted on the 2330 UTC visible image just west of Andover (located by the +). This dry punch is a distinct satellite signature of severe weather.
WSO Wichita did not have any real-time satellite imagery available.
Data and Imagery: NOAA / NWS Natural
Disaster Survey Report
9
The Shift to Doppler Technology:
Figure 20: A color hardcopy of the WSR-88D reflectivity data from Norman, OK, at 2339 UTC, the exact time the tornado struck Andover.
The Comparison:
• WSR-57 (Wichita): The storm was lost in ground clutter. Spotters reported the tornado before the radar could even see it.
• WSR-88D (Norman): Even from a distance, the new Doppler technology detected the storm features before the tornado formed.
The Impact:
The 1991 outbreak was the ultimate proof that the National Weather Service needed to move away from 1950s tech. The WSR-88D provided a level of detail that saved lives by showing storm structures previously invisible to forecasters.
Data and Imagery: NOAA / NWS Natural Disaster Survey Report
Figure 20: A color hardcopy of the WSR-88D reflectivity data from Norman, OK, at 2339 UTC, the exact time the tornado struck Andover.
The Comparison:
• WSR-57 (Wichita): The storm was lost in ground clutter. Spotters reported the tornado before the radar could even see it.
• WSR-88D (Norman): Even from a distance, the new Doppler technology detected the storm features before the tornado formed.
The Impact:
The 1991 outbreak was the ultimate proof that the National Weather Service needed to move away from 1950s tech. The WSR-88D provided a level of detail that saved lives by showing storm structures previously invisible to forecasters.
Data and Imagery: NOAA / NWS Natural Disaster Survey Report

