Alpha on Prediction Markets: Momentum, Value, Risk. The Complete Python Guide.

What is algo trading and why it matters

Algo trading means letting code make decisions instead of gut feeling. Instead of "I think this contract will go up" you write a rule: "if the price has been rising for 14 days - buy." The computer checks this rule across thousands of contracts in seconds and doesn't get emotional.
Three key advantages:
Speed - a script scans hundreds of contracts per second. Doing it manually takes hours.
Discipline - code doesn't panic, doesn't get greedy, doesn't "wait a bit longer." Signal fires - we act.
Repeatability - you can test a strategy on historical data (backtest) before risking real money.
The process: collect data -> form a hypothesis -> test on history -> deploy. This article walks through every step.
Tools: Python and four libraries. The same ones quants at hedge funds use - just applied to a different domain.
Prediction markets
A prediction market is a platform where people buy and sell contracts on event outcomes. A contract is a yes/no question.
Example: "Will Bitcoin be above $100K by end of 2026?"
Contract at $0.77 -> the market thinks there's a 77% chance.
Buy at $0.42, event happens - you get $1, profit $0.58. Doesn't happen - you lose $0.42.
Platforms: Polymarket.

Left - how the "BTC > $100K" contract price moved over 90 days. Right - 5 contracts at once.
Why does algo trading work here? Prediction markets are young. Fewer participants, more inefficiencies. If you can estimate probabilities better than the crowd and automate it - you have an edge.
Setup
pip install pandas numpy matplotlib scipy

import pandas as pd
import numpy as np
import matplotlib.pyplot as plt
from scipy import stats
pandas - data tables, numpy - number crunching, matplotlib - charts, scipy - statistics.
Data and returns
Data = contract price history, price = probability. From prices we calculate returns: how much a contract gained or lost per day.
# Real Polymarket markets (March 2026), simulated price history.
# For live data: curl "https://gamma-api.polymarket.com/markets?limit=20"

np.random.seed(42)

def simulate_contract(start_price, drift, vol, days=90):
    changes = np.random.normal(drift, vol, days)
    path = start_price + np.cumsum(changes)
    return np.clip(path, 0.02, 0.98)

contracts = pd.DataFrame({
    'date': pd.date_range('2025-12-30', periods=90, freq='D'),
    'BTC>100K_2026':     simulate_contract(0.60, 0.002, 0.015),
    'Fed_cut_Jun26':     simulate_contract(0.55, 0.002, 0.012),
    'US_recession_26':   simulate_contract(0.22, 0.001, 0.018),
    'Trump_2028':        simulate_contract(0.30, 0.0005, 0.014),
    'Iran_ceasefire':    simulate_contract(0.40, -0.002, 0.022),
})
contracts.set_index('date', inplace=True)

# Daily returns
returns = contracts.pct_change().dropna()

# Log returns (more accurate for large swings)
log_returns = np.log(contracts / contracts.shift(1)).dropna()
Why log returns? If a contract drops from $0.50 to $0.25 (-50%), then rises back to $0.50 (+100%), the simple average says "+25%". But you're at zero. Log returns account for this.
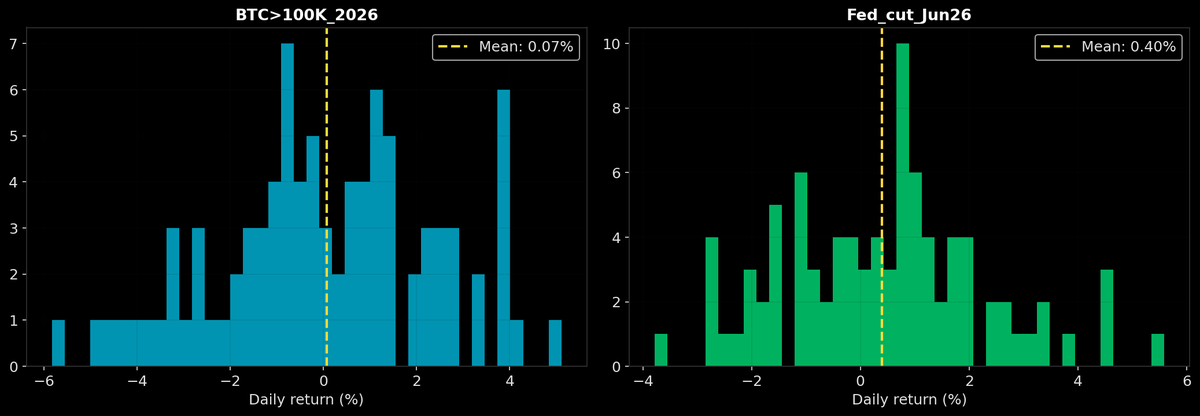
How daily returns are distributed across contracts.
Momentum: which contracts are gaining probability
Idea: if a contract has been rising - it will likely keep rising. Participants update their estimates gradually, not instantly. This creates trends.
We calculate momentum across multiple timeframes (7, 14, 30 days). Rising on all three - quality trend. Only one - might be a one-off spike.

Which contracts gained over 7 and 30 days.
Value: where the market is wrong
You have your own probability estimate. The market prices it lower - the contract is undervalued. The difference is called edge.
def value_screener(df, my_estimates):
    """
    Compares market price to your estimate.
    edge > 0 = contract is cheaper than you think.
    """
    results = pd.DataFrame()
    results['market'] = df.iloc[-1]
    results['my_est'] = my_estimates
    results['edge'] = results['my_est'] - results['market']
    return results.sort_values('edge', ascending=False)

my_estimates = pd.Series({
    'BTC>100K_2026': 0.82,
    'Fed_cut_Jun26': 0.75,
    'US_recession_26': 0.35,
    'Trump_2028': 0.30,
    'Iran_ceasefire': 0.40,
})

print(value_screener(contracts, my_estimates))
Edge of 0.18 means: market says 64%, I think 82%. If I'm right - I pocket the difference.
Risk and return
High returns are meaningless if you lose half your money along the way. Always measure risk.
def risk_metrics(ret, annual_factor=365):
    m = {}
    m['ann_return'] = ret.mean() * annual_factor
    m['ann_vol'] = ret.std() * np.sqrt(annual_factor)
    m['sharpe'] = m['ann_return'] / m['ann_vol'] if m['ann_vol'] != 0 else 0

    cum = (1 + ret).cumprod()
    m['max_dd'] = ((cum - cum.cummax()) / cum.cummax()).min()
    return m

for col in returns.columns:
    m = risk_metrics(returns[col])
    print(f"{col}: return={m['ann_return']:.0%}  vol={m['ann_vol']:.0%}  sharpe={m['sharpe']:.2f}  maxDD={m['max_dd']:.0%}")
Sharpe ratio - return divided by volatility. > 1 means the return is worth the risk. > 2 is excellent.
Max drawdown - largest peak-to-trough drop. -40% means at the worst point you were down 40%.

Each contract is a dot. Horizontal = risk, vertical = return.
Correlation and portfolio
Don't bet everything on one contract. If two contracts move independently (low correlation), one dropping doesn't drag the other.
correlation = returns.corr()
print(correlation)
< 0.3 — barely related, good for a portfolio. > 0.7 — move together, no diversification.

Heatmap: greener = lower correlation.
Backtest
A backtest tests your strategy on past data. Without it you're guessing. With it you're testing a hypothesis.
Logic: contract rose over 14 days - buy. Fell - sit in cash.
class MomentumBacktester:
    def __init__(self, data, lookback=14):
        self.data = data
        self.lookback = lookback

    def run(self):
        df = self.data.copy()
        df['mom'] = df.pct_change(self.lookback)
        df['pos'] = np.where(df['mom'] > 0, 1, 0)
        df['ret'] = df.iloc[:, 0].pct_change()
        df['strat'] = df['ret'] * df['pos'].shift(1)
        df['cum_hold'] = (1 + df['ret']).cumprod()
        df['cum_strat'] = (1 + df['strat']).cumprod()
        self.results = df.dropna()
        return self

    def summary(self):
        r = self.results
        print(f"Momentum: $1 -> ${r['cum_strat'].iloc[-1]:.4f}")
        print(f"Hold:     $1 -> ${r['cum_hold'].iloc[-1]:.4f}")

bt = MomentumBacktester(contracts[['BTC>100K_2026']])
bt.run().summary()
Momentum strategy vs just holding the contract
Important: backtests don't guarantee future results. This is educational material, not financial advice.
What's next
Start - connect Polymarket API, download data, build charts.
Mid - your own momentum + value screener, backtest.
Advanced - automate: script checks contracts and sends alerts.
Quant - ML for probability estimation, NLP on news.
Run it, plug in real data, and you have a working screener.
trading here: polymarket.com/?r=zostaff
my tg channel: t.me/zostaffsmartarc