IMMIGRATION FISCAL/ECONOMIC IMPACT MEGATHREAD First, the average...

Daniel Di Martino@DanielDiMartino
37 views
Dec 19, 2025
~3 min read
Advertisement
1
IMMIGRATION FISCAL/ECONOMIC IMPACT MEGATHREAD
First, the average immigrant contributes less on net to the U.S. treasury than the average native-born American throughout their working years.
However, this doesn't account for emigration.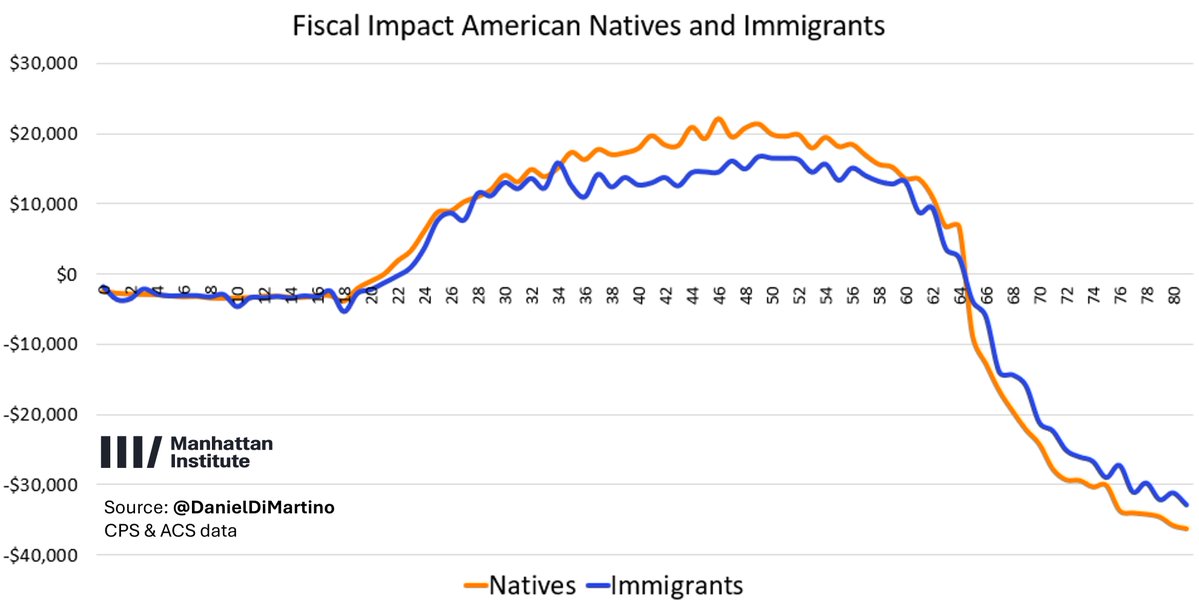
First, the average immigrant contributes less on net to the U.S. treasury than the average native-born American throughout their working years.
However, this doesn't account for emigration.
2
If we split natives by major race groups, you get what you expect.
Asians contribute the most to the federal government on average while Blacks contribute the least.
Asian Americans contribute a net 30K during their peak earnings years while Black Americans contribute only 10K.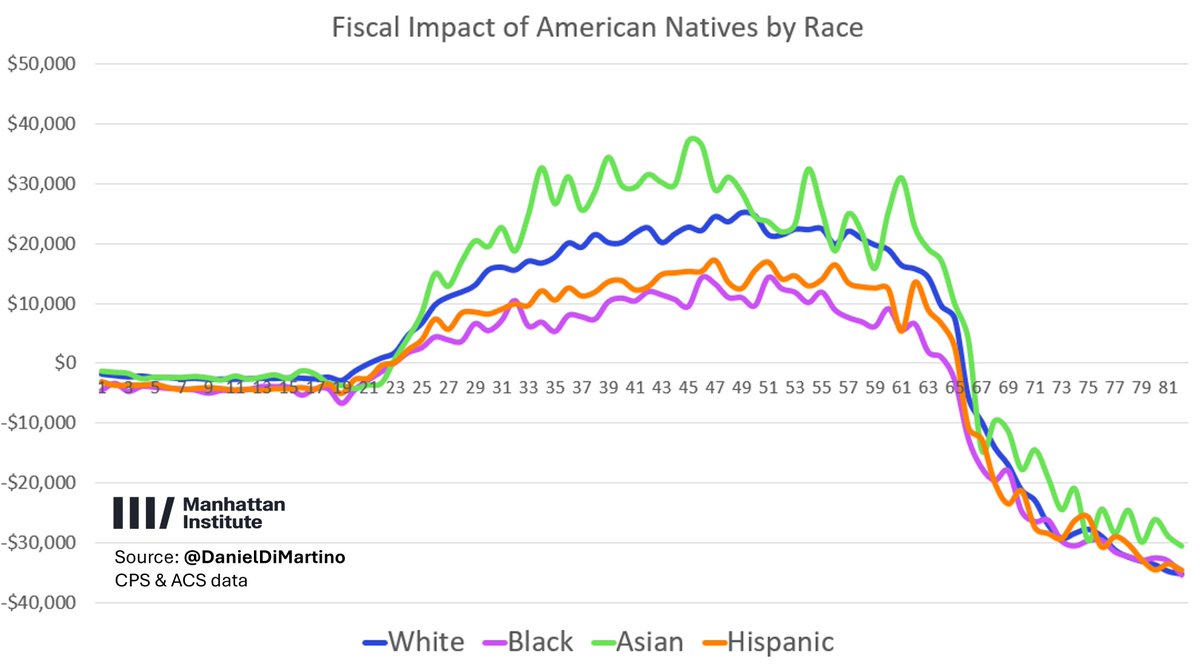
Asians contribute the most to the federal government on average while Blacks contribute the least.
Asian Americans contribute a net 30K during their peak earnings years while Black Americans contribute only 10K.
3
If we split immigrants by region of birth, we get a different picture.
Asian immigrants are just as fiscally positive as "Western" immigrants (Europeans, Australians, Canadians).
Latin Americans contribute the least fiscally.
African & Middle Easterners are in between.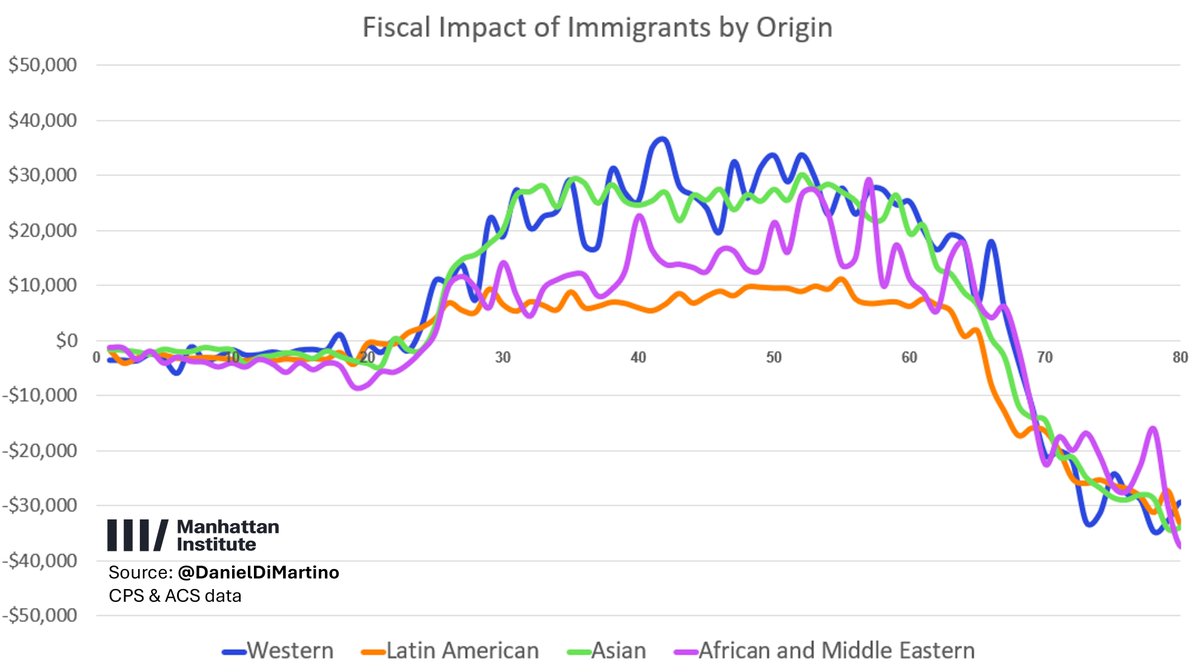
Asian immigrants are just as fiscally positive as "Western" immigrants (Europeans, Australians, Canadians).
Latin Americans contribute the least fiscally.
African & Middle Easterners are in between.
4
But this means that if we compare the average immigrant to the average native-born white person, immigrants are really driving the per-capita fiscal contribution down.

5
What if we compare U.S. racial groups to their corresponding world region of origin? We get convergence for all but Latin Americans.
Western immigrants contribute slightly more than native-born Whites.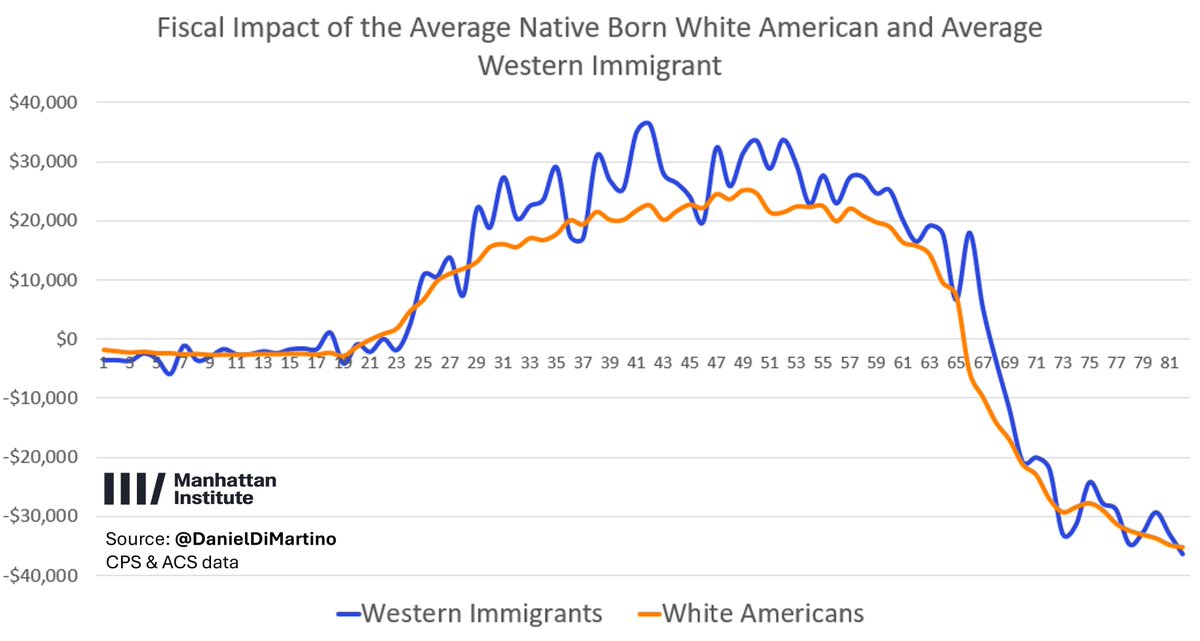
Western immigrants contribute slightly more than native-born Whites.
6
Asian immigrants contribute similarly to Asian native born citizens.

7
African immigrants contribute somewhat more than native-born Blacks but not as much more as I expected before starting to do this research.

8
And surprisingly, Latin American immigrants contribute continually less than native-born Hispanics.

9
The Latin American low fiscal contribution is driven by Mexicans, who earn much less and thus pay less in taxes than their South American counterparts.
South Americans in turn do contribute more than native-born Hispanics.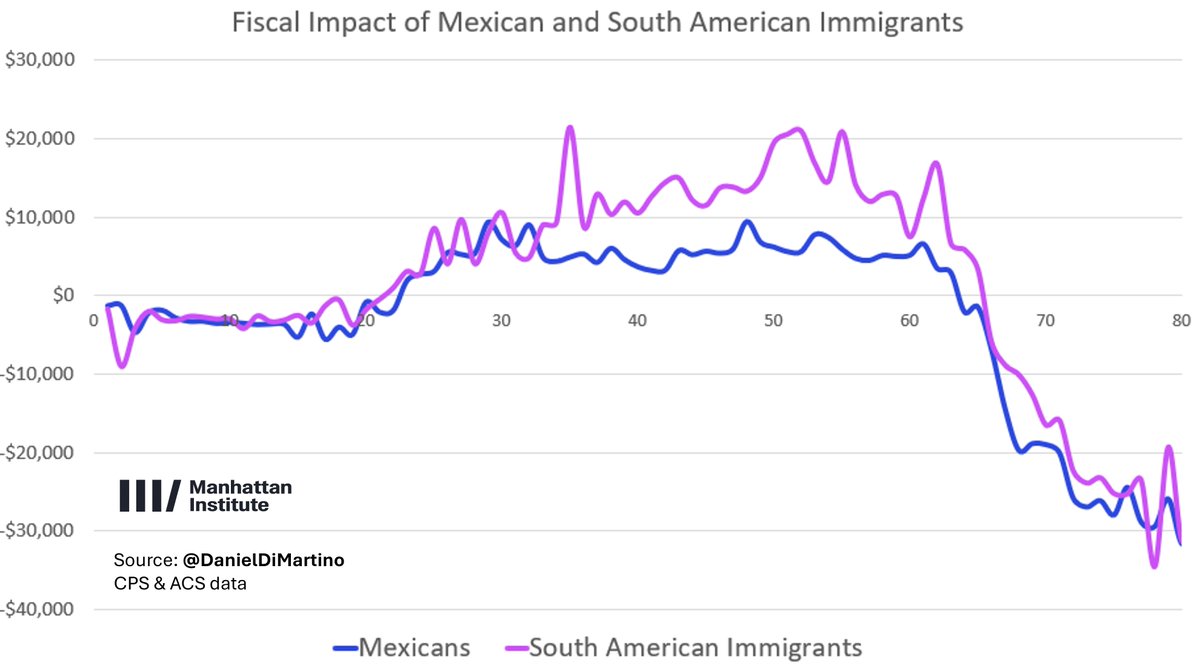
South Americans in turn do contribute more than native-born Hispanics.
10
If we add Central Americans and Caribbean immigrants, we see that Central Americans contribute similarly to Mexicans while immigrants from the Caribbean are in between South Americans and Mexicans.
The largest Caribbean groups are Cubans, Dominicans, and Haitians.
The largest Caribbean groups are Cubans, Dominicans, and Haitians.
11
What if we split Asians by country of origin?
We find that Indians are the most economically positive major country of origin group.
Chinese immigrants contribute similarly to other Asian immigrants but Indians rise above the pack.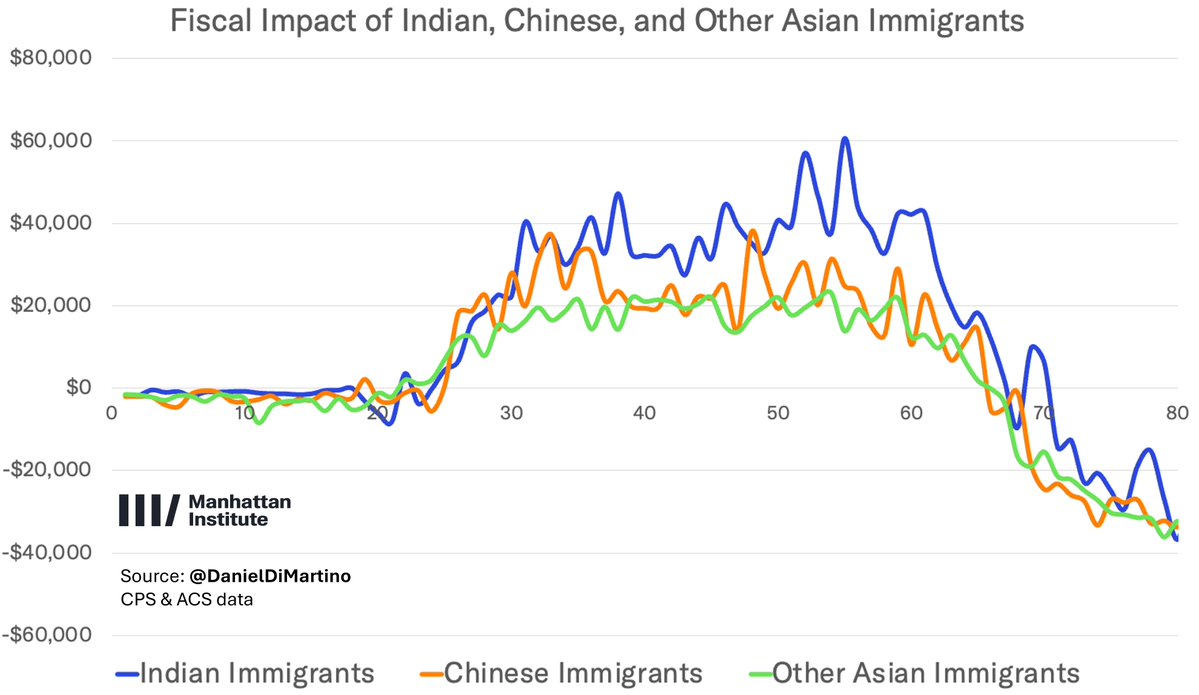
We find that Indians are the most economically positive major country of origin group.
Chinese immigrants contribute similarly to other Asian immigrants but Indians rise above the pack.
12
The overwhelming driver for these fiscal impact differences between groups is education.
If we look at the fiscal impact of immigrants by education we find that those with college degrees contribute immensely.
Immigrants with a high school diploma or less represent a net cost.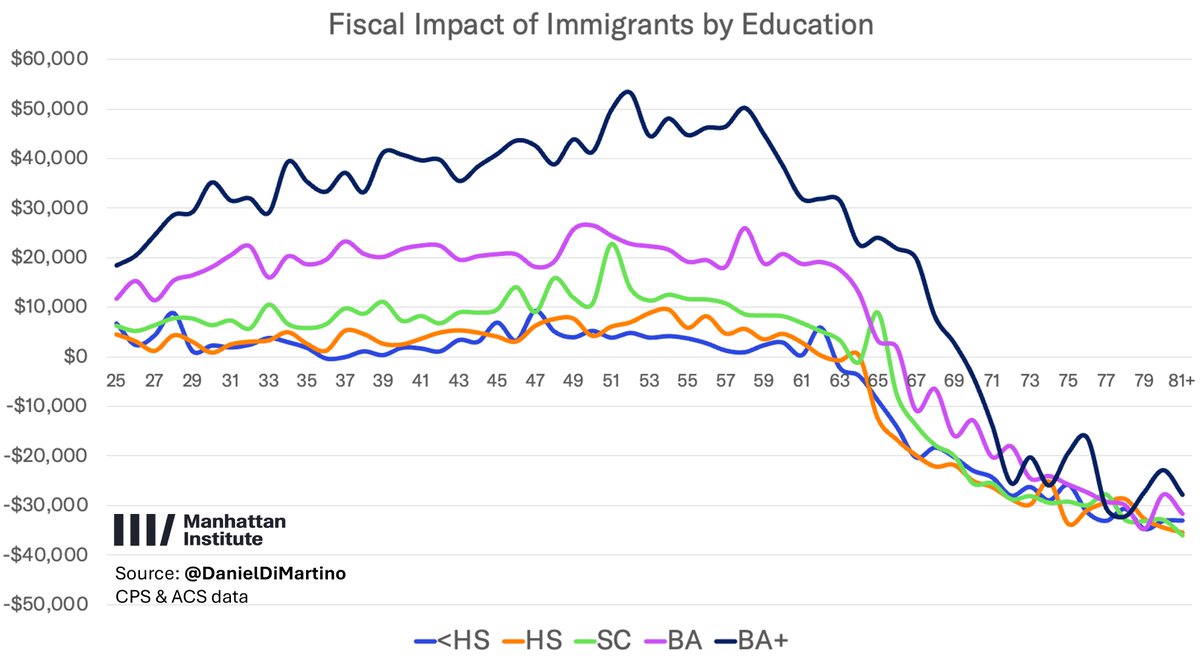
If we look at the fiscal impact of immigrants by education we find that those with college degrees contribute immensely.
Immigrants with a high school diploma or less represent a net cost.
13
Indian immigrants, being the most highly-educated major immigrant group, contribute much more in taxes than they receive in government benefits.
This is how Indians look relative to native-born whites in average fiscal contribution by age.
This is how Indians look relative to native-born whites in average fiscal contribution by age.
14
On the other hand, this is what the average Mexican immigrant fiscal contribution looks like relative to the average native born White.

15
If you want to select immigrants who perform better than native-born White Americans, then you must require at least a Bachelor's degree.
Despite a large number of Whites not having a college degree, they contribute just as much as immigrants who exclusively have a BA.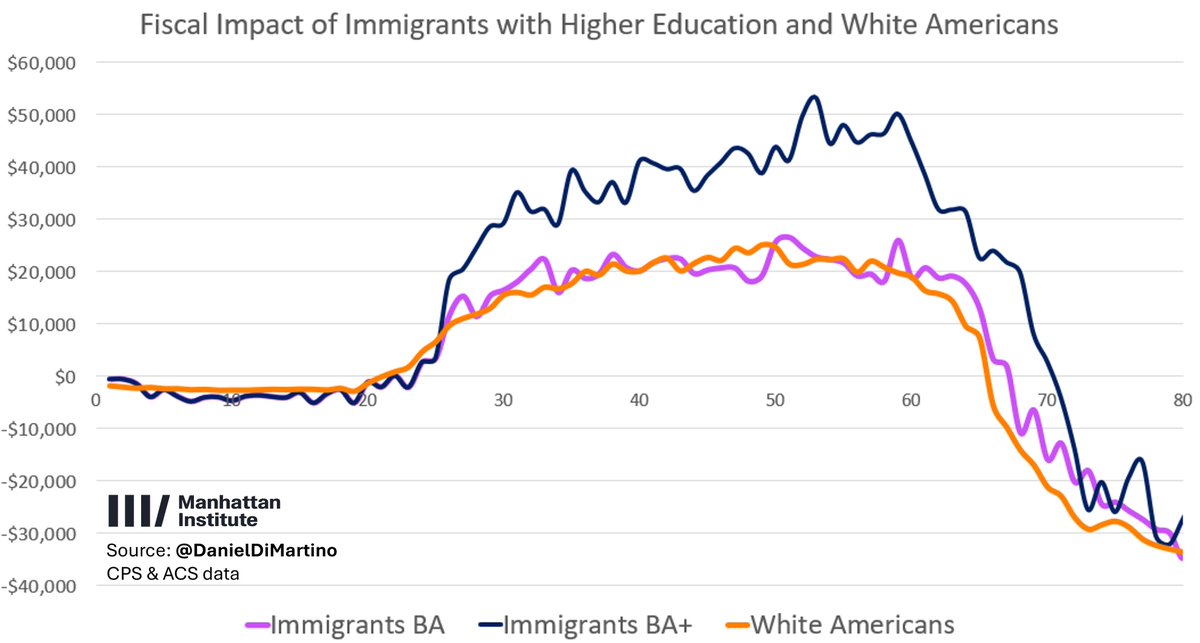
Despite a large number of Whites not having a college degree, they contribute just as much as immigrants who exclusively have a BA.
16
Indeed, this is what immigrants with just a high school diploma or without one look like relative to the average native born White.

17
Origin matters but education matters more and drives differences between origin groups when it comes to economic contribution.
An immigration policy that wants to maximize the economic contribution of immigration and minimize costs, would select more highly-educated immigrants.
An immigration policy that wants to maximize the economic contribution of immigration and minimize costs, would select more highly-educated immigrants.
18
Here it is by generation⬇️
2nd generation Americans (children of immigrants) contribute more fiscally than Americans who are 3rd generation+
They do just as well as 3rd generation+ non-Hispanic Whites.
Surprising since half of the 2nd generation is Hispanic.
2nd generation Americans (children of immigrants) contribute more fiscally than Americans who are 3rd generation+
They do just as well as 3rd generation+ non-Hispanic Whites.
Surprising since half of the 2nd generation is Hispanic.