Reminder that white men are more likely to be in an interracial...

Into the Memory Hole@frogNscorpion
19 views
Apr 23, 2025
~1 min read
Advertisement
1
Reminder that white men are more likely to be in an interracial relationship than white women

2
>but muh birth data
>but muh long term relationship data
>but muh study from ten years ago
We're in the hardest swing to the right since the 1920-1930's and you're crying.
There is no data agrees with you.
Either stop being such a hysterical doomer or get over your porn addictions.


>but muh long term relationship data
>but muh study from ten years ago
We're in the hardest swing to the right since the 1920-1930's and you're crying.
There is no data agrees with you.
Either stop being such a hysterical doomer or get over your porn addictions.
3


4
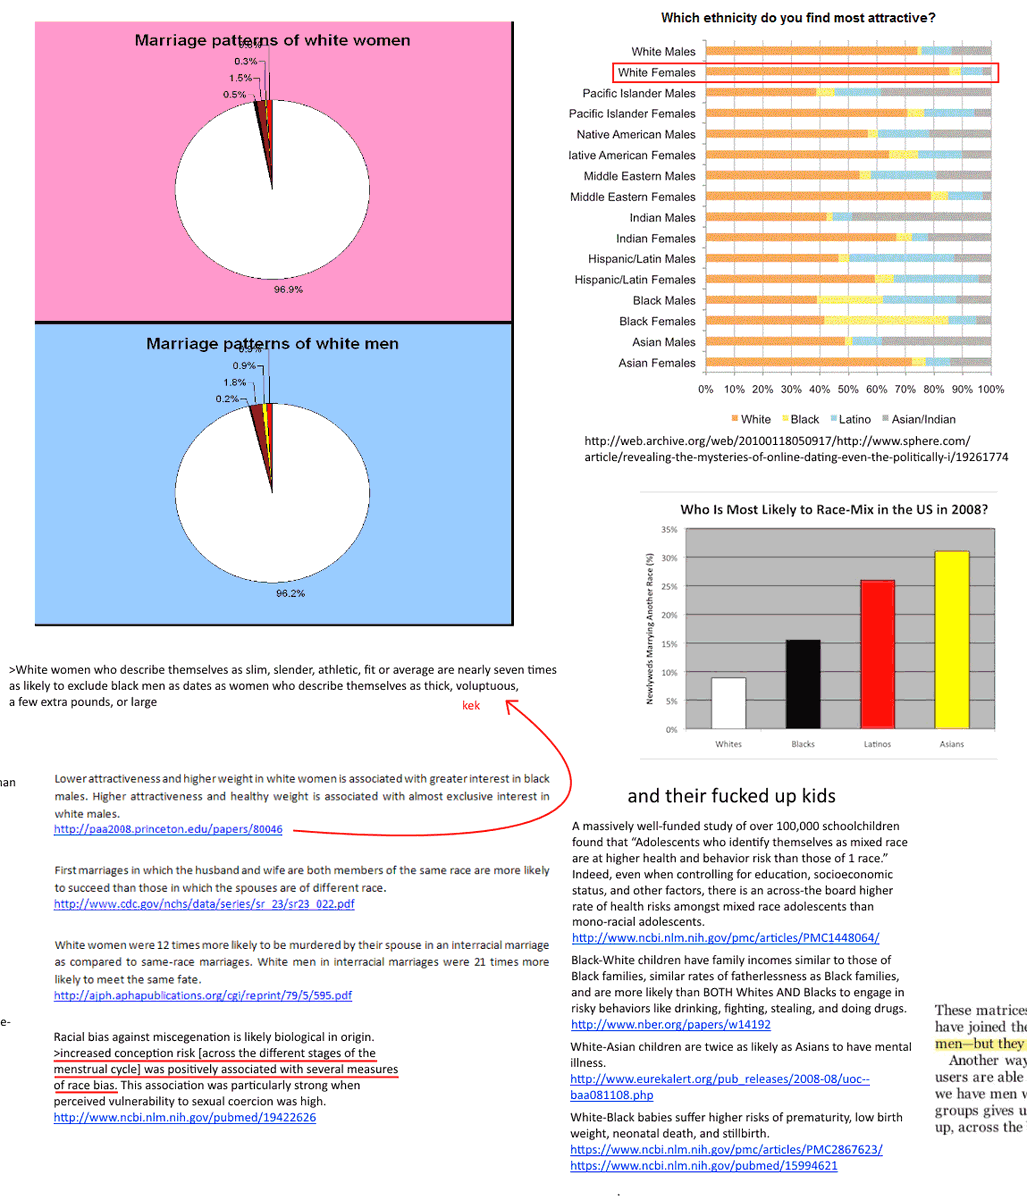
5

Boochi@Boochibooch
The latest studies and statistics on interracial relationships, focusing on:
○ Online dating and hookups
○ Marriage
○ Cohabitation
○ Birth data and trends
○ Relationship outcomes
From 2014 to 2024
🧵🧵🧵
○ Online dating and hookups
○ Marriage
○ Cohabitation
○ Birth data and trends
○ Relationship outcomes
From 2014 to 2024
🧵🧵🧵

6
No one is pulling us out of this slump but ourselves.
Into the Memory Hole@frogNscorpion
They've done and said some incredibly stupid and hurtful things to themselves and everyone around them but when it comes to the brass tacks in serious talks, our grandfathers failed.
They failed to maintain control of their nations and they killed their brothers for the sake of the Foreigner.
We inherit the mantle of responsibility and all of the damage done to it.
They failed to maintain control of their nations and they killed their brothers for the sake of the Foreigner.
We inherit the mantle of responsibility and all of the damage done to it.
7
Casual reminder that you're also watching many Asian men hiding who they are to demoralize white men. Asian women are possibly the least loyal demographic which has left many Asian men in a state of disarray and desperation.
8
Apparently clicking a link and genuinely reading a thread is too much for cuck fetishists so I'll post the breakdown piece by piece.


Boochi@Boochibooch
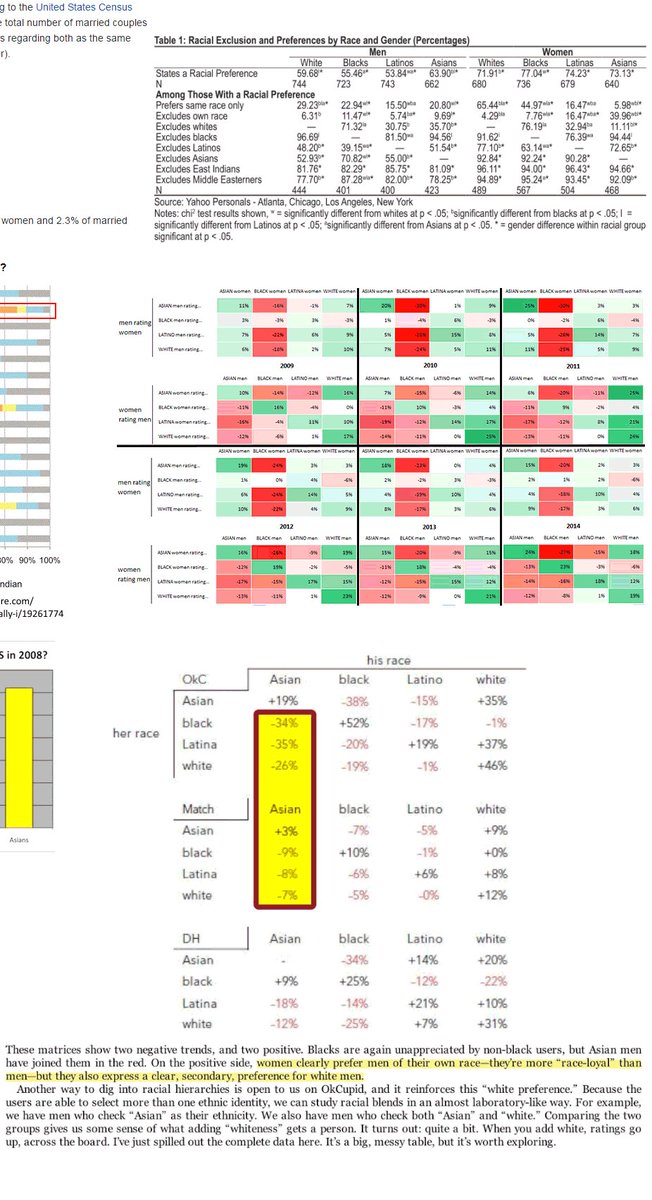
The earliest data from OkCupid:
White women are the most racially exclusive.
Despite liberals outnumbering cons over 2 to 1, and their preference taboo.
Exclusivity increased in 2014, despite an altered matching algorithm.
Asian women desired Black men more than White women.
White women are the most racially exclusive.
Despite liberals outnumbering cons over 2 to 1, and their preference taboo.
Exclusivity increased in 2014, despite an altered matching algorithm.
Asian women desired Black men more than White women.
9
Boochi@Boochibooch
"'QuickMatch score' predicts compatibility based on profile information, rather than visual attraction. Answers to match questions, etc.
'Let's Meet score' predicts the willingness to engage in real-world meeting based on visual attraction (rating)."
shorturl.at/2zNvc
'Let's Meet score' predicts the willingness to engage in real-world meeting based on visual attraction (rating)."
shorturl.at/2zNvc

10
Boochi@Boochibooch
From a 2015 study, "Racial Preferences in Online Dating across European countries"
"Individuals uniformly prefer to date same-race partners, and there is a hierarchy of preferences among natives and minorities.
Non-Arabic minority daters have strong preferences for Europeans."
"Individuals uniformly prefer to date same-race partners, and there is a hierarchy of preferences among natives and minorities.
Non-Arabic minority daters have strong preferences for Europeans."


11
Boochi@Boochibooch
From a 2016 study, "Crossracial Differences in the Racial Preferences"
"African-Americans are the least desired dating partners. The percentage of European-Americans willing to date African-Americans is significantly lower than the percentage willing to date Hispanic and Asian-Americans."
"African-Americans are the least desired dating partners. The percentage of European-Americans willing to date African-Americans is significantly lower than the percentage willing to date Hispanic and Asian-Americans."


12
Boochi@Boochibooch
From a 2017 German study, "Does the internet affect assortative mating?"
Online dating reduces endogamy compared to other forms of meeting partners, but mainly educational and religious endogamy.
Racial endogamy is twice as prevalent as the former two.
Online dating reduces endogamy compared to other forms of meeting partners, but mainly educational and religious endogamy.
Racial endogamy is twice as prevalent as the former two.


13
Boochi@Boochibooch
From a 2020 Dutch study, "Tinder usage and interracial dating":
Using 24 fake Tinder profiles featuring White and non-White people (minorities in the Netherlands: Turkish, Moroccan, etc)
12 White, 12 non-White.
All respondents found White-looking profiles more attractive.
Using 24 fake Tinder profiles featuring White and non-White people (minorities in the Netherlands: Turkish, Moroccan, etc)
12 White, 12 non-White.
All respondents found White-looking profiles more attractive.

14
Boochi@Boochibooch
Study limitations:
Asking respondents to indicate ethnic similarity could have primed them to the purpose of the study, and led to increased social desirability in their answers.
Conclusion:
All respondents ranked Caucasian-looking Tinder users as more attractive and dateable
Asking respondents to indicate ethnic similarity could have primed them to the purpose of the study, and led to increased social desirability in their answers.
Conclusion:
All respondents ranked Caucasian-looking Tinder users as more attractive and dateable

15
Boochi@Boochibooch
From a 2021 study, "Modeling dating decisions" by William J Chopik et al.
"Attractiveness and race were nearly double the influence of other things...
"While attractiveness played a major role in the participants' decisions to swipe left or right, race was a leading factor."
"Attractiveness and race were nearly double the influence of other things...
"While attractiveness played a major role in the participants' decisions to swipe left or right, race was a leading factor."


16
Boochi@Boochibooch
Conclusion:
"When the targets were Black, Asian, or Hispanic, they were less likely to be swiped right on. Among the largest effect sizes was a lower likelihood of swiping right if the target was Black."
Negative stereotypes may impact their [perceived] attractiveness."
"When the targets were Black, Asian, or Hispanic, they were less likely to be swiped right on. Among the largest effect sizes was a lower likelihood of swiping right if the target was Black."
Negative stereotypes may impact their [perceived] attractiveness."


17
Boochi@Boochibooch
From a 2022 study in the Netherlands, "Assortative online dating" by Ranzini, et al:
"Respondents with a Dutch ancestry were more likely to select a White person. Both Dutch and non-Dutch ancestry preferred White targets.
Race was the most important factor in partner choice."
"Respondents with a Dutch ancestry were more likely to select a White person. Both Dutch and non-Dutch ancestry preferred White targets.
Race was the most important factor in partner choice."


18
Boochi@Boochibooch
We created a dating app and asked respondents (500 young adults) to select dates from 110 profiles, which varied on race, education, and culture (Dutch or non-Dutch).
Conclusion:
"Visual cues to race determine selection, while related cultural signaling appears irrelevant."
Conclusion:
"Visual cues to race determine selection, while related cultural signaling appears irrelevant."


19
Boochi@Boochibooch
From a 2022 study, "Romance & Racism"
"White women particularly had strong same-race preferences"
Latinas liked White men over Black and Asian, but not Latinos.
Asian women preferred Asian over Black, but not White men.
Black women did not show a preference for any race.
"White women particularly had strong same-race preferences"
Latinas liked White men over Black and Asian, but not Latinos.
Asian women preferred Asian over Black, but not White men.
Black women did not show a preference for any race.


20
Boochi@Boochibooch
"White women and Latinas were more willing to date White men than Asian and Black men."
Asian and Black men were equally disliked.
Asian women preferred White and Asian men. (They were more willing to date Black men than White women were.)
Black women had no racial preference
Asian and Black men were equally disliked.
Asian women preferred White and Asian men. (They were more willing to date Black men than White women were.)
Black women had no racial preference


21
Boochi@Boochibooch
From a 2022 Russian study, "How Tinder changes dating among Russian Generation Z,"
"Dateability is heavily influenced by racial preferences...
Almost everyone stated that they would never swipe right on someone of a different race."
"Dateability is heavily influenced by racial preferences...
Almost everyone stated that they would never swipe right on someone of a different race."


22
Boochi@Boochibooch
The author theorizes Russians have racial preferences due to "sexual racism" from Russian media.
"Russian children don't see Black people growing up, so they absorb pictures of Blacks from Russian pop culture. This shows them with low social capital, thus zoomers hesitate."
"Russian children don't see Black people growing up, so they absorb pictures of Blacks from Russian pop culture. This shows them with low social capital, thus zoomers hesitate."


23
Boochi@Boochibooch
From a 2023 study 'Racial preferences in dating apps' by Aldana et al:
In a mock tinder app with 2,513 participants
"All of the female participants who initiated a conversation in the heterosexual condition with the Black male profile were trans women, according to their bios."
In a mock tinder app with 2,513 participants
"All of the female participants who initiated a conversation in the heterosexual condition with the Black male profile were trans women, according to their bios."


24
Boochi@Boochibooch
"Thousands of people saw these profiles.
White profiles had more likes in every situation."
Conclusion:
"Homogamous preferences, and rooted problems like sexual racism, can lead users to maintain a racialized sexual hierarchy that privileges Whiteness."
White profiles had more likes in every situation."
Conclusion:
"Homogamous preferences, and rooted problems like sexual racism, can lead users to maintain a racialized sexual hierarchy that privileges Whiteness."

25
Boochi@Boochibooch
From a 2023 study, Match's "Singles in America:
Gen Z Less Likely To Date Outside of Their Race Than Millennials"
"While Gen Z might be known for their progressive politics, they might not be as progressive when it comes to dating compared with their Millenial elders."
Gen Z Less Likely To Date Outside of Their Race Than Millennials"
"While Gen Z might be known for their progressive politics, they might not be as progressive when it comes to dating compared with their Millenial elders."


26
Boochi@Boochibooch
From the Annual Review of Sociology (2024):
"It was speculated that Asian men face more discrimination from White women than Black men do.
"Yet...[it] overlooks that, Black and Asian men outmarry at similar rates.
White women discriminate against Black and Asian men equally.."
"It was speculated that Asian men face more discrimination from White women than Black men do.
"Yet...[it] overlooks that, Black and Asian men outmarry at similar rates.
White women discriminate against Black and Asian men equally.."

27
Boochi@Boochibooch
Conclusion: Therefor White men's marriage patterns with Black women are the anomaly, and must be due to anti-Black discrimination.
"White men's anti-Black discrimination may be a more important explanation for observed intermarriage patterns."
"White men's anti-Black discrimination may be a more important explanation for observed intermarriage patterns."

28
Boochi@Boochibooch
From a 2024 study:
The rise of dating apps haven't changed racial marriage preferences:
"Our results indicated strong racial preferences...
The paper found minimal changes in these preferences over the 2008-21 period, in which online dating dominated marriage selection."
The rise of dating apps haven't changed racial marriage preferences:
"Our results indicated strong racial preferences...
The paper found minimal changes in these preferences over the 2008-21 period, in which online dating dominated marriage selection."


29
Boochi@Boochibooch
Conclusion:
Our findings of minimal changes in preferences over the 2008-21 period is surprising. Given the proliferation of online dating...
Because people have increasingly been marrying someone more like themselves, that can account for the increase in household inequality.
Our findings of minimal changes in preferences over the 2008-21 period is surprising. Given the proliferation of online dating...
Because people have increasingly been marrying someone more like themselves, that can account for the increase in household inequality.

30
Boochi@Boochibooch
Now for Marriage:
Among currently married women in their 1st marriage in 2016, 10 percent were in an interracial/interethnic marriage.
10.3% of women
5.1% of married non-Hispanic White women
8% of married Black women
20.6% of Asian women
22.4% of Hispanic or Latino (any race)
Among currently married women in their 1st marriage in 2016, 10 percent were in an interracial/interethnic marriage.
10.3% of women
5.1% of married non-Hispanic White women
8% of married Black women
20.6% of Asian women
22.4% of Hispanic or Latino (any race)


31
Boochi@Boochibooch
Why is the number (5.1%) so low here?
"Research has shown that interracial couples have higher rates of divorce than other couples, so the percentage of currently married interracial couples shown in the table may be lower than the percentage of interracial couples who married."
"Research has shown that interracial couples have higher rates of divorce than other couples, so the percentage of currently married interracial couples shown in the table may be lower than the percentage of interracial couples who married."


32
Boochi@Boochibooch
What are the trends?
2000-2016, the total % of interracial married households increased from 7.4% to 10.2%.
Of this:
White/Hispanic: 35% to 40% respectively.
White/Asian: 12.5%-14.4%
White/Black couples: 7.1%-8.1%.
Note: this is % of IR households, not all households
2000-2016, the total % of interracial married households increased from 7.4% to 10.2%.
Of this:
White/Hispanic: 35% to 40% respectively.
White/Asian: 12.5%-14.4%
White/Black couples: 7.1%-8.1%.
Note: this is % of IR households, not all households

33
Boochi@Boochibooch
From a 2023 study, "Black-White intermarriage in a global perspective"
For the first time, French data includes a proxy for race!
White females | White males:
Brazil: 5.4%---4.1%
France: 2.0%--1.4%
UK: 0.7%----0.4%
USA: 2.0%---0.6%
SA: 0.5%----1.0%
For the first time, French data includes a proxy for race!
White females | White males:
Brazil: 5.4%---4.1%
France: 2.0%--1.4%
UK: 0.7%----0.4%
USA: 2.0%---0.6%
SA: 0.5%----1.0%


34
Boochi@Boochibooch
"We use the term intermarriage in a generic manner; in our study we examine both married and cohabiting couples.
A feature of black–white intermarriage in the US is an imbalanced sex ratio; such gender imbalances are not found in any other countries."
demographic-research.org/volumes/vol49/…
A feature of black–white intermarriage in the US is an imbalanced sex ratio; such gender imbalances are not found in any other countries."
demographic-research.org/volumes/vol49/…


35
Boochi@Boochibooch
From “But Will It Last?: Marital Instability Among Interracial Couples"
White wife/Black husband marriages show twice the divorce rate of White wife/White husband couples by the 10th year of marriage.
The highest divorce rate of any combo, including Black-Black marriages.
White wife/Black husband marriages show twice the divorce rate of White wife/White husband couples by the 10th year of marriage.
The highest divorce rate of any combo, including Black-Black marriages.


36
Boochi@Boochibooch
From a later study "Marital Dissolution..."
Black husband-White wife marriages are 185% more likely to end in divorce.
White Husband-Black wife, 158%
Hispanic Husband-White wife, 133%
White Husband-Hispanic wife, 111%
Both gender combinations with Asians had lower divorce rates
Black husband-White wife marriages are 185% more likely to end in divorce.
White Husband-Black wife, 158%
Hispanic Husband-White wife, 133%
White Husband-Hispanic wife, 111%
Both gender combinations with Asians had lower divorce rates


37
Boochi@Boochibooch
Now cohabitation:
8% of White adults cohabit, 57% are married.
Whites are the least likely to cohabit interracially, at 12%.
Of cohabiting households in 2007-2011, 2.7% were Black-White.
In 2017-2021, this share increased to 2.8%.
A .1% increase in the last decade.
8% of White adults cohabit, 57% are married.
Whites are the least likely to cohabit interracially, at 12%.
Of cohabiting households in 2007-2011, 2.7% were Black-White.
In 2017-2021, this share increased to 2.8%.
A .1% increase in the last decade.


38
Boochi@Boochibooch
White men and women have the same cohabitation rates: 7.9% each.
Cohabitation rates have plateaued over the past decade.
Only 26% of non-Hispanic White women remain in their cohabitant union for at least 3 years before separation. 8% survive 5 years.
Cohabitation rates have plateaued over the past decade.
Only 26% of non-Hispanic White women remain in their cohabitant union for at least 3 years before separation. 8% survive 5 years.


39
Boochi@Boochibooch
Now for IR Birth Data:
From the latest CDC Natality Statistics,
For White mother births in 2023 (Excluding unknown):
87.6% of fathers are non-Hispanic White
5.6% are Hispanic-White
--92%--^
3.5% are Black (Hisp and non)
2.1% are 2 or more races (H&N)
1.2% are Asian (H&N)
From the latest CDC Natality Statistics,
For White mother births in 2023 (Excluding unknown):
87.6% of fathers are non-Hispanic White
5.6% are Hispanic-White
--92%--^
3.5% are Black (Hisp and non)
2.1% are 2 or more races (H&N)
1.2% are Asian (H&N)

40
Boochi@Boochibooch
For White father births in 2023 (Excluding unknown):
88% of mothers are non-Hispanic White
6.2% are Hispanic-White
--94.2%--^
2% are Asian (Hisp and non)
2% are 2 or more races (H&N)
1.25% are Black (H&N)
88% of mothers are non-Hispanic White
6.2% are Hispanic-White
--94.2%--^
2% are Asian (Hisp and non)
2% are 2 or more races (H&N)
1.25% are Black (H&N)

41
Boochi@Boochibooch
Broken down by single moms and dads (Excl Unknown):
White single mothers, by race of dad:
Black: 62%
2 or more races: 46%
Hispanic-White: 43%
Asian: 27.3%
Non-Hispanic White: 23%
For White single fathers:
Black: 42%
Hispanic-White: 39%
Asian: 27%
Non-Hispanic White: 23%
White single mothers, by race of dad:
Black: 62%
2 or more races: 46%
Hispanic-White: 43%
Asian: 27.3%
Non-Hispanic White: 23%
For White single fathers:
Black: 42%
Hispanic-White: 39%
Asian: 27%
Non-Hispanic White: 23%


42
Boochi@Boochibooch
For Birthrate Trends (2016-2023)
Like in all previous years, the overall number of IR births is down since 2016.
The increases in percentage (.1% every 3 years for BM-WW births) isn't due to an increase in their number--rather White-White births have simply declined overall.
Like in all previous years, the overall number of IR births is down since 2016.
The increases in percentage (.1% every 3 years for BM-WW births) isn't due to an increase in their number--rather White-White births have simply declined overall.


43
Boochi@Boochibooch
Key points from the CDC data:
IR couples with non-Whites have higher rates of single parenthood in every case, especially with Black partners.
The birth rate between White women and Asian men is equivalent White women and Black men, when controlling for population size. (1/3)
IR couples with non-Whites have higher rates of single parenthood in every case, especially with Black partners.
The birth rate between White women and Asian men is equivalent White women and Black men, when controlling for population size. (1/3)

44
Boochi@Boochibooch
Note the CDC data I added does not include "Unknown or unstated," thus there's a gap in the data I can't speculate on.
I'll also be adding relevant racial preference data to this thread for easy reference moving forward.
I'll also be adding relevant racial preference data to this thread for easy reference moving forward.
45
Boochi@Boochibooch
A 2015 study, "Positioning Multiraciality in Cybserspace," wanted to find out where multiracial individuals are positioned in the "racial hierarchies of the dating market."
For White women:
White > Asian-White > Hispanic-White > Black-White > Hispanic > Asian > Black
For White women:
White > Asian-White > Hispanic-White > Black-White > Hispanic > Asian > Black


46
Boochi@Boochibooch
For Asian women:
Asian-White>White>Asian
For Asian men:
Asian-White>Asian>White
For Hispanic women:
Hispanic-White>White>Hispanic
For Hispanic men:
Hispanic>White>Hispanic-White
For Black women:
White men>Black-White>Black
For Black men:
Black-White>White>Black
Asian-White>White>Asian
For Asian men:
Asian-White>Asian>White
For Hispanic women:
Hispanic-White>White>Hispanic
For Hispanic men:
Hispanic>White>Hispanic-White
For Black women:
White men>Black-White>Black
For Black men:
Black-White>White>Black


47
Boochi@Boochibooch
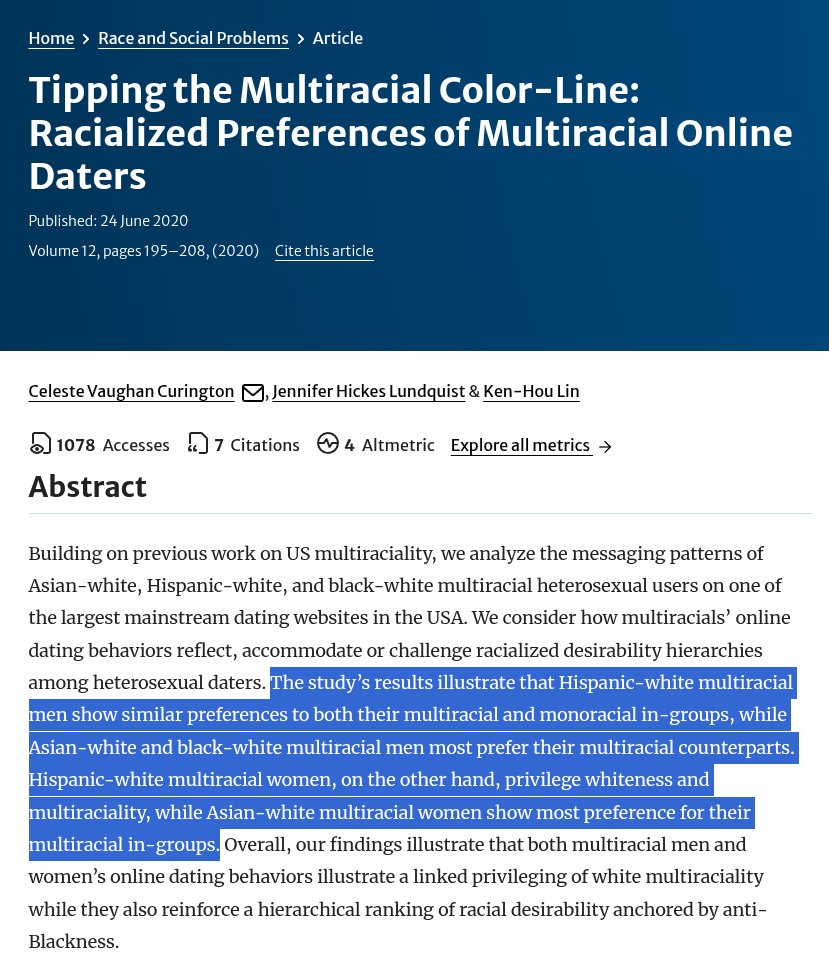
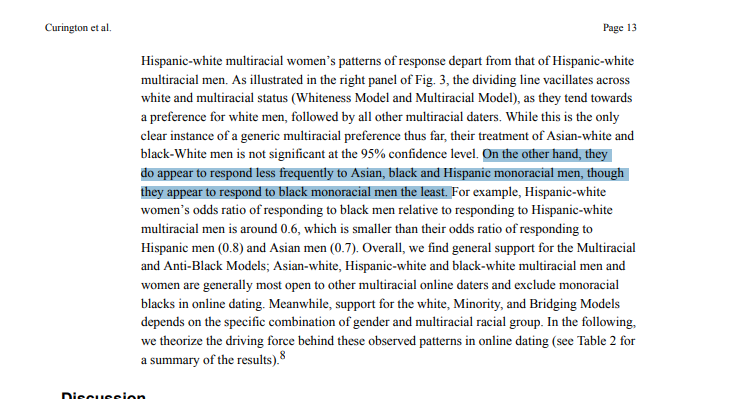
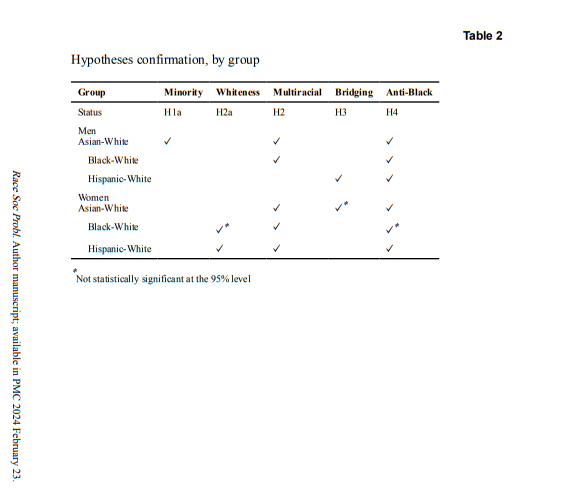
A 2020 study found that a racial hierarchy emerges for multiracial daters consistent with past research.
All groups responded to their own in-group the most, except for Hispanic-White women, who preferred White men.
All groups responded to monoracial Black men the least.
White women are more likely to respond to Asian-White men than Black-White men.
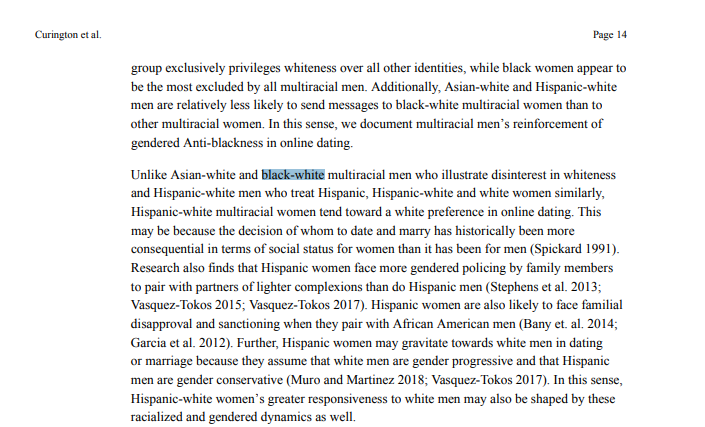
Black-White men prefer monoracial Black women, then Black-White, then White.
Black-White and Hispanic-White women privilege "Whiteness"
Black women prefered White men, Black-White, and Black men least.
Hispanic-White men prefer Hispanic, Hispanic-White, and White women equally.
Hispanic-White and Asian-White women view White men as more gender progressive than their other monoracial group.
All groups showed "anti-Black" bias.
All groups responded to their own in-group the most, except for Hispanic-White women, who preferred White men.
All groups responded to monoracial Black men the least.
White women are more likely to respond to Asian-White men than Black-White men.
Black-White men prefer monoracial Black women, then Black-White, then White.
Black-White and Hispanic-White women privilege "Whiteness"
Black women prefered White men, Black-White, and Black men least.
Hispanic-White men prefer Hispanic, Hispanic-White, and White women equally.
Hispanic-White and Asian-White women view White men as more gender progressive than their other monoracial group.
All groups showed "anti-Black" bias.