You can probably optimize your @Java programs to run 2-10x faster,...

Geoffrey De Smet@GeoffreyDeSmet
10 views
Apr 21, 2026
~2 min read
Advertisement
1
You can probably optimize your @Java programs to run 2-10x faster, by focusing on the bottlenecks.
Those bottlenecks are not where you think they are.
Use free tools such as async-profiler, VisualVM, JFR and vmstat to find them.
Let me show you how. 🧵
Those bottlenecks are not where you think they are.
Use free tools such as async-profiler, VisualVM, JFR and vmstat to find them.
Let me show you how. 🧵
2
Create a main() Java application that runs the bulk of your code on a seriously sized dataset for at least a minute.
Run async-profiler and Java Flight Recorder (JFR) on that, either from the command line (free) or through @intellijidea Ultimate (paid) as shown below.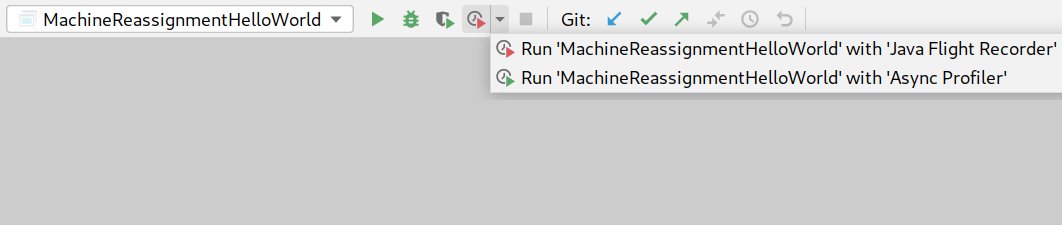
Run async-profiler and Java Flight Recorder (JFR) on that, either from the command line (free) or through @intellijidea Ultimate (paid) as shown below.
3
1) Async-profiler outputs a flamegraph to show the relative CPU time taken by each method (including methods it calls).
Slow methods stick out like a soar thumb, even if they loop (unlike in other visualizations).
This graph made one of our use cases 10x faster.
Slow methods stick out like a soar thumb, even if they loop (unlike in other visualizations).
This graph made one of our use cases 10x faster.
4
Async-profiler doesn't suffer from Safepoint Bias.
This means it's more honest than:
- VisualVM's sampler which rounds measurements to the nearest safepoint
- VisualVM instrumentation profiler which inflates short methods that are called a lot with instrumentation overhead
This means it's more honest than:
- VisualVM's sampler which rounds measurements to the nearest safepoint
- VisualVM instrumentation profiler which inflates short methods that are called a lot with instrumentation overhead
5
2) VisualVM is useful too, to quickly monitor GC activity, detect potential memory leaks etc.
Download and run it, then start your main(), double click on your process in the VisualVM list and switch to the monitor tab: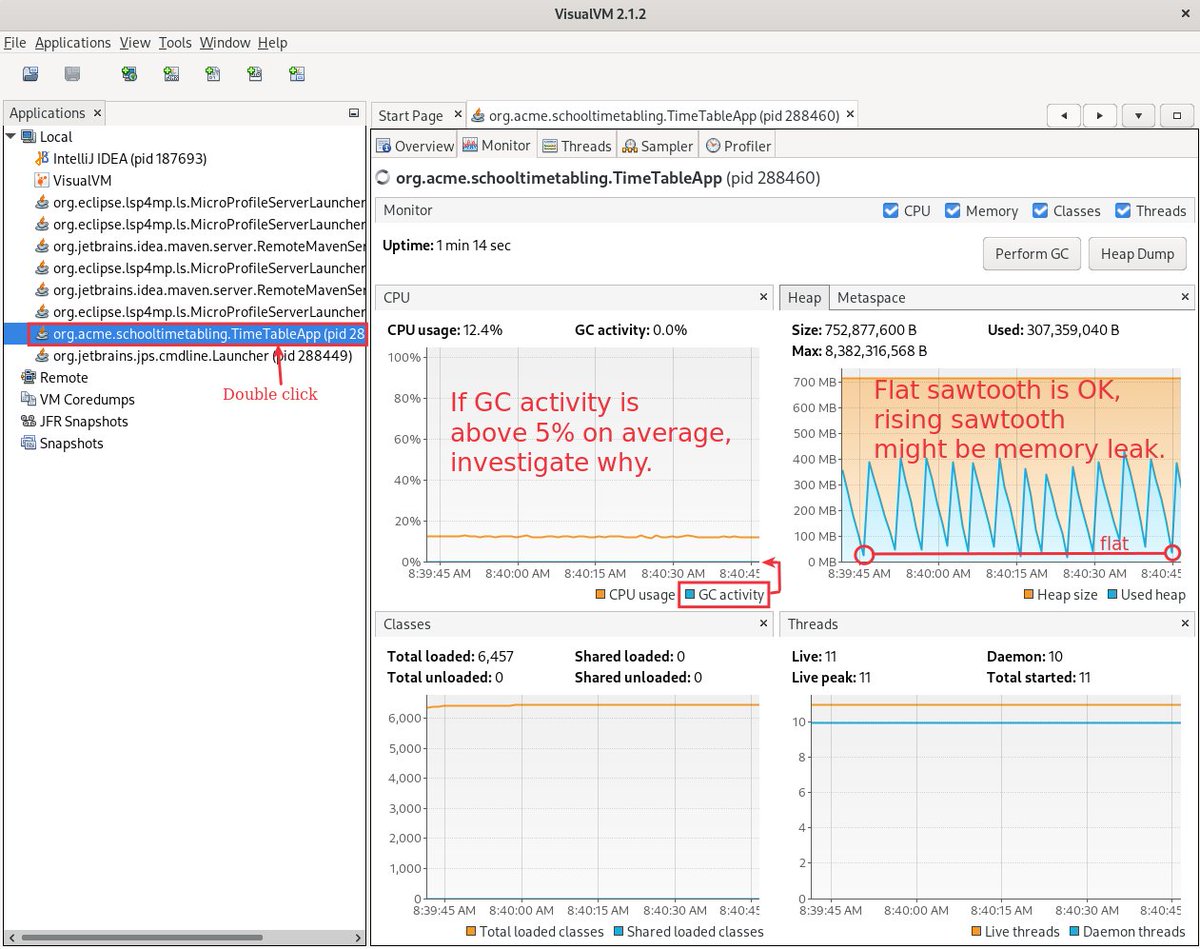
Download and run it, then start your main(), double click on your process in the VisualVM list and switch to the monitor tab:
6
3) Java Flight Recorder (JFR) shows memory allocations and lock congestion.
To get memory allocations data in @intellijidea you need to explicitly change its settings, for a performance overhead.
(Thanks to Jeremy Whiting for teaching me at @DevoxxUK)
To get memory allocations data in @intellijidea you need to explicitly change its settings, for a performance overhead.
(Thanks to Jeremy Whiting for teaching me at @DevoxxUK)
7
The JFR data is stored in your home folder by default. Download and run Java Mission Control (JMC) to open these files and visualize the data recorded by Java Flight Recorder.
Then switch to the TLAB Allocations screen.
Then switch to the TLAB Allocations screen.
8
JFR records all memory allocations. Every memory allocation costs CPU time for creation and CPU time for Garbage Collection.
This method allocated 7GB per minute in some configurations. Now, it does the same functionality with a fraction of that, significantly faster.
This method allocated 7GB per minute in some configurations. Now, it does the same functionality with a fraction of that, significantly faster.
9
4) vmstat
The tools in above work on the JVM level. The real truth is at the OS level, as explained by Kirk Pepperdine (@kcpeppe) at @Jfokus. Especially to detect Noisy Neighbors (other containers/VM with which you share a bare metal machine).
Call vmstat on the linux cmd line: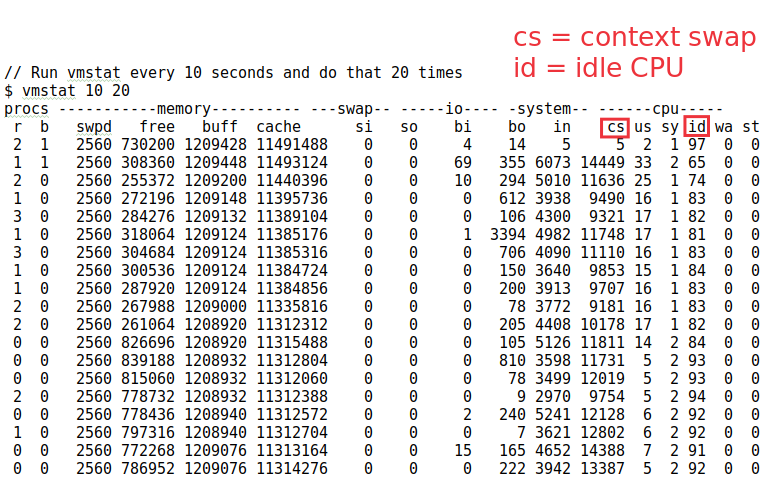
The tools in above work on the JVM level. The real truth is at the OS level, as explained by Kirk Pepperdine (@kcpeppe) at @Jfokus. Especially to detect Noisy Neighbors (other containers/VM with which you share a bare metal machine).
Call vmstat on the linux cmd line:
10
I hope you found this thread useful.
Anything important that I missed?
Anything important that I missed?
11
Coincidentally, the mailman just now delivered the "Optimizing Java" book by Ben Evans (@kittylyst), so I'll probably learn a bunch more about performance tuning over the next few weeks.

