Canvas & Ratio
Choose your destination platform format
Layout Template
Choose a content structure for your slides
Preset Themes
Typography & Sizing
Brand Kit Customization
AGENCYConfigure brand assets for headers & footers
Outro Slide CTA
Customize your closing call-to-action slide
Background Pattern
Build Your Carousel
Drag and drop any post card below onto a slide, or use the quick buttons to insert content/images instantly!

🧵 Why the obsession with p < 0.05 is hurting science. A meme. A truth. A reality check.
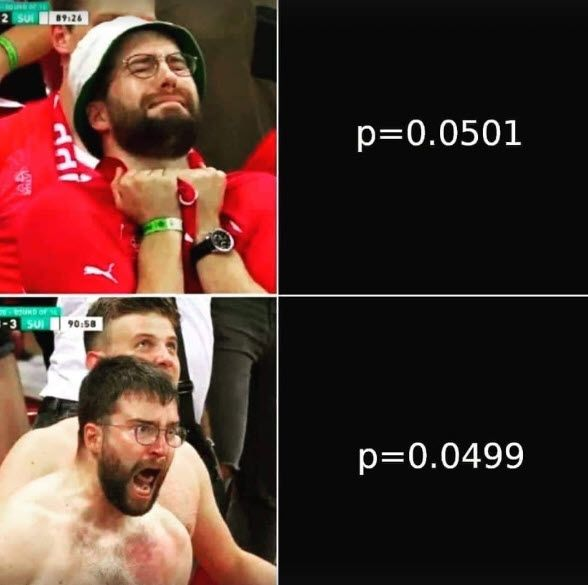
1/ This meme says it all. p = 0.0501? Pain. p = 0.0499? Pure euphoria. Two numbers. Nearly identical. Yet we treat them like night and day. Why?
2/ The 0.05 p-value threshold is arbitrary. It came from R.A. Fisher in the 1920s. And we’ve been worshipping it like a sacred line ever since. But it’s not magic. It's convention.
3/ What does p < 0.05 actually mean? It means: If the null hypothesis is true, there’s a 5% chance we’d see this extreme of a result by random chance. That’s it. Not: "This is true." Not: "This will replicate."
4/ p = 0.0499 and p = 0.0501 are nearly identical. But one gets you a “significant” label. The other gets dismissed. That’s broken thinking.
5/ Quoting Mike Love: “A smaller p-value is not more interesting.” “We should focus on effect sizes.” He’s right.
6/ What’s an effect size? It tells you how big the difference is. Not just if it’s statistically detectable. A gene with a log2 fold change of 3 matters. Even if p = 0.06.
7/ P-values shrink with more data. Got 10,000 samples? You’ll find “significance” for even the tiniest differences. Statistically significant ≠ Biologically meaningful.
8/ Also, be careful when testing thousands of genes. Even with a p < 0.05 threshold, false positives will sneak in. Use multiple testing correction: FDR, Bonferroni. Always.
9/ Let’s reframe: Instead of: “Did I beat the p < 0.05 line?” Ask: Is the effect meaningful? Is it reproducible? Does it make biological sense?
10/ Want a better practice? Look at the distribution of p-values. Report adjusted p-values (FDR). Highlight effect sizes. Don’t cherry-pick.
11/ And don’t forget confidence intervals. They show the range of plausible effect sizes—not just a binary yes/no. More context, more truth.
12/ Key takeaways: 0.05 is a line in sand, not a cliff p-values ≠ effect size Focus on biological meaning Always correct for multiple testing Use p-values as part of the story—not the whole story
13/ If you're making big decisions based on p = 0.0499 vs 0.0501... You're not doing science. You're doing stats theater. Look deeper. Think harder. Go beyond the stars.
14/ And please—share this with a friend still chasing tiny p-values. Let’s stop celebrating noise and start celebrating insight.
I hope you've found this post helpful. Follow me for more. Subscribe to my FREE newsletter chatomics to learn bioinformatics <a target="_blank" href="https://divingintogeneticsandgenomics.ck.page/profile" color="blue">divingintogeneticsandgenomics.ck.page/profile</a> <a target="_blank" href="https://twitter.com/433559451/status/2050202341593481474" color="blue">x.com/433559451/stat…</a>