The P/E ratio SUCKS.
It’s a flawed metric that deceives investors.
Here's exactly why the P/E ratio can be INCREDIBLY misleading (and what to use instead):


The P/E ratio's flaw is that the "earnings” can be misleading.
If “earnings” aren’t sustainable, or are artificially inflated/depressed, the P/E ratio will be wrong.
Here's all the reasons why that can happen...
If “earnings” aren’t sustainable, or are artificially inflated/depressed, the P/E ratio will be wrong.
Here's all the reasons why that can happen...
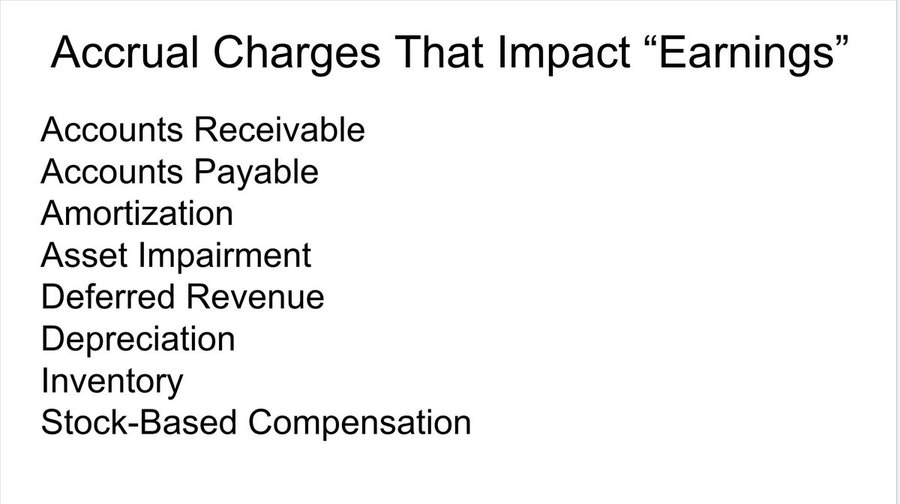
1: Accrual Accounting
The GAAP income statement uses accrual accounting.
Accrual accounting is useful, but it’s basically an accountant’s opinion.
Here are some of the expenses that can cause “earnings” to be higher or lower than the actual cash flow of a business
The GAAP income statement uses accrual accounting.
Accrual accounting is useful, but it’s basically an accountant’s opinion.
Here are some of the expenses that can cause “earnings” to be higher or lower than the actual cash flow of a business
Ex: In 2019, $NFLX reported $1.9 billion in "earnings", but its operating cash flow was NEGATIVE $2.9 billion
While it was “profitable” on a net income basis, its actual cash outflow was enormous.
The P/E ratio doesn’t reflect this at all
While it was “profitable” on a net income basis, its actual cash outflow was enormous.
The P/E ratio doesn’t reflect this at all

2: Equity investments
Some companies buy stock in other public (Ex: $SHOP owns $AFRM stock)
GAAP marks UP “earnings” when their investments increase in value and DOWN when they decline, making the P/E ratio useless
Some companies buy stock in other public (Ex: $SHOP owns $AFRM stock)
GAAP marks UP “earnings” when their investments increase in value and DOWN when they decline, making the P/E ratio useless

3: One-time events
Companies receive windfalls from taxes, asset sales, and one-off deals.
When this happens, “earnings” can SKYROCKET, which causes the P/E ratio to temporarily plunge
Companies receive windfalls from taxes, asset sales, and one-off deals.
When this happens, “earnings” can SKYROCKET, which causes the P/E ratio to temporarily plunge

Ex: $SBUX in 2018
Starbucks received a $1.4 billion payment from Nestle.
This HUGELY boosted earnings, which artificially DEPRESSED the P/E for a year, which made it a deceiving metric.
Starbucks received a $1.4 billion payment from Nestle.
This HUGELY boosted earnings, which artificially DEPRESSED the P/E for a year, which made it a deceiving metric.

4: Unsustainable trend
When profits are fueled by a short-term demand, the P/E ratio can plunge, but it's a mirage.
Ex: $GILD launched two drugs in 2014 that cured patients of Hepatitis C. Profits EXPLODED, which caused the P/E ratio to fall to just 8!
When profits are fueled by a short-term demand, the P/E ratio can plunge, but it's a mirage.
Ex: $GILD launched two drugs in 2014 that cured patients of Hepatitis C. Profits EXPLODED, which caused the P/E ratio to fall to just 8!

But Gilead's profits were unsustainable.
Earnings fell sharply, which caused the P/E ratio to expand.
If you bought because of the “cheap” P/E ratio (like me), you did poorly.
Earnings fell sharply, which caused the P/E ratio to expand.
If you bought because of the “cheap” P/E ratio (like me), you did poorly.

5: Disruption
When a company's business gets disrupted, earnings are in a permanent state of decline.
$GE's earnings grew for 100+ years, and in 2008 its P/E ratio was just 14. Reasonable, right?
When a company's business gets disrupted, earnings are in a permanent state of decline.
$GE's earnings grew for 100+ years, and in 2008 its P/E ratio was just 14. Reasonable, right?

But $GE had made a series of bets that didn’t pay off, in part due to disruption.
GE's net income was at a peak, so its P/E ratio was understated.
Shares fell hard over the next few years, even though investors thought they were buying at a reasonable P/E ratio.
GE's net income was at a peak, so its P/E ratio was understated.
Shares fell hard over the next few years, even though investors thought they were buying at a reasonable P/E ratio.

6: Cyclical demand
Some industries are prone to booms and busts, like energy, industrials, commodities, housing...
Earnings explode during boom times and crash during bust times.For these companies, the P/E ratio works backward
Some industries are prone to booms and busts, like energy, industrials, commodities, housing...
Earnings explode during boom times and crash during bust times.For these companies, the P/E ratio works backward

Ex: $XOM
Profits surge when energy prices are high (2022) and sink when they fall.
The WORST time to invest is at a cyclical peak, which is when the P/E ratio looks cheapest (the inverse is also true)
Profits surge when energy prices are high (2022) and sink when they fall.
The WORST time to invest is at a cyclical peak, which is when the P/E ratio looks cheapest (the inverse is also true)

7: Industry Dynamics
The P/E ratio doesn't work at all in some industries.
Ex:
🏦 Banks: Credit cycles
🧑🔬 Biotech: Losses, then a big payout
🏘️ REITs: High depreciation charges
The P/E ratio doesn't work at all in some industries.
Ex:
🏦 Banks: Credit cycles
🧑🔬 Biotech: Losses, then a big payout
🏘️ REITs: High depreciation charges
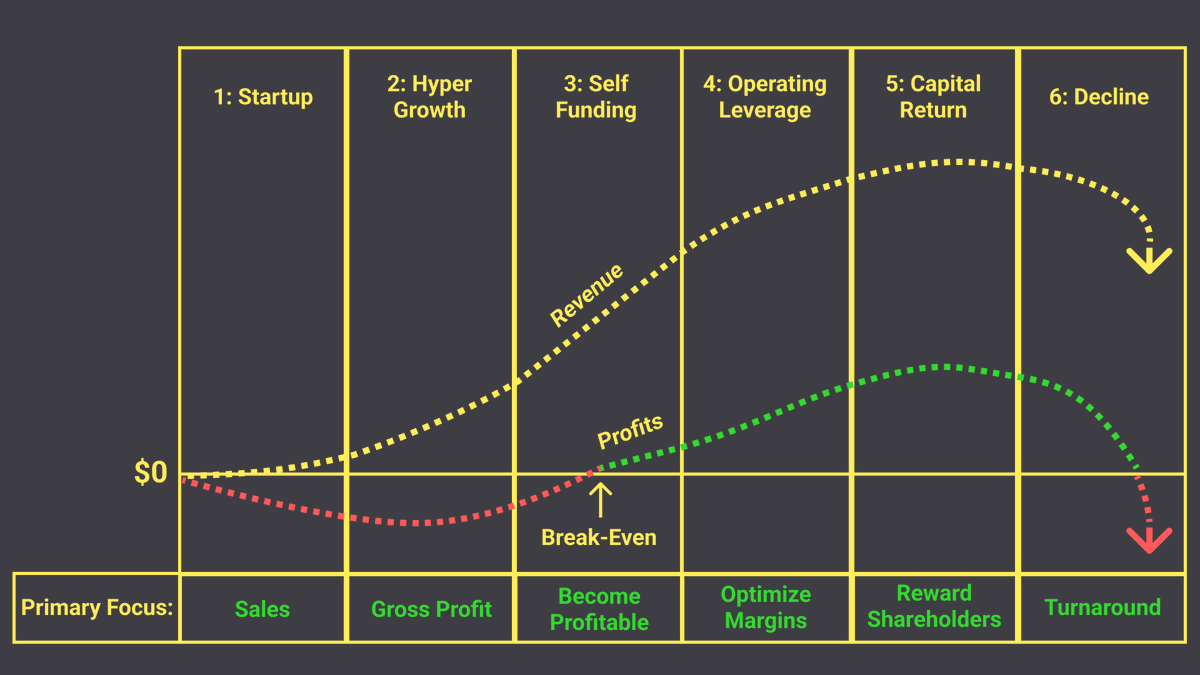
8: Business Growth Cycle
Companies in phases 1, 2, or 3 are optimized for GROWTH, not profits.Management plows all available resources into hiring & expansion.
This artificially UNDERSTATES the earnings power of the business, which artificially OVERSTATES the P/E ratio.
Companies in phases 1, 2, or 3 are optimized for GROWTH, not profits.Management plows all available resources into hiring & expansion.
This artificially UNDERSTATES the earnings power of the business, which artificially OVERSTATES the P/E ratio.
This is why $AMZN was called "insanely expensive" for years.
For decades, it was optimized for growth, not earnings, which caused the P/E ratio to look crazy
In 2017, it started to optimize for earnings (although COVID messed this up)
For decades, it was optimized for growth, not earnings, which caused the P/E ratio to look crazy
In 2017, it started to optimize for earnings (although COVID messed this up)

What should investors do?
Learn when the P/E ratio is USEFUL and when it’s USELESS (see chart).
Learn when the P/E ratio is USEFUL and when it’s USELESS (see chart).

*Key Question*
What part of the income statement is the company optimized for?
Sales ➡️ P/S ratio
Gross Profit ➡️ P/Gross Profit ratio
Operating Income➡️ P/EBIT ratio
Earnings➡️ P/E Ratio
Free Cash Flow➡️P/FCF Ratio
What part of the income statement is the company optimized for?
Sales ➡️ P/S ratio
Gross Profit ➡️ P/Gross Profit ratio
Operating Income➡️ P/EBIT ratio
Earnings➡️ P/E Ratio
Free Cash Flow➡️P/FCF Ratio

I teach investors how to analyze businesses.
If this thread was useful, follow me @BrianFeroldi.
To share with your followers, ♻️ retweet the first tweet below:
If this thread was useful, follow me @BrianFeroldi.
To share with your followers, ♻️ retweet the first tweet below:
View Tweet
Generated by Thread Navigator
Press ⌘ + S to quick-export