It’s happening AGAIN
Buckle up.
A thread 🧵


2/ A $54 trillion asset class has been bouncing back now
This is happening after a crash as violent as during the pandemic and the Financial Crisis
Today, a record 60% of US households have stock market exposure
The big question now is: can this rally really last?
This is happening after a crash as violent as during the pandemic and the Financial Crisis
Today, a record 60% of US households have stock market exposure
The big question now is: can this rally really last?

3/ To answer that, we’re going to dig into hard historical data
But first, let’s outline the 3 potential paths ahead:
1) A sharp V-shape recovery back to all-time highs
2) A deeper pullback breaking the April 7th low
3) A choppy consolidation before another leg higher
But first, let’s outline the 3 potential paths ahead:
1) A sharp V-shape recovery back to all-time highs
2) A deeper pullback breaking the April 7th low
3) A choppy consolidation before another leg higher
4/ Let’s start with the V-shaped recovery
For that to happen, we’d need a dramatic shift in the economic outlook
Basically, all the fears priced in earlier this year would need to vanish soon
That’s a big ask, but it’s not impossible
Some are pointing to the US-China trade deal as a reason to be optimistic
For that to happen, we’d need a dramatic shift in the economic outlook
Basically, all the fears priced in earlier this year would need to vanish soon
That’s a big ask, but it’s not impossible
Some are pointing to the US-China trade deal as a reason to be optimistic

5/ And we’ve seen V-shaped rebounds before
The most recent example was 2020
When stocks crashed 35% from COVID only to snap back to ATHs in almost a straight line
The most recent example was 2020
When stocks crashed 35% from COVID only to snap back to ATHs in almost a straight line

6/ Another example is late 2008
Investors went from fearing a total collapse to pricing in a strong rebound
But both of these rallies had something huge behind them:
Massive liquidity injections from the Fed
Investors went from fearing a total collapse to pricing in a strong rebound
But both of these rallies had something huge behind them:
Massive liquidity injections from the Fed

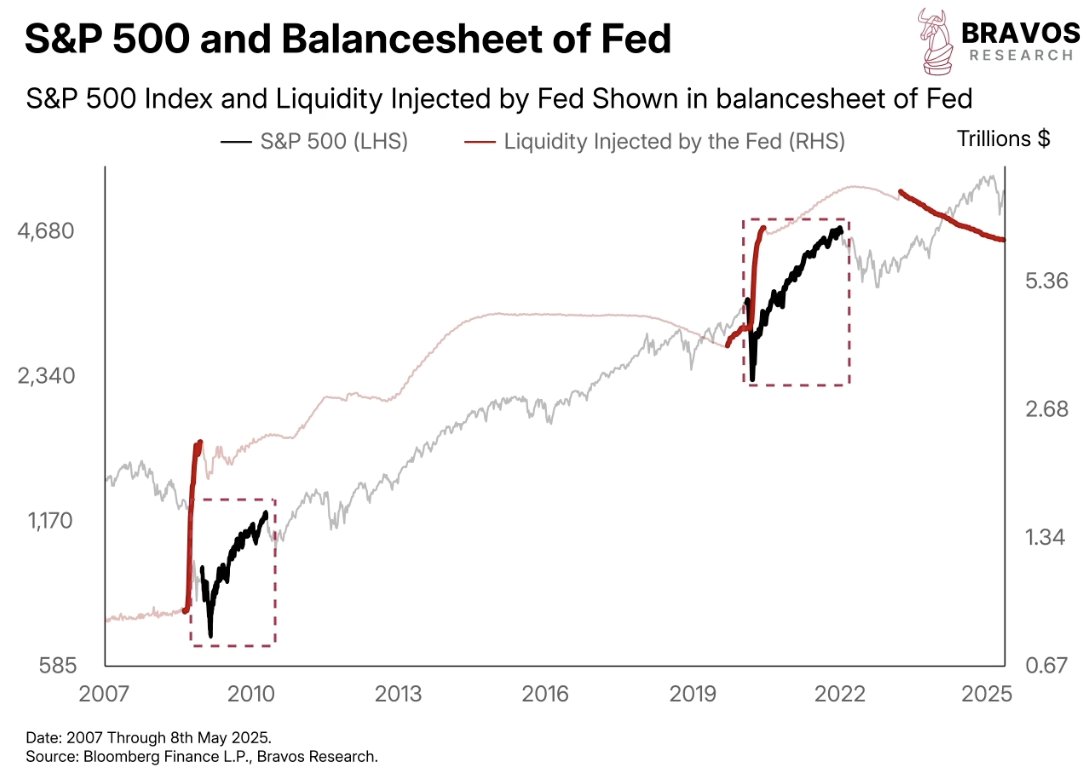
7/ We can see this by looking at the Fed’s balance sheet
The biggest liquidity jumps in history came right before those V-shaped rallies
Today, we’re not seeing the same setup
Still, not everything is working against a V-shape recovery
The biggest liquidity jumps in history came right before those V-shaped rallies
Today, we’re not seeing the same setup
Still, not everything is working against a V-shape recovery
8/ For one, corporate earnings have held up well
Despite the 20% market drop, S&P 500 earnings estimates are actually higher now than they were in Jan And that strength is being driven by a few important tailwinds
Despite the 20% market drop, S&P 500 earnings estimates are actually higher now than they were in Jan And that strength is being driven by a few important tailwinds
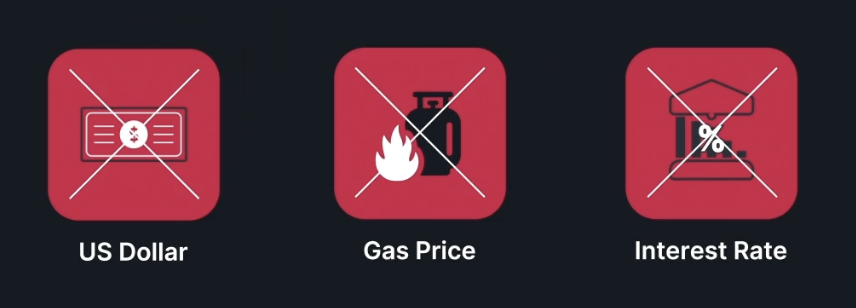
9/ A weaker dollar is boosting international revenues
Lower gas prices are helping consumers stay afloat
And the Fed’s rate cuts over the past year may finally be filtering through the economy
These are all supportive for earnings and growth
Lower gas prices are helping consumers stay afloat
And the Fed’s rate cuts over the past year may finally be filtering through the economy
These are all supportive for earnings and growth
10/ We've been flagging these tailwinds for months and help explain the market’s resilience
But above all of this looms one big storm: Tariffs
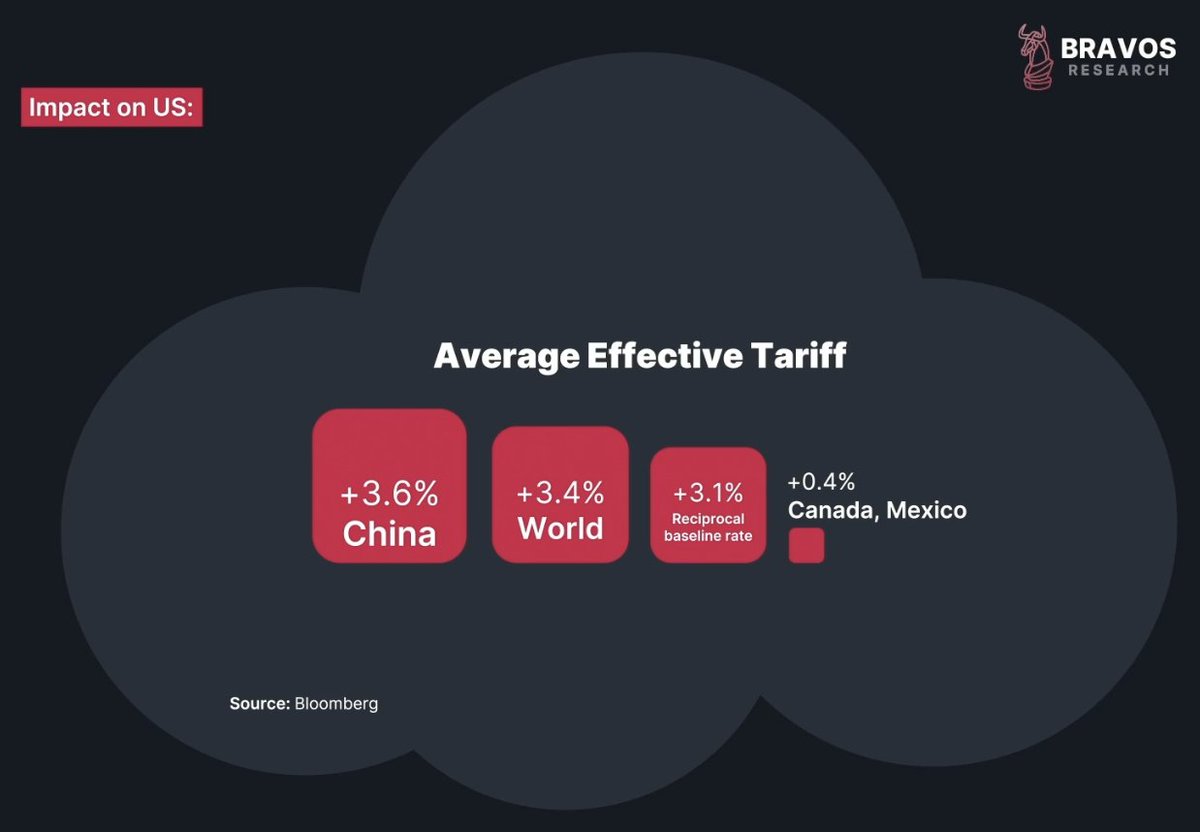
The US has just imposed a 3.6% average tariff on China, a brand-new number post-negotiation
But above all of this looms one big storm: Tariffs
The US has just imposed a 3.6% average tariff on China, a brand-new number post-negotiation

11/ Treasury officials say this 3.6% rate is just the floor
We’re also looking at a 3.4% average global tariff, a 3.1% reciprocal baseline, and an extra 0.4% specifically on Canada and Mexico
We’re also looking at a 3.4% average global tariff, a 3.1% reciprocal baseline, and an extra 0.4% specifically on Canada and Mexico
12/ Yes, those numbers are lower than what many feared, but they still affect $2 trillion in trade
That could shave off 1.5% from GDP
For comparison, GDP fell by 3% during the Financial Crisis
Tariffs may not cause a full-blown recession, but they’ll slow things down
In our opinion, this reduces the odds of the V-shape recovery
That could shave off 1.5% from GDP
For comparison, GDP fell by 3% during the Financial Crisis
Tariffs may not cause a full-blown recession, but they’ll slow things down
In our opinion, this reduces the odds of the V-shape recovery

13/ Just because a V-shape is unlikely doesn’t mean we’re going bearish
At Bravos Research, we’ve been putting capital to work
Our trades in BYD, gold, NRG, & ADMA have delivered double-digit gains recently
Get real-time Trade Alerts at:
go.bravosresearch.com/X
At Bravos Research, we’ve been putting capital to work
Our trades in BYD, gold, NRG, & ADMA have delivered double-digit gains recently
Get real-time Trade Alerts at:
go.bravosresearch.com/X

14/ So if not a V-shaped recovery, does that mean we’re headed for a deeper drop?
For that to happen, things need to get worse - economically or geopolitically
History shows this kind of post-bounce breakdown has happened many times before
For that to happen, things need to get worse - economically or geopolitically
History shows this kind of post-bounce breakdown has happened many times before
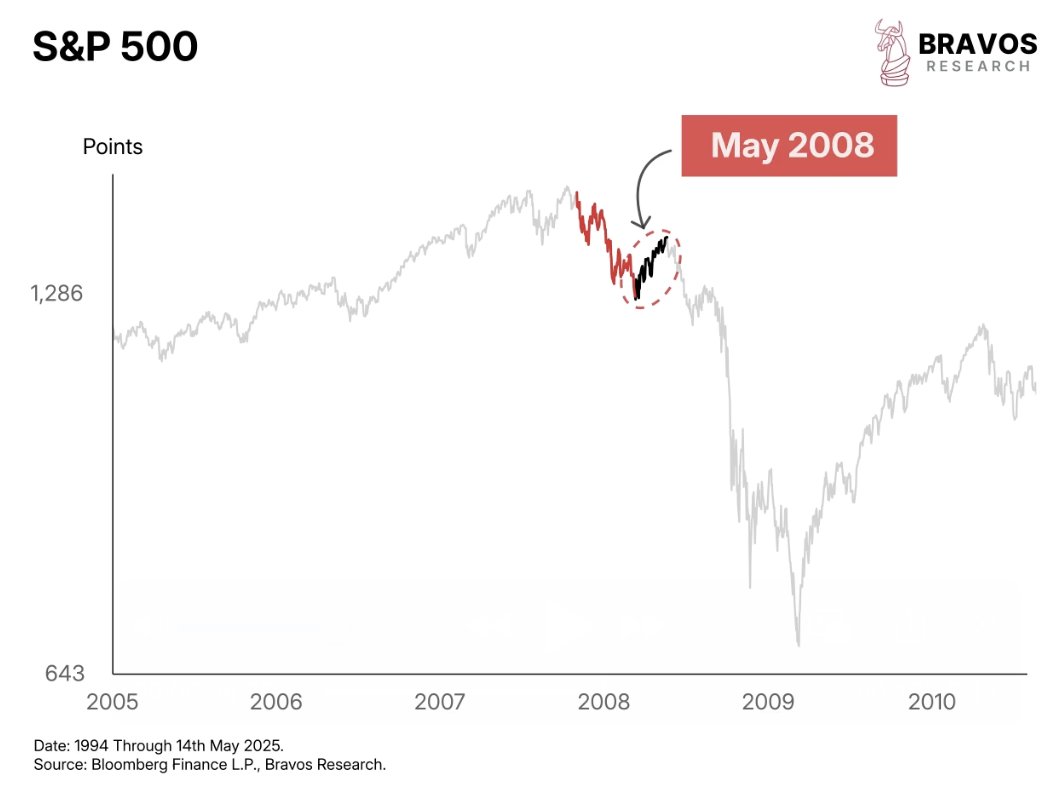
15/ In May 2008, stocks staged a rally after a sharp correction, but it didn’t last
The market eventually broke to new lows and fell much further
Similar failed rallies played out multiple times in 2001 as well
The market eventually broke to new lows and fell much further
Similar failed rallies played out multiple times in 2001 as well
16/ If that happens again today, most people already know what that means
It’s what everyone has been warning about since tariffs made headlines
And the first red flag is already here:
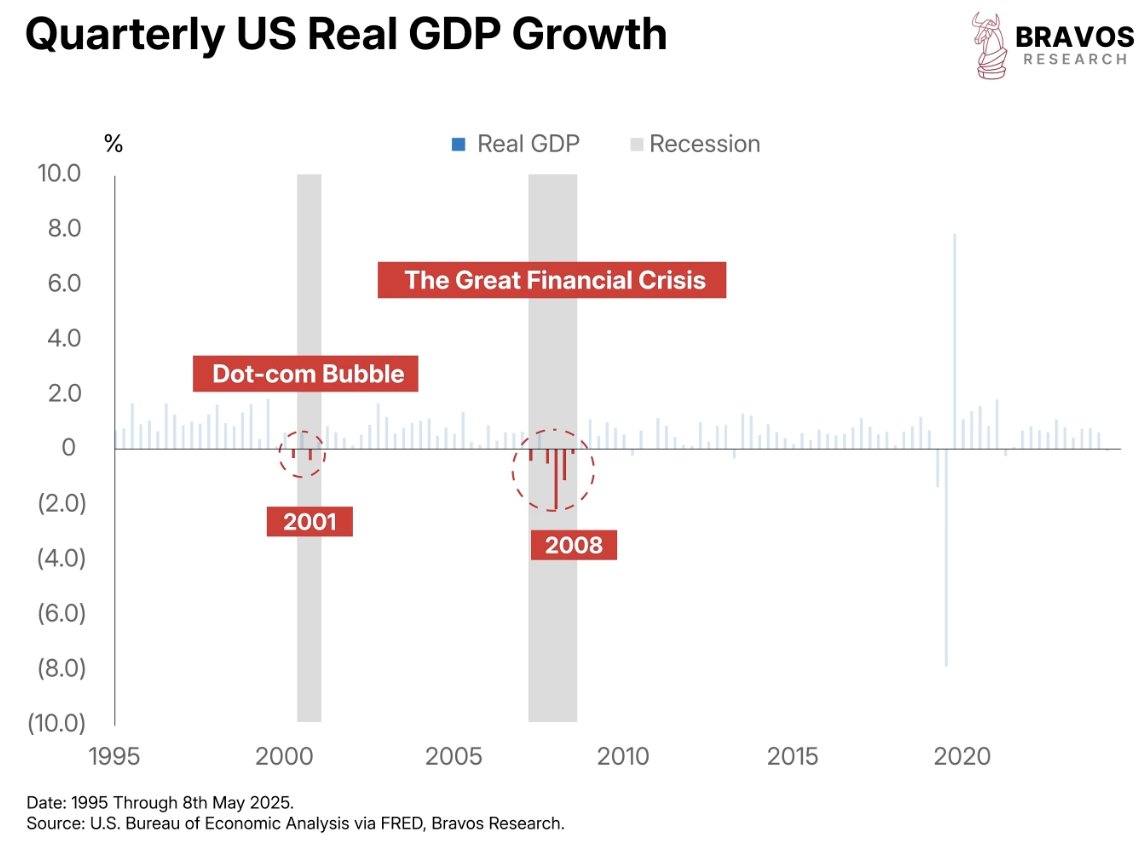
Q1 2025 posted a negative GDP print
It’s what everyone has been warning about since tariffs made headlines
And the first red flag is already here:
Q1 2025 posted a negative GDP print

17/ That’s exactly how things started in 2008 and 2001, both of which went on to become full-blown recessions
In each case, the initial GDP contraction was followed by further contraction
In each case, the initial GDP contraction was followed by further contraction
18/ In both of those recessions, stocks dropped over 50%
So if GDP keeps contracting, there’s a real risk that this year’s drawdown could just be the beginning of something bigger
So if GDP keeps contracting, there’s a real risk that this year’s drawdown could just be the beginning of something bigger

19/ But we’ve also seen single-quarter GDP declines that didn’t lead to recessions
Like we saw in 2022, 2014, and 2011
All were temporary slowdowns that turned into strong buying opportunities
Like we saw in 2022, 2014, and 2011
All were temporary slowdowns that turned into strong buying opportunities

20/ What was the key difference between those isolated contractions and full-blown recessions?
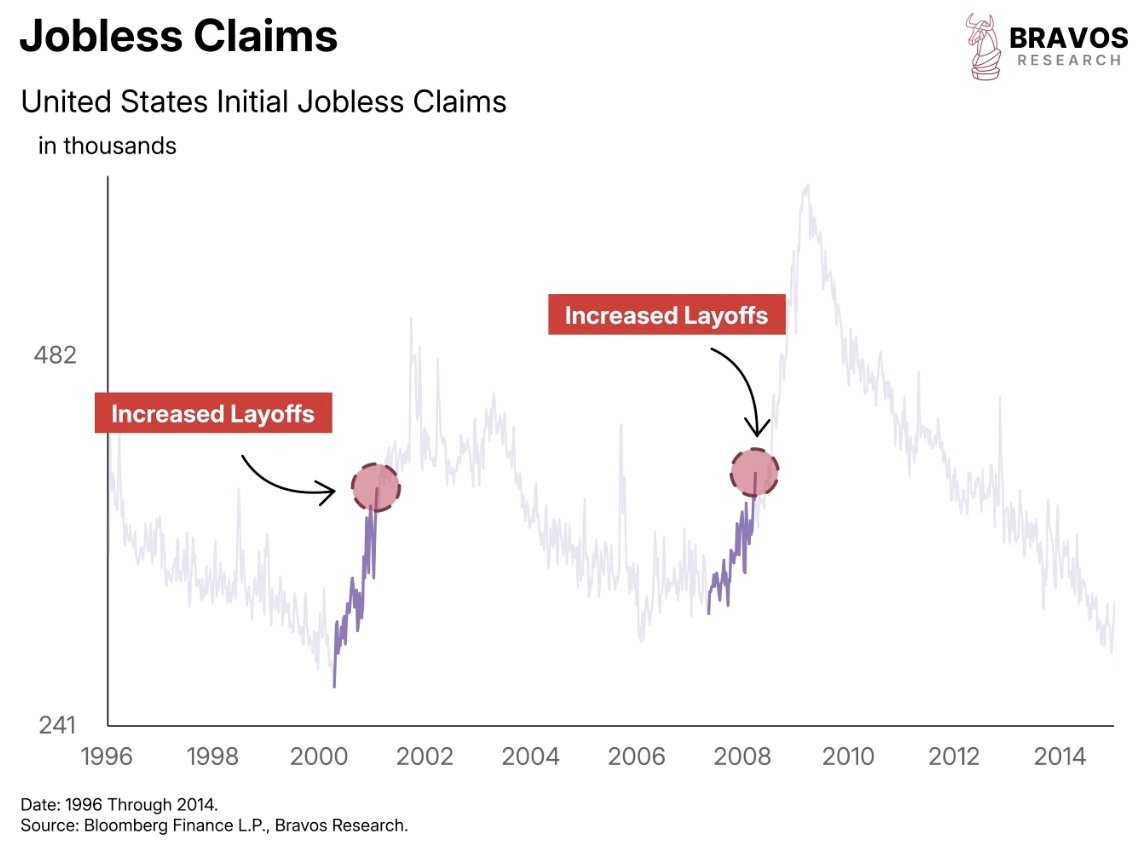
It was none other than the labor market
In 2001 and 2008, initial jobless claims surged alongside the negative GDP prints
Layoffs were clearly accelerating
It was none other than the labor market
In 2001 and 2008, initial jobless claims surged alongside the negative GDP prints
Layoffs were clearly accelerating
Generated by Thread Navigator
Press ⌘ + S to quick-export