A few people asked me about Nod's preprint about 2 spillovers.
He makes two arguments criticizing Pekar et al 2022.
A proper analysis of his 1st argument actually points in the opposite direction and strengthens Pekar's conclusions.
His 2nd argument is not well defined.
🧵

The outbreak in Wuhan is unusual.
Normally, when a single case of Covid starts an outbreak, it starts a single polytomy. We've observed this happening again and again, around the world.
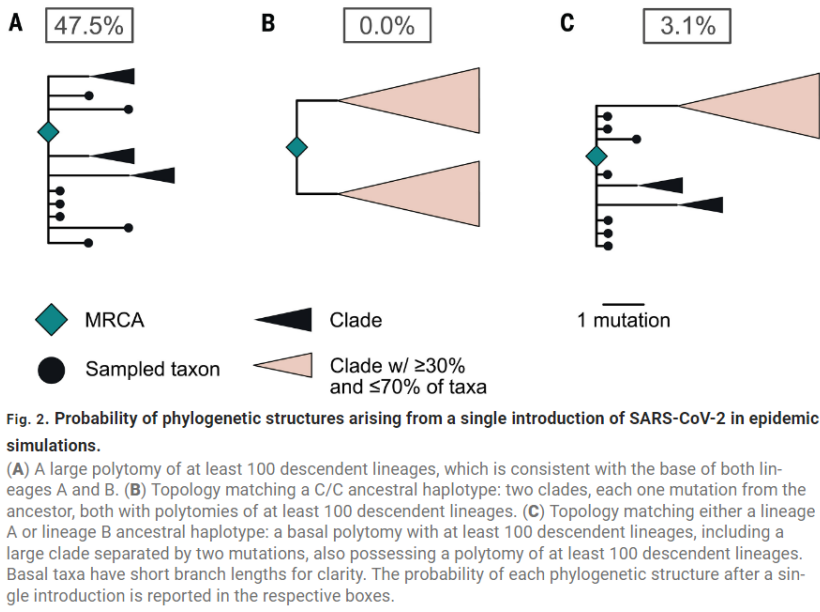
In Wuhan, there are 2 polytomies. Pekar theorized that was from 2 spillovers.
Normally, when a single case of Covid starts an outbreak, it starts a single polytomy. We've observed this happening again and again, around the world.
In Wuhan, there are 2 polytomies. Pekar theorized that was from 2 spillovers.

Because there are only 2 mutations separating the 2 lineages, this could also happen by chance, from 1 spillover.
Pekar's model said that was a rare thing to occur, with 3% odds from a single introduction.
Pekar's model said that was a rare thing to occur, with 3% odds from a single introduction.
(the odds are actually even lower than that, because the genetic clock is reversed. A spilled over after B. So it's probably closer to 0.3%, but let's ignore that for now)
How often do you get 2 polytomies from 2 spillovers?
The simplest calculation would be you just simulate 2 epidemics, and count how often both form basal polytomies
That gets you to a bayes factor of somewhere around 4X, in favor of 2 spillovers, not 1:
The simplest calculation would be you just simulate 2 epidemics, and count how often both form basal polytomies
That gets you to a bayes factor of somewhere around 4X, in favor of 2 spillovers, not 1:
View Tweet
Nod points out an additional constraint that Pekar missed.
Pekar required that the 2 polytomies both need to be equal and balanced, with each making 30-70% of the total genomes.
Pekar required this for the 1 introduction case but did not require it for the 2 introduction case.
Pekar required that the 2 polytomies both need to be equal and balanced, with each making 30-70% of the total genomes.
Pekar required this for the 1 introduction case but did not require it for the 2 introduction case.
If you look at the start time of all possible simulated epidemics, some grow really slowly and some grow quickly.
If you randomly pick 2 points from that curve, the two aren't always going to be close to each other.
If you randomly pick 2 points from that curve, the two aren't always going to be close to each other.
View Tweet
At this point, you should probably stop and think about what we're actually modeling here.
We're saying that it is possible for an epidemic that starts some random place in Wuhan to grow very slowly before it takes off.
We're saying that it is possible for an epidemic that starts some random place in Wuhan to grow very slowly before it takes off.
Maybe it starts in late September or early October, goes from person to person for a few weeks, and then takes off when it hits Huanan market.
That might represent something like, "one infected person from Yunnan visits Wuhan and starts the pandemic":
That might represent something like, "one infected person from Yunnan visits Wuhan and starts the pandemic":
View Tweet
What we're actually trying to model here is "2 spillovers at Huanan market". Everyone agrees the market is a reasonably good place for Covid to spread.
Some lab leakers think the market is the perfect place for Covid to spread, better than any other.
Some lab leakers think the market is the perfect place for Covid to spread, better than any other.
That part is debatable, I don't know how much better or worse it is than any other crowded building.
But we all agree it's a crowded building, so an introduction there quickly starts growing.
But we all agree it's a crowded building, so an introduction there quickly starts growing.
No one thinks that a spillover at the market is just going to start in September, bounce around from one person to one person for 2+ months, and then suddenly start growing quickly.
Pekar's code simulates transmission across a social network. Some nodes in that network are well connected, others are poorly connected. The slowly growing epidemics start at a poorly connected node and jump along such nodes for a while before hitting a well connected node.
If you simulate 2 spillovers at the Huanan market as two introductions into random places in that social network, then it's not a model that represents reality.
I ran some numbers here, with my own code. Suppose I simulate 2 spillovers, with lineage A and lineage B, at the same time.
Suppose those are completely independent of each other, i.e. they happen in different locations.
Suppose those are completely independent of each other, i.e. they happen in different locations.
I counted only the cases where both spillovers did not go extinct.
I found it's about 9% odds that the two will become balanced at 30/70 or closer.
If I just divide 9% by 3%, I get bayes factor 3.
So, by that logic, Nod did find something, he reduced ~4 down to ~3.
I found it's about 9% odds that the two will become balanced at 30/70 or closer.
If I just divide 9% by 3%, I get bayes factor 3.
So, by that logic, Nod did find something, he reduced ~4 down to ~3.
But, if we suppose a market outbreak is faster than a random introduction somewhere in Wuhan, then we actually want to put some constraint on that.
How should we quantify that?
How should we quantify that?
One approach would be to say a market spillover has no mutations before the basal polytomy forms.
Those epidemics happen a little faster than average, but they can still take a few generations to get going. Here's an example, with TMRCA marked by the orange line.
Those epidemics happen a little faster than average, but they can still take a few generations to get going. Here's an example, with TMRCA marked by the orange line.

Another approach would be to count epidemics where the TMRCA happens right after the first case.
These aren't so uncommon in general (I think it's ~33% of all simulations), and might be a good representation of what a introduction looks like in a high spread environment.
These aren't so uncommon in general (I think it's ~33% of all simulations), and might be a good representation of what a introduction looks like in a high spread environment.

Generated by Thread Navigator
Press ⌘ + S to quick-export