Since apparently we're doing tempo vs. quantum discourse today, let's remind everybody how this stuff works!
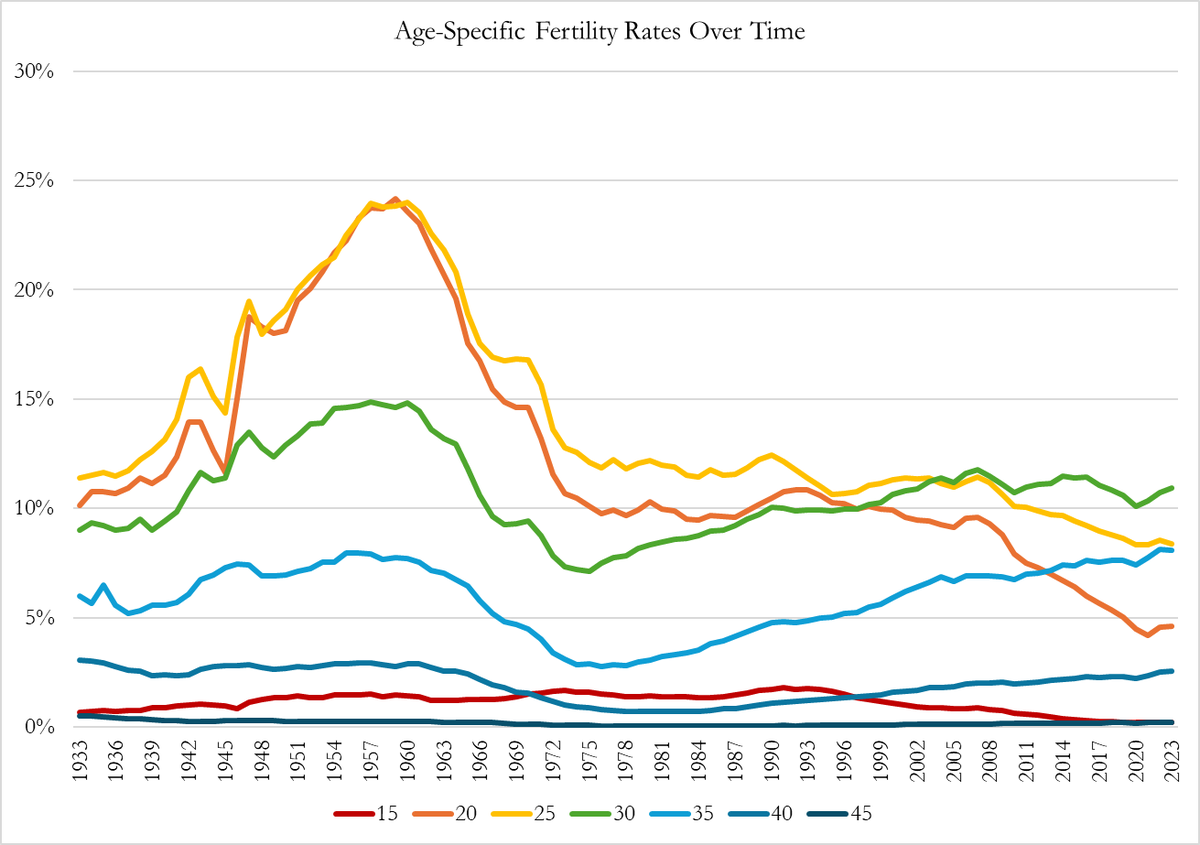
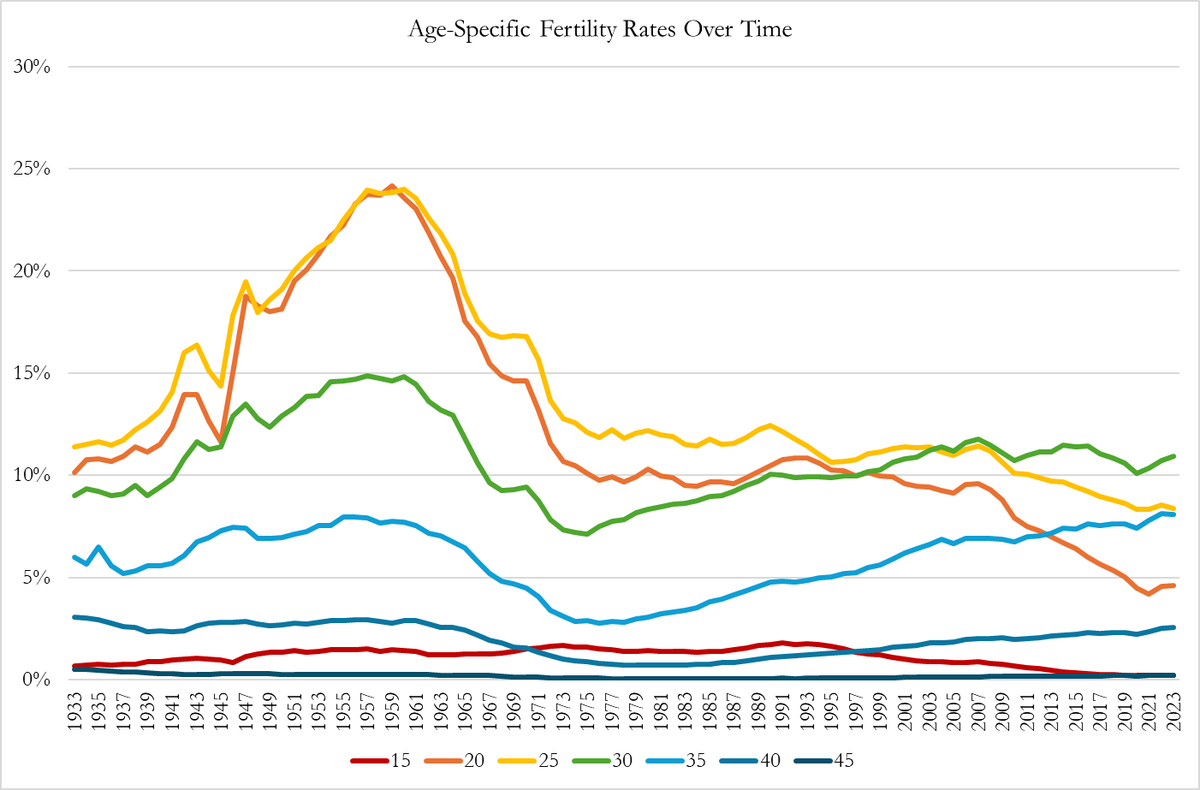
First of all, here's age-specific fertility rates at specific ages over time.
You can see that since 2000, the overwhelmingly largest decline is for age 20, then 25.


You can also see some other fun facts like:
35 year old women today are already having babies at the same rate as 35 year old women DURING THE BABY BOOM.
Same for 40-year-old women!
The birth rates of the 1950s are still here for geriatric pregnancies!
35 year old women today are already having babies at the same rate as 35 year old women DURING THE BABY BOOM.
Same for 40-year-old women!
The birth rates of the 1950s are still here for geriatric pregnancies!

The nice thing about ASFRs is since they are population-based we can just add'em over the life course.
If ASFRs fell by 5% at age 20, then for lifetime completed family size to be stable, they must rise 5% at some later age.
What age do we suppose that's gonna happen at?
If ASFRs fell by 5% at age 20, then for lifetime completed family size to be stable, they must rise 5% at some later age.
What age do we suppose that's gonna happen at?

Are we about to see births at age 35 rise to an ASFR of 12%? Will ASFRs at 30 go to 15%? These aren't impossible numbers, but it doesn't seem like we are imminently approaching those numbers.
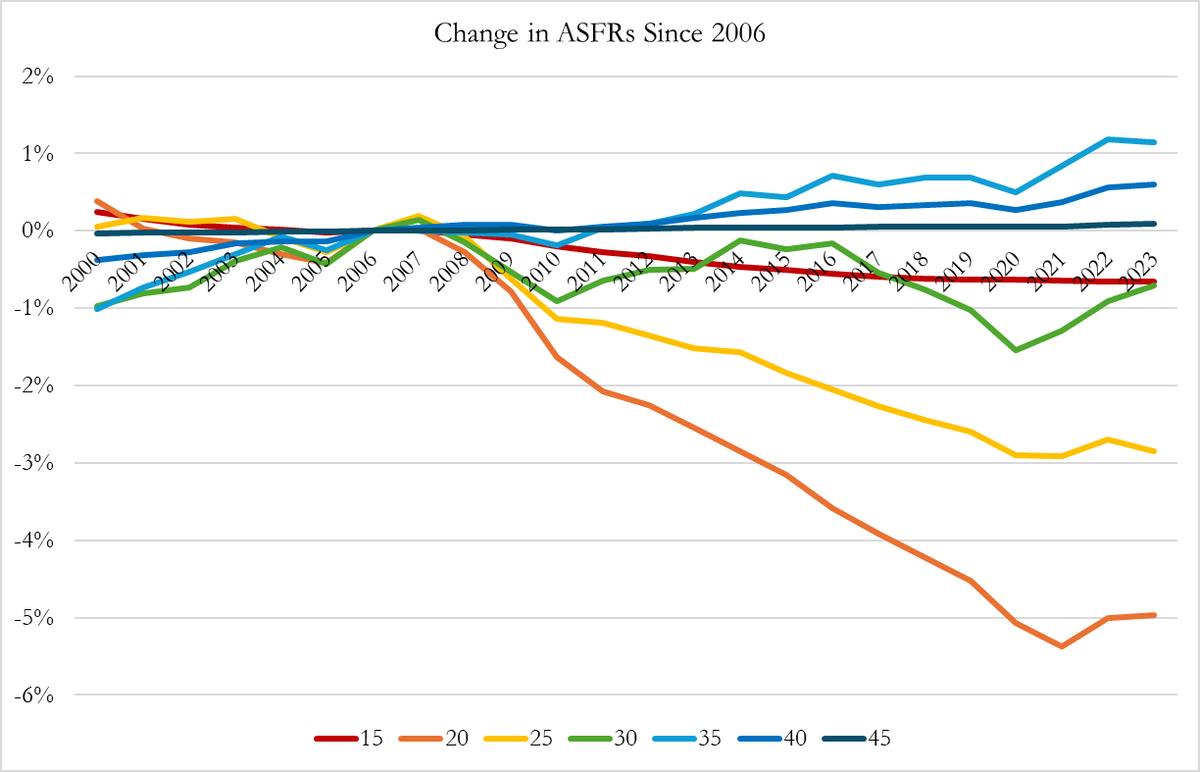
For fun, let's look at how ASFRs have changed since 2006, the last time we had ~replacement rate fertility.
Decline in births to 15 year olds is a trivially small share of the decline.
It's NOT TRUE that declining "teen births" are a big part of the story of recent declines.
Decline in births to 15 year olds is a trivially small share of the decline.
It's NOT TRUE that declining "teen births" are a big part of the story of recent declines.

On the other hand, there's a HUGE decline in ASFRs at ages 20 and 25: early adulthood.
Now, some people may think that's a fine thing! I get that!
But right off the bat, we have to note that a popular story that this is about falling non-adult motherhood is wrong.
Now, some people may think that's a fine thing! I get that!
But right off the bat, we have to note that a popular story that this is about falling non-adult motherhood is wrong.

Next, we should note that births are even falling at age 30, though not as severely. Births are rising at ages 35 and 40, but not by nearly as much as they declined at earlier ages.
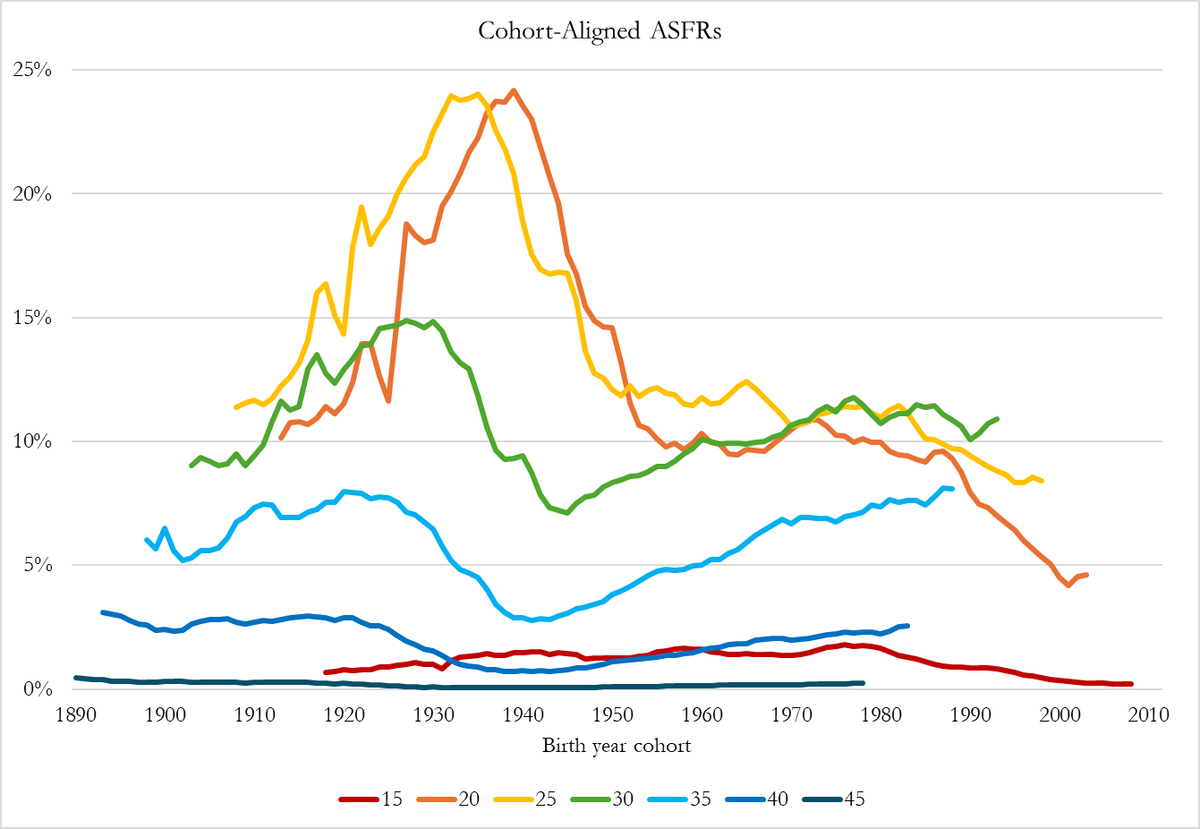
Okay, now, let's re-align all our lines so that we are comparing the same cohorts of women at age 15, 20, 25, 30, 35, etc.
Take women born in 1970. Red line shows ASFR as 15 was about 1%. Orange at 20 was about 11%. Yellow at 25 was also about 11%. Green at 30 also 11%. etc
Take women born in 1970. Red line shows ASFR as 15 was about 1%. Orange at 20 was about 11%. Yellow at 25 was also about 11%. Green at 30 also 11%. etc

Then look at the 1993 cohort, the last group I have data on at age 30.
They were about 0.5% at age 15, then 7% at age 20, then 9% at age 25, then 11% at age 30. At age 35 they will probably be about 8%, vs. 7% for the 1970 cohort. At 40 they may be at 3%, vs. 2% for 1970 coh.
They were about 0.5% at age 15, then 7% at age 20, then 9% at age 25, then 11% at age 30. At age 35 they will probably be about 8%, vs. 7% for the 1970 cohort. At 40 they may be at 3%, vs. 2% for 1970 coh.

The upshot is that while women born in 1970 ended up having about 2.12 kids, women born in 1993 can expect to have just 1.89: 0.23 fewer kids per woman or, put another way, 25% of women are "missing" one child vs. a 1970-cohort counterfactual.
Now, it's true that most of this decline came early in life: before age 25, and a fair amount at age 20 or less!
That has erroneously led some scholars to claim that this is just delayed fertility.
But we now know this isn't true, and you can see how we know:
That has erroneously led some scholars to claim that this is just delayed fertility.
But we now know this isn't true, and you can see how we know:

Basically, we have enough data now across enough cohorts that we can answer questions like, "Did the declining early-in-life births actually get made up through rising later-in-life births?"
For recent cohorts the emerging answer is largely "no."
For recent cohorts the emerging answer is largely "no."
There is some late-in-life increase, but not nearly enough to compensate for the early-in-life declines.
Thus, it is a factual error (and when demographers do it, a knowingly false statement) to say that what we are observing is "just" or "only" or "primarily" "delay."
Thus, it is a factual error (and when demographers do it, a knowingly false statement) to say that what we are observing is "just" or "only" or "primarily" "delay."
It is true that at the psychological level most people in these cohorts believe themselves to be engaged in delaying-behavior, a change in the tempo of births rather than the total target number or quantum, but at the population level the tempo effect becomes a quantum effect.
Because these "delays" tend not to be made up, this should influence our selection of fertility indicators for assessing the situation in real-time.
Completed fertility can't be measured in real-time for currently-reproducing cohorts, because by definition it's not complete yet!
Completed fertility can't be measured in real-time for currently-reproducing cohorts, because by definition it's not complete yet!
The leading contenders for real-time measures are either the total fertility rate, or some of a variety of adjusted total fertility rates.
The total fertility rate takes the ASFRs shown in this graph for a year and just sums them across all ages.
The total fertility rate takes the ASFRs shown in this graph for a year and just sums them across all ages.
If you think birth rates are falling merely because of delays which will eventually be made up, then the TFR is a very bad indicator, since delayed births would show up as falling young-ASFRs but not as rising older-ASFRs until much later on.
If you think that tempo-adjustments will be made up for, then you want an adjusted measure.
The most sophisticated such measure is called the Bongaarts-Sobotka method for a tempo- and parity-adjusted total fertility rate, or TFRp*.
The most sophisticated such measure is called the Bongaarts-Sobotka method for a tempo- and parity-adjusted total fertility rate, or TFRp*.
The details are boring but this method scrupulously accounts for the age-specific rates at which women are progressing from 0 to 1, then 1 to 2, then 2 to 3, etc births, and accounts for ongoing shifts in birth spacing and initiation of birth.
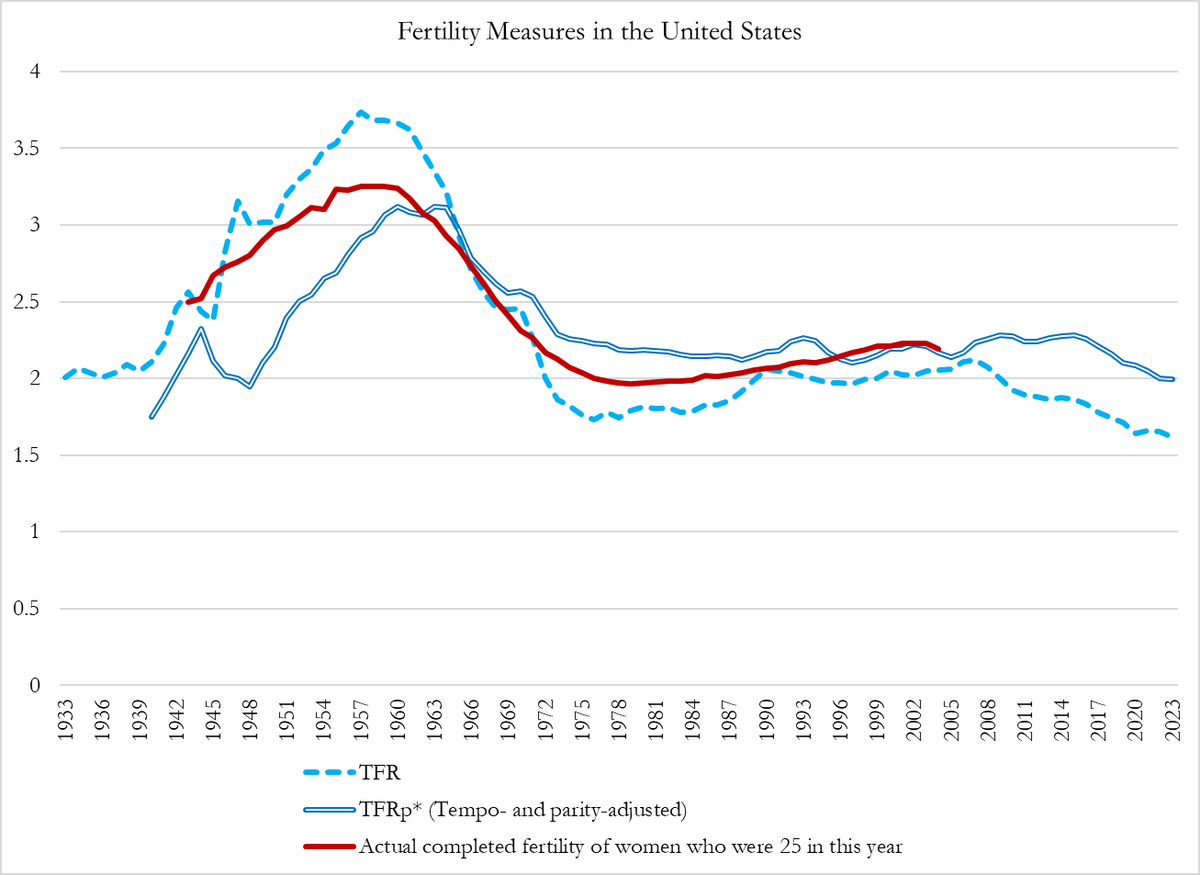
I have calculated TFR and TFRp* for the US, as well as completed fertility for cohorts who turned 25 in each year, in the graph below.
As you can see, TFR is a CLOSER FIT to completed fertility than TFRp*.
Formally, TFR:CFR=0.99, while TFRp*:CFR=0.72.
As you can see, TFR is a CLOSER FIT to completed fertility than TFRp*.
Formally, TFR:CFR=0.99, while TFRp*:CFR=0.72.
Generated by Thread Navigator
Press ⌘ + S to quick-export