Claude Graph Engineering 101

A practical guide to graph engineering: wtf is a graph & how do I deploy one today?

Over the past month, graph engineering has taken 𝕏 by storm - and for good reason. It's the next logical step to loop engineering.
In this article, I'm breaking down exactly why loops fall apart at scale, what graph engineering actually is, and how to build one yourself.
Table of Contents
I: The Problem With Loops
II: wtf is a Graph?
III: How to Build a Graph
IV: Final Tips
This is one of the highest-leverage things you can learn right now - be sure to bookmark this so you don't lose it.
l: The Problem With Loops
A quick intro to loops
In case you're unfamiliar, "loops" allow AI agents to complete tasks end-to-end on their own.
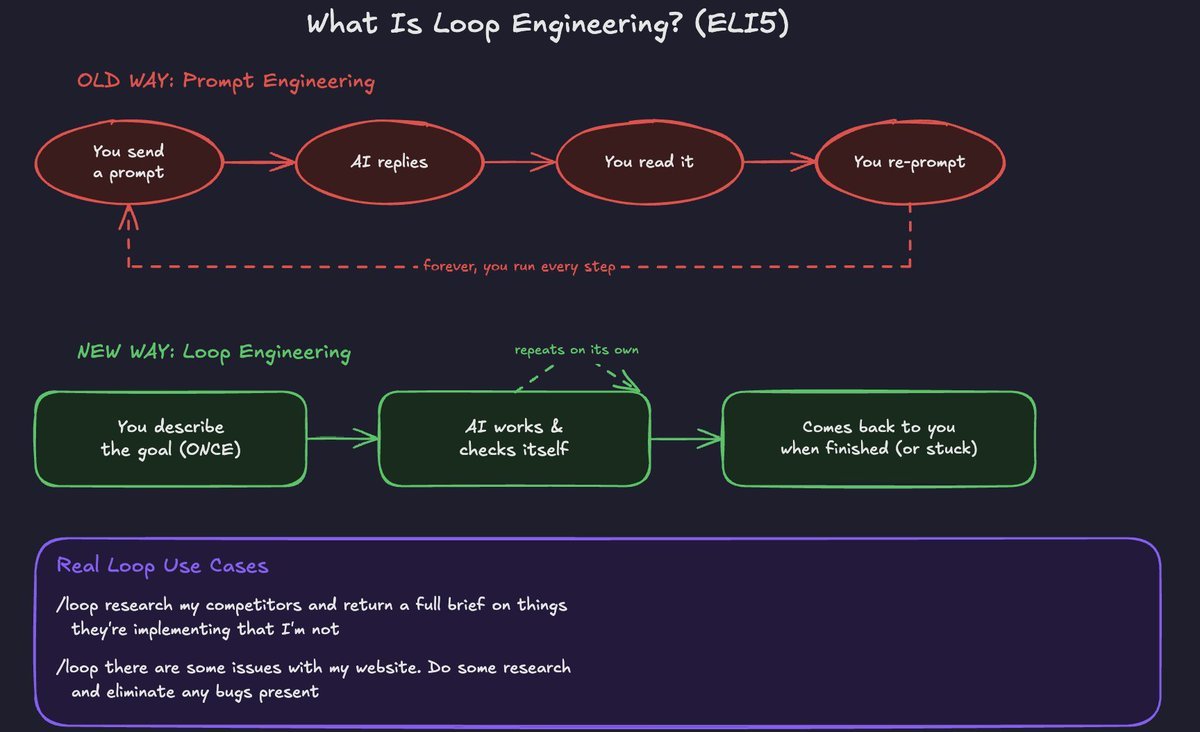
For the last couple of years, using AI worked like this:
You send a prompt → AI replies → You read it → You re-prompt
This is classic prompt engineering - where you're the one running every step of the process for getting AI outputs.
Loop engineering automates this entire process.
Instead of typing message after message, you set up a goal once, and the AI keeps working on it by itself.
The problem with loops is that once the work gets complex, they very easily hit a wall.
A traditional agent loop runs four phases in order:
Observe → Act → Verify → Repeat
All actions happen one step at a time. That's the whole design, and it's also the whole problem.
Loops can't run things in parallel, and this is the biggest limitation.
For example: if your task has four independent pieces of research, a loop does them one after another.
The reality is, work isn't linear like loop engineering structures it. Real work has branches, dependencies, things that could happen simultaneously, and things that genuinely have to wait.
In theory, building loops that can work concurrently is the next logical step to loop engineering - aka graph engineering.

II: wtf is a graph?
Understanding graph engineering (explain like I'm 5)
Where did graph engineering come from?
Graphs as a term exploded on 𝕏 when Peter Steinberger (creator of OpenClaw) posted this tweet.
Within days, there were competing definitions, a wave of copycat posts, and even a fabricated study claiming a Stanford grant that never existed.
I like to think of graphs as the fourth step in a progression you've probably lived through:
2023 → prompt engineering
2025 → context engineering
June 2026 → loop engineering
July 2026 → graph engineering
wtf is a graph?
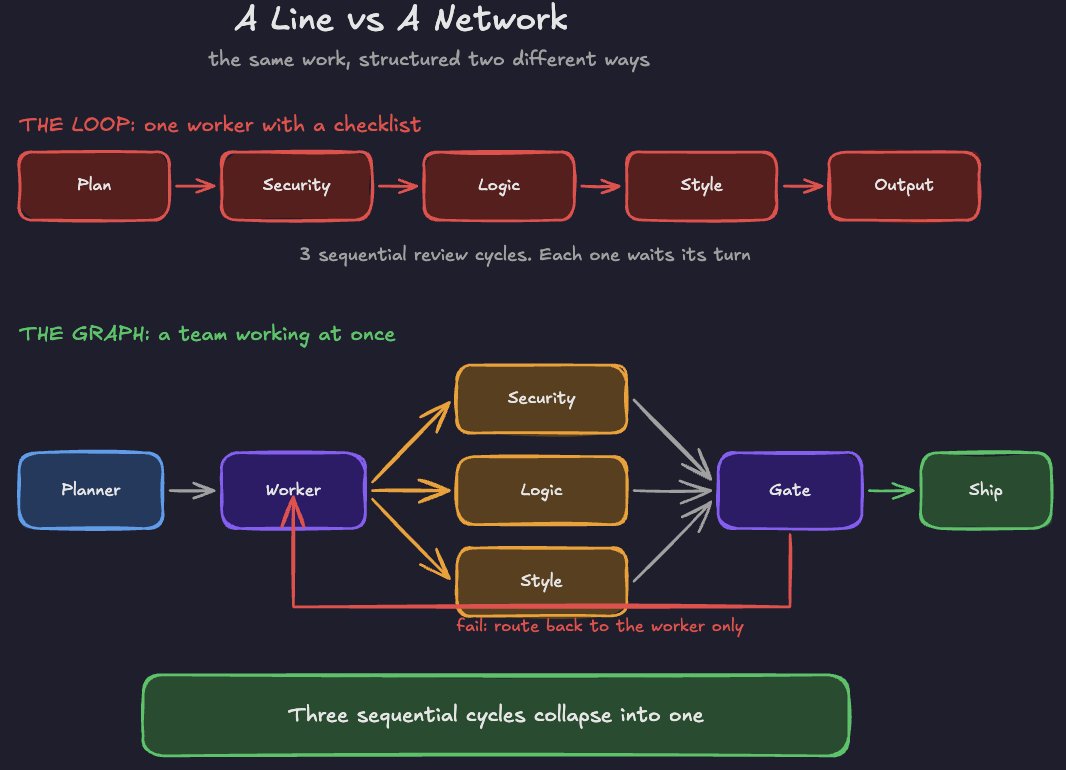
Think of graph engineering as designing your AI workflow as a network rather than a line.
Instead of one agent working through steps in order, you build a structure.
Nodes then do specific jobs, connected by paths with conditions attached.
Work branches out, runs in parallel, then converges.
What a graph actually looks like
Here's the most common shape (and the one that went viral when people started posting about graphs):
This is essentially the same work as a loop, but with a fraction of the time needed to complete the task since multiple loops are running at once.
This type of graph structure is why you've probably seen many viral "graph" images floating around like the ones below:
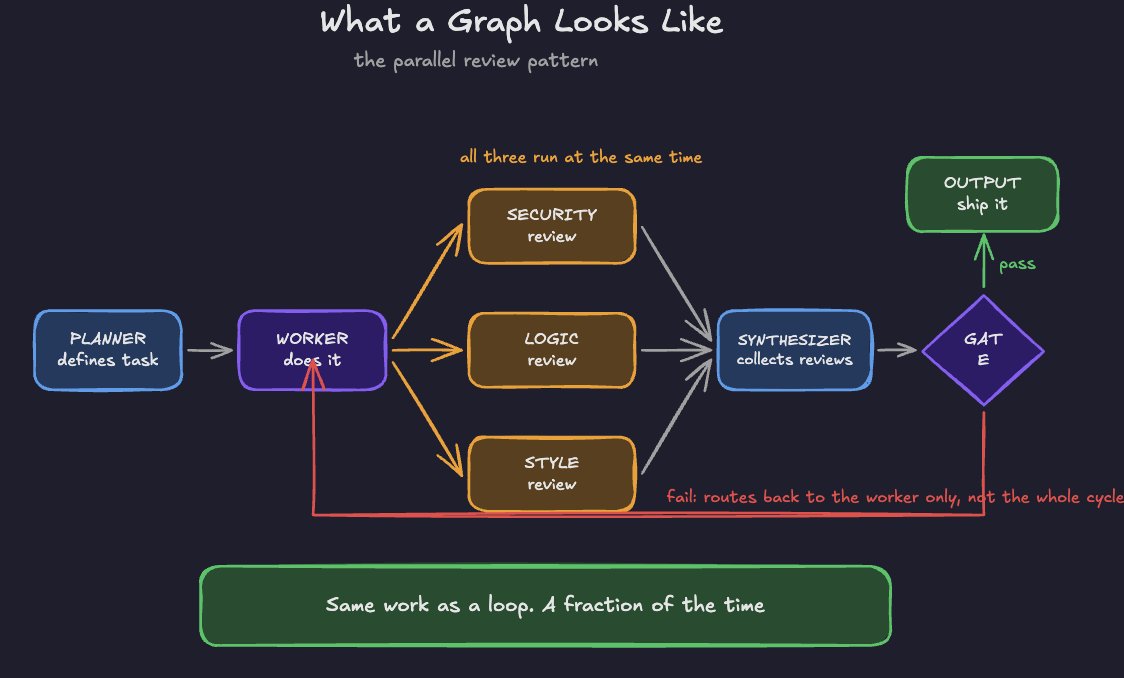

This is a relatively accurate and simple way to physically visualize graphs. They are essentially just tasks branching off of nodes that run concurrently.
So, how do you actually build and implement graphs into real AI workflows for better productivity?
III: How to Build a Graph
The good news is, you don't need to be technical to understand and implement effective graphs.
There is a very specific step-by-step process that anyone can use to start deploying graphs:
Step 1: Audit your current loops
Before changing anything, look at what you already run.
For each workflow, ask yourself:
This audit process is to find bottlenecks in your existing loops. Once you clearly define 1-2 bottlenecks, you can move on to step two:
Step 2: Find what can run in parallel
Go through your audit and ask one question of every step:
Does this depend on another step's output?
If the answer is no, it's a candidate for parallel execution.
The patterns that I've found come up most:
These tasks can often run on their own and aren't dependent on a prior output like a verification would be.
Step 3: Physically draw the graph
You can use a tool like the Excalidraw MCP for this step, or literally hand-draw how you envision your graph being deployed.
A real example
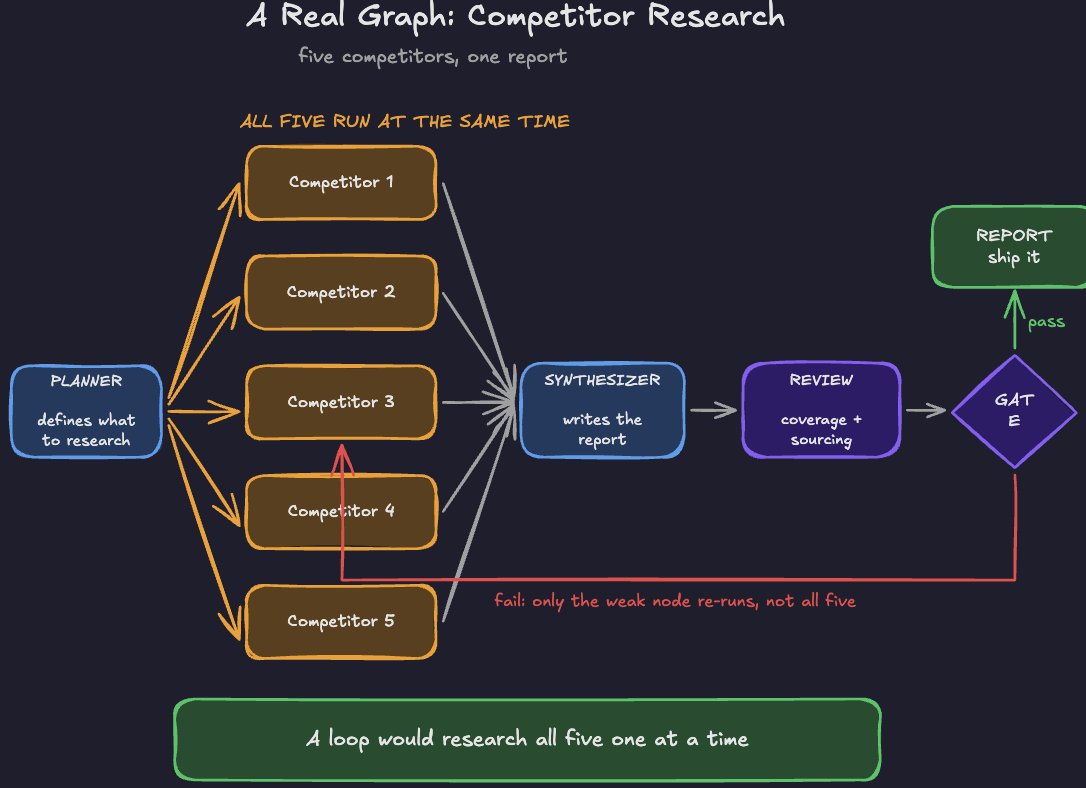
Let's say the task is: research five competitors and produce a positioning report.
As a loop, that runs one competitor at a time. Research the first, then the second, then the third, then write everything up, and if the write-up is weak, start the whole thing again.
As a graph, it looks like this:
Planner node → Reads the brief and defines what needs finding for
each competitor
Five research nodes → One per competitor
Synthesizer node → Collects all five research outputs and writes
the positioning report
Review node → Checks the report against the original brief
Step 4. Graph prompt
Next, go ahead and take a screenshot of your graph, and send it to Claude with this prompt:
GRAPH PROMPT

"Run this as a graph, not a sequence.

1. Plan: define what to research for each competitor - pricing,
positioning, features, recent launches.

2. Dispatch 5 subagents IN PARALLEL, one per competitor. Do not
run these sequentially.

3. Synthesize: collect all 5 outputs into a single positioning
report.

4. Review: check the report against the brief for coverage,
sourcing, and whether it answers the question.

5. Gate: if the review fails, route feedback back to the specific
node that caused it. Do not re-run the whole graph.

Tell me which nodes ran, in what order, and what each returned."
To be clear, the mechanism used here is subagents. A graph is just what you get when you give those subagents defined roles, dispatch them in parallel, and write a rule for where failures go.
For most people, this four-step framework will work perfectly for deploying graphs in Claude and even Codex.
Of course, you can make this significantly more complex by adding nodes/agents and getting very specific with the failure rules, success criteria, and so on.
IV: Final Tips
A few tips worth knowing before you start deploying graphs:
Closing Out
I hope you found this simple and practical guide to graph engineering helpful.
In future articles, I might dive deeper into graph engineering, but this is a good starting place for most of you.
If you enjoy AI content in a written format, feel free to subscribe to my free AI newsletter.
Every Wednesday, I send a practical AI guide you can implement. Whether it's a cool AI workflow or a prompting guide, I try to cover the things I'm actually using in AI each week.
Sign up & visit the most recent publication here:

100% free, no spam ever & unsub anytime
Lastly, be sure to follow me here @aiedge_ for weekly article uploads.💙
